HAL Id: hal-01780128
https://hal.archives-ouvertes.fr/hal-01780128
Submitted on 7 Nov 2018
HAL is a multi-disciplinary open access
archive for the deposit and dissemination of sci-entific research documents, whether they are pub-lished or not. The documents may come from teaching and research institutions in France or abroad, or from public or private research centers.
L’archive ouverte pluridisciplinaire HAL, est destinée au dépôt et à la diffusion de documents scientifiques de niveau recherche, publiés ou non, émanant des établissements d’enseignement et de recherche français ou étrangers, des laboratoires publics ou privés.
Use of ress and sas processes for powder generation of
an active substance
Hubert Lochard, Martial Sauceau, Élisabeth Rodier, Jean-jacques
Letourneau, Jacques Fages
To cite this version:
Hubert Lochard, Martial Sauceau, Élisabeth Rodier, Jean-jacques Letourneau, Jacques Fages. Use of ress and sas processes for powder generation of an active substance. WCPT4 -World congress on particle technology 4, Jul 2002, Sydney, Australia. 6 p. �hal-01780128�
USE OF RESS AND SAS PROCESSES FOR POWDER
GENERATION OF AN ACTIVE SUBSTANCE
H. Lochard*, M. Sauceau, E.Rodier, JJ. Letourneau and J. Fages Ecole des Mines d’Albi, UMR CNRS 2392, 81013 Albi, France
E-mail: hubert.lochard@enstimac.fr, Fax: 33 (0)5 63 49 30 25
INTRODUCTION
Particle generation using supercritical processes gives active substances with high purity and with improved properties of dissolution. However, these techniques may require a costly initial investment. Therefore, it is high value products such as those of the pharmaceutical industry which remain the most concerned by their industrial development.
Many of the new chemical entities coming out from the research departments of the pharmaceutical industry are poorly water soluble. As water is obviously the basis of any biological fluid, one the largest challenges the scientists have to address nowadays is: how to make these molecules more soluble and thus bio-available and active for living organisms?
The bio-availability of these new molecules depends on their rate of absorption by the gastro-intestinal tract. This in turn is highly dependable on their dissolution rate. The dissolution depends further on the particle size, morphology, crystalline form and specific surface area. Particle generation processes like RESS and SAS can positively and strongly influence these parameters.
After a presentation of the experimental set-up, this paper presents the main results obtained for both SAS and RESS processes. The opportunity of using the former or the latter according to the particle production parameters is then discussed.
MATERIALS AND METHODS
The experiments were carried out in a polyvalent pilot plant (Separex, France) designed to perform extraction, RESS (with and without co-solvent) and SAS. A schematic diagram of the apparatus is shown in figure 1. Carbon dioxide is cooled and stored in a liquid CO2 storage tank (2). It is circulated by a membrane pump (Lewa, Germany) (3).Compressed
CO2 passes then through a heat exchanger (4) and becomes supercritical.
In RESS configuration, supercritical CO2 flows through a stainless steel basket
containing the organic compound to be extracted which has been placed in a two liters extraction vessel (5). Then, the mixture is precipitated through a nozzle (6) with a diameter of 340 µm (Spraying system, France) and collected in a porous bag (7). If necessary, a co-solvent injection (1) can be performed immediately upstream of the heat exchanger (13).
In SAS configuration, the solution (9) is injected into the CO2 stream before reaching
the nozzle (Spraying system, France) by an HPLC pump (8) (GILSON, 307 piston pump) and sprayed. The powder formed is collected in a porous bag. CO2-solvent mixture is
depressurised (10) and separated in cyclonic separators (11). After purification through an active carbon bed (12) and cooling (14), the condensed CO2 runs back to the liquid CO2
storage tank.
Powder obtained was characterised by a Scanning Electron Microscope (XL30, Philips, Netherlands) and the specific surface area is measured using the BET method (ASAP, 2010 Micromeritics).
T F CO2 6 7 10 11 12 9 8 5 4 13 3 2 14 1 P P P P P 11 11 1 : Co-solvent
2 : Liquid CO2 storage tank 3 : membrane pump 4 : Heater
5 : Extractor (RESS) 6 : Nozzle
7 : Particule formation vessel 8 : Liquid pump (SAS) 9 : Solution (SAS)
10 : Back pressure regulator 11 : Cyclonic separators 12 : Adsorption bed
13 : Liquid pump (RESS) 14 : Condenser
F : Flowmeter P : Manometer T : Thermometer
Figure 1. Schematic diagram of the supercritical set-up
CO2 (purity 99,995%) was supplied by Air liquide S.A., dimethylsulfoxide (DMSO)
(purity +99%) was obtained from Aldrich.
RESULTS
Equilibrium solubility data of the compound in supercritical CO2 were measured on a
continuous flow apparatus [1] at medium temperatures. In these conditions this compound has a very low solubility in pure supercritical CO2. For example, at 45°C and 202 bars the
solubility of the solid was measured at 6.9 10-3 g per kg of CO2 [2]. Therefore, the SAS
process appeared to be the most suitable for temperatures below 65°C.
However, for higher temperatures, by extrapolating experimental measurements with a Chrastil correlation [2] [3], it appeared that the solubility was no longer negligible: 0.15 g/kg at 300 bars, 80°C and 0.3 g/kg at 300 bars and 100°C. Therefore, the RESS process became feasible provided the working temperature was high enough.
SAS Process
The choice of a solvent is a compromise between several elements: its toxicity, its miscibility with supercritical CO2 and the solubility of the drug in the solvent.
Dimethylsulfoxide (DMSO) is adapted provided that its residue is low in the crystallised powder. Several studies have already been performed on DMSO behaviour in supercritical CO2 [4] and its use for powder generation [5].
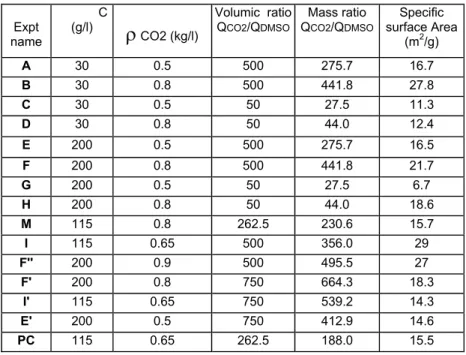
Three main parameters were studied (cf Table 1): the solute concentration in the DMSO solution , C= 30, 115 and 200 g/l of DMSO; the volumic flow rate ratio anti-solvent/solvent = 50, 262, 500 and 750 and the density of CO2 ( a function of pressure and
temperature) =500 kg/m3 (140 bars, 65°C), 650 kg/m3 (165 bars, 60°C), 800 kg/m3 (210 bars, 50°C) and 900 kg/m3 (270 bars, 40°C). These process conditions are schematically represented in figure2. Expt name C (g/l)
ρ
CO2 (kg/l) Volumic ratio QCO2/QDMSO Mass ratio QCO2/QDMSO Specific surface Area (m2/g) A 30 0.5 500 275.7 16.7 B 30 0.8 500 441.8 27.8 C 30 0.5 50 27.5 11.3 D 30 0.8 50 44.0 12.4 E 200 0.5 500 275.7 16.5 F 200 0.8 500 441.8 21.7 G 200 0.5 50 27.5 6.7 H 200 0.8 50 44.0 18.6 M 115 0.8 262.5 230.6 15.7 I 115 0.65 500 356.0 29 F'' 200 0.9 500 495.5 27 F' 200 0.8 750 664.3 18.3 I' 115 0.65 750 539.2 14.3 E' 200 0.5 750 412.9 14.6 PC 115 0.65 262.5 188.0 15.5Table 1. Experimental conditions for SAS process
As shown in figure 2, crystallisation failed at the lowest CO2 density and lowest
volumetric ratio CO2/DMSO. That corresponds to the lowest mass ratio (QC02/QDMSO =
27.5). As a result of insufficient anti-solvent, high supersaturation could not be achieved, crystallisation was too slow and most of the powder had crystallised after the particle formation vessel. When the trial was successful, all the powder obtained was collected in the porous bag. It looked very expanded, with a low apparent density of about 30 kg/m3.
Figure 2. Diagram of experimental conditions for SAS process
Because of the shape of the particles (fibres or rods), laser scattering granulometry was unsuitable, thus microparticle size and shape were characterised with a Scanning Electron Microscope (SEM).
Figure 3. experiment G Figure 4. experiment PC Figure 5. experiment F’
Three kinds of particles can be distinguished. The first one corresponds to the failed attempts performed at the lowest mass ratio (QC02/QDMSO = 27.5), it corresponds to Figure
3 (experiment G). Rods observed are heterogeneous, short (1-3 µm) and thick (diameter=0.7-1.2µm). The second one corresponds to attempts performed at intermediate mass ratio (100 ≤ QC02/QDMSO ≤ 450). Fibres are more homogeneous, thinner (d=0.35µm) and longer (5-20
µm), an example is presented in Figure 4 (experiment PC). Figure 5 (experiment F’) represents fibres obtained for the highest mass ratio (QC02/QDMSO > 450), they were about
the same length but are much thinner (d=0.09µm). In some experiments, the fibres were interconnected and formed a network. In others, two kinds of particles can coexist in the same powder.
QuickTime™ et un décompresseur TIFF (non compressé) sont requis pour visualiser
cette image. QuickTime™ et un décompresseur
TIFF (non compressé) sont requis pour visualiser cette image.
QuickTime™ et un décompresseur Photo - JPEG sont requis pour visualiser
cette image.
E
F "
G
: successful attempts
: failed attempts
C (g/l)
A
B
C
DF
H
I ’
PC
F ’
M
I
E ’QCO
2/QDMSO
ρ CO
2Surface area analysis by the BET method showed a significant increase in the specific surface area (table 3) when crystallisation was successful. High CO2/DMSO ratio and high
CO2 density seem to further high specific surface area, but specific surface area cannot be
correlated to particle shape. The influence of compound concentration in the injected solution is not clear.
RESS process
We carried out 3 RESS experiments. The experimental conditions and results are summarised in table 2. Post-expansion pressure and temperature in the crystallisation vessel were set at 80 bars and 60°C.Under these conditions, carbon dioxide is in a single phase and can be recycled.
RESS 1 RESS 2 RESS 3
Pre-expansion Temperature 100 °C 80 °C 100 °C
Pre-expansion Pressure 300 bars 300 bars 265 bars
Post-expansion Temperature 60 °C 60 °C 60 °C
Post-expansion Pressure 80 bars 80 bars 80 bars
Expected solubility (Chrastil) (g/kg) 0.35 0.14 0.21
Yield 0.381 0.164 0.098
Specific surface area (m2/g) 44 50.7 67.3
Table 2. Experimental conditions and results for RESS process
All tests were successful. The powder obtained was fine-grade, with a low apparent density (about 12 kg/m3), pulverulent and electrostatically charged. The yield calculated in table 2 is the ratio of the mass of powder collected over the theoretical mass predicted by the Chrastil model [3]. This low yield can be explained by an incomplete saturation of supercritical fluid (insufficient residence time, too high CO2 flow rate, too low surface
contact).
Figure 6. experiment RESS 1 Figure 7. experiment RESS 1
Figures 6 and 7 show the SEM of the powder obtained by RESS 1. Fibres are short (1-3 µm) and thin (0.1-0.2µm). Fibre clusters seem to be shorter and less cohesive than those obtained by SAS process, which explains the light and pulverulent nature of the powder. As can be seen in table 2, surface areas of the material produced by RESS are very high
compared to the surface area of the starting materials (surface area = 3.9 m2/g) and those obtained by SAS process.
CONCLUSION
apparent density Particle
shape
particle diameter particle length Specific surface area initial powder 3000 kg/m3
rods 0.20-0.70 µm 0.4-5 µm 4 m2/g
SAS "lowest mass ratio" (Figure 3)
3000 kg/m3
rods 0.70-1.20 µm 1-3 µm 7-11 m2/g
SAS "intermediate mass
ratio" (Figure 4) ≥ 25 kg/m
3
rods 0.35 µm 5-20 µm 12-29 m2/g
SAS "higher mass ratio" (Figure 5)
≥ 25 kg/m3 fibres 0.09 µm 5-20 µm 14-28 m2/g
RESS (Figure 6-7) 12 kg/m3 rods 0.10-0.20 µm 1-3 µm 44-67 m2/g
Table 3. Results summary for SAS and RESS process
This series of experiments shows that SAS and RESS processes can be successfully used on the same molecule: SAS with DMSO at medium temperatures and RESS at higher temperatures. The characteristics of the powders obtained are summarised in table 3. In both cases, we have observed a great effect on apparent density and specific surface area and a decrease in the size distribution. However, influence of experimental conditions on powder characteristics is not clear. Particle morphology is different and more work is needed to distinguish between the properties of the different samples obtained: do they have the same crystal morphology? Do they have the same in vivo rate? Further work is in progress in our laboratory to allow a complete characterization of the different powders obtained.
It should be added that the production rate is much lower with RESS, which may be a major drawback for a scaling-up of the process. Nevertheless, the final choice for a specific process to be industrialized must take into account all the scientific and economic aspects.
References
(1) Sauceau M, Letourneau J J, Richon D and Fages J (2000) Ind.Eng.Chem.Res, 39, pp 4609-4614.
(2) Sauceau M, Letourneau J J, Richon D and Fages (2000) Proc 7th Meeting on Supercritical Fluids, Antibes , pp 959-964.
(3) Chrastil J (1982) , J. Phys. Chem., 86, pp 3016-3021.
(4) Kordikowski A, Schenk A P, Van Nielen R M and Peters C J (1995) J. Supercritical
Fluids, 8, pp 205-216.
(5) Reverchon E, Della Porta G, De Rosa I, Subra P and Letourneur D (2000) J. Supercritical
Fluids, 18, pp 239-245.