Université de Montréal
The Association Between Food Security and Diet Quality
Among First Nations Living On-Reserve in Canada
par Lara Steinhouse
Département de Nutrition, Université de Montréal Faculté de Médecine
Mémoire présenté à la Faculté de Médecine
en vue de l’obtention du grade de Maîtrise ès Science (M.Sc.) en nutrition
Août, 2017
i
Résumé
Problématique: La prévalence de l’insécurité alimentaire chez les Premières Nations est plus élevée que chez les Canadiens en général, un fardeau qui s’ajoute aux prévalences inquiétantes de maladies chroniques liées à l’alimentation. Cependant, peu d’information existe sur la relation entre l’IA et la qualité de la diète pour les PN vivant sur réserve.
Objectif: Étudier la corrélation entre l’insécurité alimentaire et la qualité de l’alimentation chez les PN adultes vivant sur-réserve dans 5 régions au Canada (sud du 60ème parallèle).
Méthodes: Des données de rappels alimentaires de 24 heures, issues d’une étude transversale intitulée « Étude sur l’alimentation, la nutrition et l’environnement des Premières Nations », ont été analysées à l’aide de 2 indices de qualité de la diète : une adaptation canadienne du « Healthy Eating Index » (HEI) et NOVA, une classification qui se base sur la nature et le degré de la transformation alimentaire. Des analyses de régression ont exploré les facteurs sociodémographiques reliés à l’IA et à la qualité de la diète. Les scores du HEI, ainsi que la contribution énergétique des groupes NOVA ont été comparés par niveau d’IA.
Résultats: La prévalence d’IA était élevée (35,7%), surtout chez les ménages avec des enfants (40,4%), les ménages sans emploi (45,4%), et ceux qui reçoivent l’assistance sociale (55,5%). Le sexe, le groupe d’âge et l’éducation étaient aussi corrélés à l’IA. Le score moyen du HEI était faible (49,0 ± 12,65) et était associé avec le sexe, l’âge, la région, le recours à l’assistance sociale, la consommation d’aliments traditionnels (AT), la participation aux activités d’AT, l’éducation, et l’IA. Les scores totaux du HEI étaient significativement plus élevés pour ceux en sécurité alimentaire (49,7) que ceux en IA (48,1), mais ils ne l’étaient plus après ajustement pour des facteurs sociodémographiques. Cependant, l’IA est demeurée significativement associée à des apports plus élevés en ingrédients culinaires transformés (sucres, huiles végétales), à des apports plus faibles en fruits et légumes et en plats cuisinés à la maison. Conclusion: Une relation significative, quoique faible, entre l’IA et la qualité de la diète a été observée. Les résultats ont révélé un besoin d’explorer les questions de revenu, d’assistance sociale et d’accès aux AT pour améliorer l’environnement alimentaire des PN.
Mots-clés : HEI, Sécurité alimentaire, Insécurité alimentaire, Qualité de l’alimentation, NOVA, Transformation alimentaire, Autochtones, Premières Nations, Canada.
ii
Abstract
Background: First Nations (FN) experience high levels of food insecurity that greatly exceed those of the non-aboriginal population. Associated with this burden are alarming rates of obesity and nutrition-related chronic disease. Little is known about food insecurity’s relationship to diet quality outcomes for FN living on-reserve.
Objective: This study explores the associations between household food insecurity (FI) and poor diet quality for FN adults living on-reserve in 5 Canadian regions (south of the 60th parallel).
Methods: Dietary recall data from the First Nation Food Nutrition and Environment Study (FNFNES), a cross-sectional study, were analyzed using two diet quality indices: a Canadian Healthy Eating Index (HEI) and NOVA, which assesses diet by level of food processing. Regression analyses explored socio-demographic correlates of FI and diet quality. HEI total and component scores and the caloric contribution of NOVA groups and subgroups were compared between food security levels.
Results: FI prevalence was high (35.7%), notably in households with children (40.4%), those where all members are unemployed (45.4%), and those receiving social assistance (55.5%). Sex, age group, and education level were also correlated with FI. The mean total HEI score was low (49.0 ± 12.65). Total HEI mean scores were associated with sex, age group, region, social assistance, traditional food consumption, any household TF activity, and education. They were also significantly higher for people from food secure households compared to FI (49.7 vs. 48.1, respectively), though not after adjusting for socio-demographic variables. After adjustments, FI remained significantly associated with higher intakes of processed culinary ingredients (sugars and plant oils), lower intakes of homemade dishes, and less fruit and vegetable consumption. Conclusions: This study found a small, but significant, relationship between food insecurity and diet quality. Findings also emphasized the need to address income, social assistance benefits and access to traditional foods to improve food security and nutritional outcomes for First Nations.
Keywords : HEI, Food security, Food insecurity, Diet Quality, NOVA, Food processing, Aboriginal, First Nations, Canada.
iii
Table of Contents
Résumé ... i
Abstract ... ii
Table of Contents ... iii
List of Tables ... vi
List of Figures ... vii
Abbreviations ... viii
Acknowledgements ... x
Introduction ... 1
Chapter II – Literature Review ... 4
1 Aboriginal Peoples in Canada ... 4
1.1 Defining Indigeneity in Canada and abroad ... 4
1.2 Health disparities experienced by Aboriginal Peoples ... 6
2 Social Determinants of Health ... 9
2.1 Determinants of health for Indigenous peoples in Canada ... 9
3 Dietary Patterns of Aboriginal Peoples ... 19
3.1 Aboriginal peoples and the nutrition transition ... 19
3.2 Assessments of dietary patterns in Aboriginal populations in Canada ... 20
3.3 Traditional food consumption ... 21
4 Diet quality ... 22
4.1 Global diet quality indicators ... 23
4.2 The Healthy Eating Index ... 24
4.3 Food processing ... 30
5 Food Security ... 35
5.1 Food Security: an evolving definition ... 35
5.2 Food security measurement ... 39
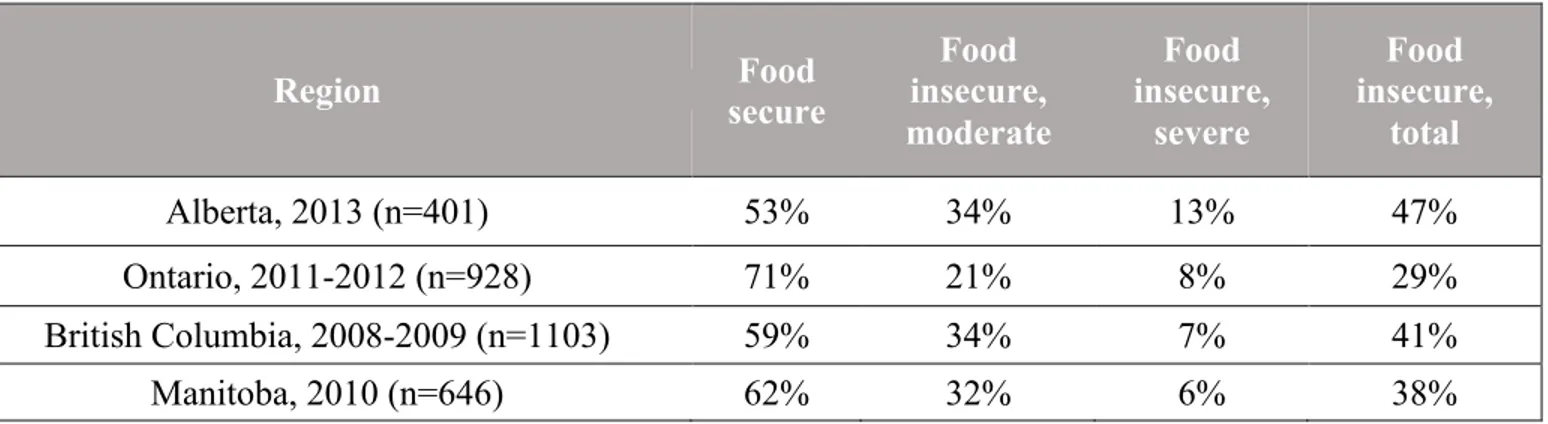
5.3 Food security statistics ... 46
5.4 Food insecurity and health ... 48
5.5 Food insecurity and diet quality: A Review of the evidence ... 52
iv
1 Rationale ... 58
2 Primary objectives and questions ... 60
Chapter IV - Methodology ... 62
1 The Study: First Nation Food, Nutrition and Environment Study (FNFNES) ... 62
2 Sampling ... 63
3 Ethics and Confidentiality ... 65
4 Data Collection ... 66
5 Dietary Assessment and data entry ... 67
6 Variables ... 69
6.1 Household food security status ... 69
6.2 Socio-demographic correlates ... 69
6.3 Measures of Diet Quality ... 71
6.4 Missing Data ... 73
6.5 Statistical analysis ... 73
7 Contribution of this study to FNFNES ... 76
Chapter V - Results ... 78
1 Descriptive Analysis ... 78
1.1 Missing data ... 81
Predictors of Food Security ... 82
2 Diet Quality ... 84
3 Food Security Status and Diet Quality ... 88
3.1 NOVA and food insecurity ... 91
Chapter VI: Discussion ... 95
1. Food Insecurity Remains a Burden ... 96
1.1 Demographics ... 97
1.2 Regional differences ... 98
1.3 Household characteristics ... 99
1.4 Income ... 100
1.5 Employment is not protective ... 102
1.6 Household traditional food activity ... 103
v
2.1 Determinants of diet quality ... 106
2.2 Education and employment ... 106
2.3 Traditional food ... 107
3 The Relationship Between Food Insecurity and Diet Quality ... 109
3.1 Diet quality: a possible pathway between food insecurity and obesity ... 109
4 Recommendations: Improving diet quality by increasing income and promoting food sovereignty ... 111
Moving towards inclusive and more systemic approaches: a case for food sovereignty 113 5 Strengths and Limitations ... 116
Chapter VIII - Conclusion ... 120
Bibliography ... i
APPENDIX I – Components and scoring of a Canadian Healthy Eating Index ... i
APPENDIX II – Social, Health and Lifestyle Questionnaire ... ii
APPENDIX III – Summary of the literature on the association between food insecurity and diet quality ... iii
APPENDIX III (Continued) ... x
APPENDIX IV – Serving sizes of mixed dishes, by weight ... xiii
APPENDIX V – SAS program for calculating the HEI score ... xiv
vi
List of Tables
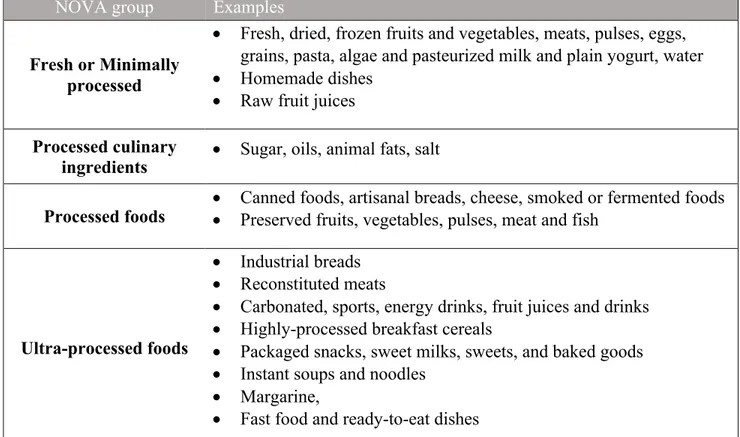
Table I- Classification of foods into NOVA groups ... 31
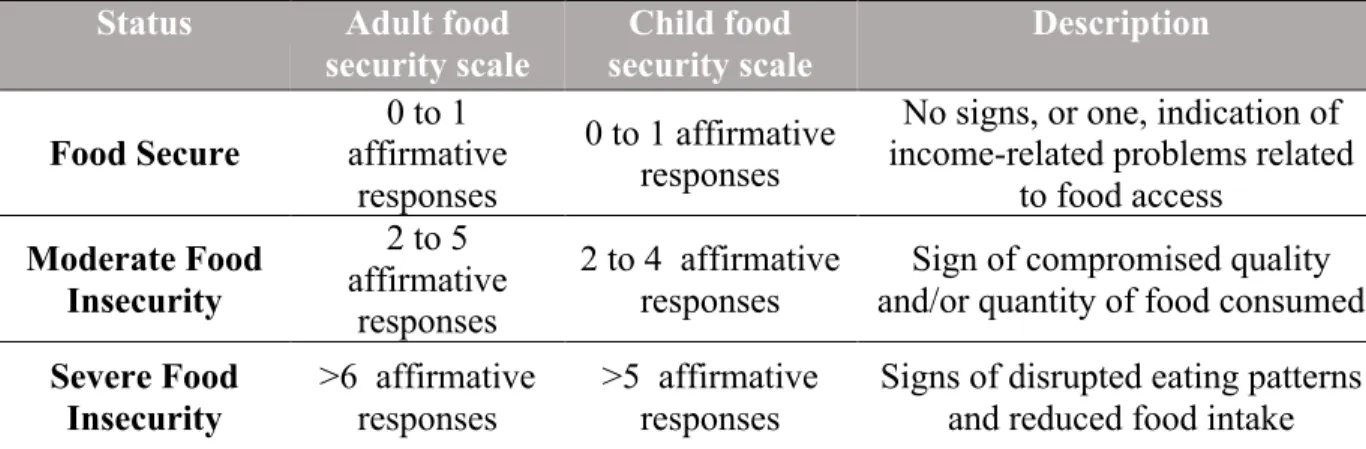
Table II - Classification of food Security status, based on Household Food Security Module 43 Table III - Published food security rates from the FNFNES study (2008-2013) ... 48
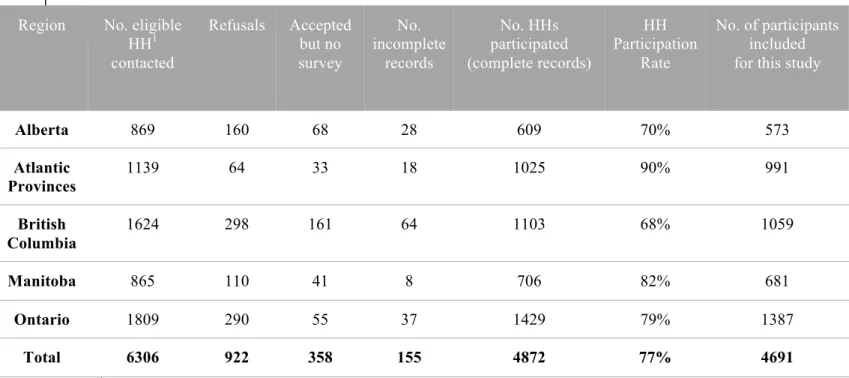
Table IV - Number of households surveyed, participation rates, and number of participants included in this study for each region ... 64
Table V - Individual and household level variables explored as correlates of food insecurity and diet quality among First Nations adults ... 70
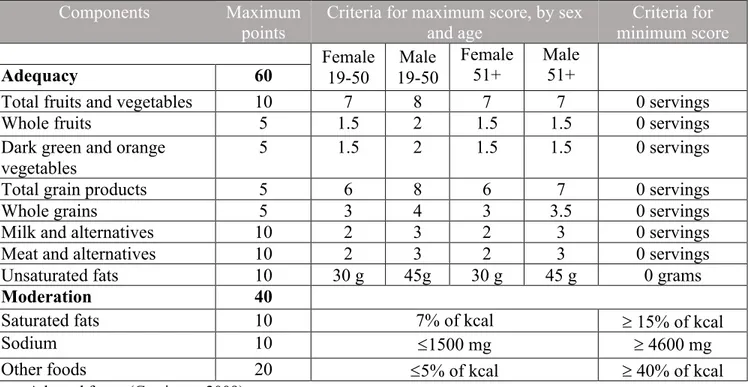
Table VI - Components and scoring of the Canadian Healthy Eating Index ... 72
Table VII - Socio-economic characteristics by gender for First Nations adults living on-reserve in 5 Canadian regions ... 78
Table VIII - Prevalence and bivariate analysis of correlates of food insecurity ... 82
Table IX - Multivariate logistic regression results of food insecurity correlations ... 84
Table X - Healthy Eating Index mean (SE) scores by socio-demographic variables ... 86
Table XI - Independent associations of mean HEI score with socio-demographic covariates . 87 Table XII - Percentage distribution of HEI index score categories between food security levels ... 88
Table XIII - Mean scores of Canadian Healthy Eating Index (HEI) and its components and other dietary characteristics for First Nations adults by food security status ... 90
Table XIV - Mean caloric contribution of NOVA groups and subgroups in First Nations adults by food security status ... 92
vii
List of Figures
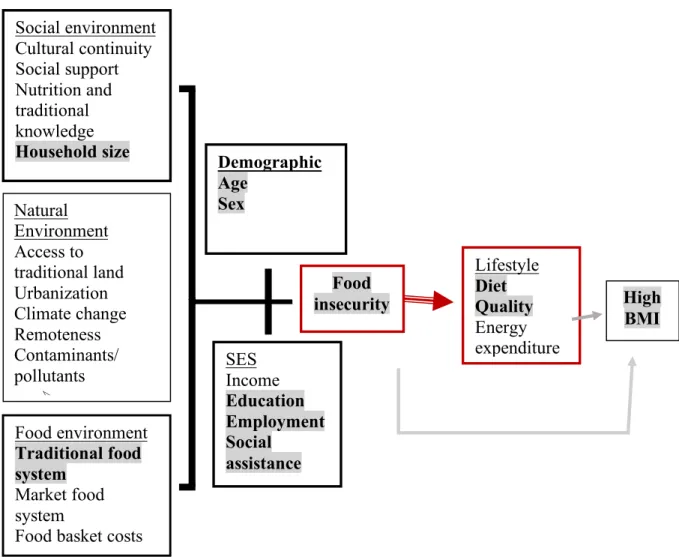
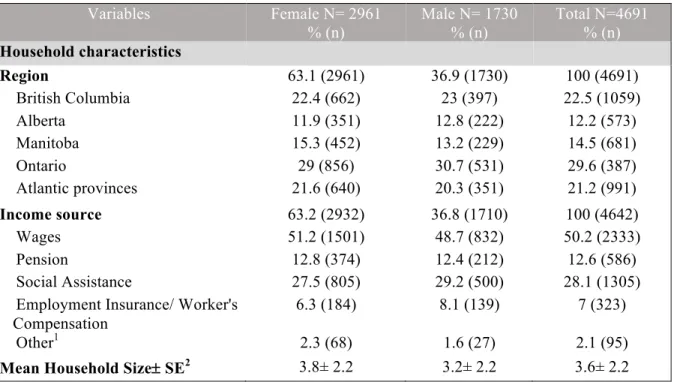
Figure 1. Levels of Social Determinants of Health for Aboriginal Peoples ... 10 Figure 2. Conceptual framework of food security ... 38 Figure 3. Conceptual framework of the relationship between socio-demographic variables, food insecurity, diet quality, and high BMI in First Nations communities. ... 59 Figure 4. Household food security prevalence rates, including marginal food insecurity, for First Nations Living On-Reserve in 5 Canadian Regions (n=4,516) ... 80 Figure 5. Percentage of food insecure households by main household source of income for First Nations adults living in BC, AB, MN, ON and AT (2008-2014) (n=4642) ... 81 Figure 6. Percentage distribution of HEI score categories for the general Canadian population aged 2 or older (2004 Canadian Community Health Survey – Nutrition) and First Nation adults living on-reserve in 5 Canadian regions (2008-2014) ... 85 Figure 7. Mean HEI score by food security status for women and men ... 89 Figure 8. Mean caloric contribution of NOVA food groups according to household food security status for First Nations in Canada ... 91
viii
Abbreviations
AB: Alberta
AFN: Assembly of First Nations ANOVA: Analysis of Variance AT: Atlantic provinces
BC: British Columbia BMI: Body mass index
CCHIP: Community Childhood Hunger Identification Project (CCHIP) CCHS: Canadian Community Health Survey
CERES: Comité d’éthique de la recherche en santé CNF: Canadian Nutrient File
CRA: Community Research Assistant EI: Employment Insurance
EWCFG: Eating Well with Canada’s Food Guide
FAO: Food and Agriculture Organization of the United Nations FFQ: Food Frequency Questionnaire
FI: Food insecure
FNFNES: First Nations Food, Nutrition and Environment Study FNIGC: First Nations Information Governance Centre
FNRHS: First Nations Regional Health Survey FS: Food secure/Food security
FSC: Food Secure Canada
FSCM: Food Security Core Module HEI: Healthy Eating Index
HFSSM: Household Food Security Survey Module HH: Household
INAC: Indian and Northern Affairs Canada MF: Market food
MN: Manitoba
ix NNFB: National Nutritious Food Basket NWT: North-West Territories
OCAP: Ownership, Control, Access and Possession ON: Ontario
PAHO: Pan American Health Organization RNFB: Revised Northern Food Basket SD: Standard Deviation
SE: Standard Error
SES: Socio-economic status
SHLQ: Social, Health and Lifestyle Questionnaire SOFI: State of Food Insecurity in the World TF: Traditional food
UPF: Ultra-processed foods WHO: World Health Organization 24-hr: 24-hour Recall
x
Acknowledgements
I would like to extend my deepest gratitude to my thesis supervisor, Dr. Malek Batal, for his continued support, precious feedback and for providing me with the opportunity to work with the First Nations Food, Nutrition and Environment Study (FNFNES), both for my master’s research, as well as for data collection. It has been a tremendous pleasure to be involved with this project and a very valuable learning experience.
I am extremely grateful for Amy Ing, the FNFNES data coordinator, for getting me well acquainted with the data, setting me up with programming using the Statistical Analysis Software (SAS), reviewing my food coding, and being readily available to answer my questions at any time. I would also like to thank Peter Berti for his valuable feedback and insight for statistical analysis, as well as Dr. Jean-Claude Moubarac who helped guide me through the NOVA classification.
Thank you to the entire FNFNES team, who I also had the please working with as a Nutrition Research Coordinator (NRC) in the last year of data collection and to all FNFNES participants and communities.
Finally, I would like to thank my colleagues from the Transnut research team at the Université de Montréal, who have made this experience all the more enriching and enjoyable. And of course, a big thank you to my family, who have supported me tremendously throughout this entire process.
Introduction
A rapid change in dietary patterns has occurred for Aboriginal peoples1 in Canada, mostly over the past 60 years, where traditional foods have been replaced by less nutritious market-based foods, while levels of physical activity have greatly declined (Egeland, Johnson-Down, Cao, Sheikh, & Weiler, 2011; Kuhnlein, Receveur, Soueida, & Egeland, 2004). This transition has had a significant impact on the health of Canadian Indigenous peoples, for whom rates of obesity and chronic disease, such as diabetes and cardiovascular disease, have reached epidemic levels (Elliott & Jayatilaka, 2011; Kirkpatrick & Tarasuk, 2008; Willows, Veugelers, Raine, & Kuhle, 2011b). For instance, the prevalence of diabetes was reported at 24% for First Nations adults living on-reserve in Ontario (2010/2011), while the non-Aboriginal prevalence in Canada was recorded at 5% during this same period (2009/2010) (Chan et al., 2014).
Social determinants of health are also at the root of this disproportionate burden of health disparities experienced by Aboriginal peoples. These determinants operate at different dimensions, with systemic causes extending as far back as colonization, when land dispossession and settlement onto reserves compromised indigenous self-determination and access to traditional food systems. Today, many interrelated proximal determinants of health affect First Nations, including low income, poor education, a lack of adequate employment, and food insecurity (Chan et al., 2016a). Most notably, food insecurity, a situation in which people lack adequate access to food due to financial constraints or other access issues, has been associated with the nutrition transition and poor health outcomes. First Nations are burdened by high levels of food insecurity, with prevalence rates greatly exceeding those of the non-aboriginal population (Tarasuk, Mitchell, & Dachner, 2016). For example, the 2004 Canadian community Health Survey cycle 2.2, which focused on nutrition, found that 9.2% of the
1 The term “Aboriginal” encompasses all of those who identify as being a part of one of the three Aboriginal groups in Canada (First Nations, Métis, and Inuit), those who have status as a Registered or treaty Indian, and/or those with membership in an Indian band or First Nation (Statistics Canada, 2009).
Canadian population was living in a food insecure household, with this rate being much higher for Aboriginal households (33%) than for non-Aboriginal households (8.8%) (Health Canada, 2007). These findings excluded Aboriginal peoples living on-reserve, whom have been found to experience food insecurity to an even greater extent. The 2008-2010 First Nations Regional Health Survey (FNRHS) reported a food insecurity prevalence rate for First Nations living on-reserve of 52.4% (FNIGC, 2012). More recently, the First Nation Food, Nutrition and Environment Study (FNFNES) was designed to further evaluate the food security and nutrition situation for First Nations living on-reserve below the 60th parallel in 10 Canadian regions. This is the first time such a large data set will be available on these topics, as FN living on-reserve have historically been excluded from national nutrition studies. Results from FNFNES are reported on in the present study.
The main objective of this research was to explore whether associations exist between food insecurity and diet quality. To do so, first a thorough review of the literature was conducted with the intention of better understanding the underlying factors that are responsible for food insecurity and poor diet quality for First Nations. The main themes explored are: 1) Aboriginal peoples: defining indigeneity in Canada and understanding health disparities with the rest of the Canadian population; 2) Social determinants of health and how they operate at the proximal, intermediate, and distal levels for First Nations; 3) Contemporary dietary patterns of Aboriginal peoples in Canada; 4) Diet quality measurements, with emphasis on a Canadian-specific version of the Healthy Eating Index (HEI) and the NOVA classification system; and 5) Food security, including its evolving definition, study metrics, and evidence exploring the relationship between food insecurity and outcomes on diet and health.
Analysis seeks to gain a better understanding of the socio-demographic correlates of food insecurity and poor diet quality for First Nations living on-reserve below the 60th parallel in Canada. It also provides additional evidence to better describe the diets of First Nations, including the proportion of intake from traditional foods. Finally, the interrelationship between food insecurity and diet quality is assessed by developing a novel approach that uses two separate diet quality indicators – a Canadian adaptation of the Healthy Eating Index (HEI) and the NOVA classification system, which categorizes foods based on the extent to which they
have been processed. This work provides a new lens for understanding the relationship between social determinants, notably food insecurity, and diet quality. This comes at a time where many people across the globe are experiencing a double burden of malnutrition, characterized by the coexistence of micronutrient deficiencies with obesity and chronic disease. This contributes to existing evidence for improved, targeted strategies to address the public health burden of obesity and chronic disease.
Chapter II – Literature Review
1 Aboriginal Peoples in Canada
1.1 Defining Indigeneity in Canada and abroad
Indigenous peoples have been described as distinct cultural groups that have been able to subsist in a particular ecological region for an extended, though not specifically defined, period of time (Kuhnlein & Receveur, 1996a). Although there is no internationally accepted definition, the United Nations uses the term “indigenous” to refer to peoples who:
“Identify themselves and are recognized and accepted by their community as indigenous; Demonstrate historical continuity with pre-colonial and/or pre-settler societies; Have strong links to territories and surrounding natural resources; Have distinct social, economic or political systems; Maintain distinct languages, cultures and beliefs; Form non-dominant groups of society; Resolve to maintain and reproduce their ancestral environments and systems as distinctive peoples and communities.”(Erber, Beck, et al., 2010; WHO, 2007).
Approximately 370 million people fit this description worldwide (Egeland & Harrison, 2013). Indigenous people live in over 90 different countries, representing a vast array of cultures, traditions and histories. Regrettably, one commonality indigenous people share is that they continue to be of the most marginalized population groups around the world, regardless of the economic state of their country. Indian and Northern Affairs Canada (INAC) created the Community Well-Being Index, which assesses community income, education, housing, and employment on a scale of 100 (Reading & Wien, 2009). Of the 100 lowest-scoring communities in Canada in 2011, 98 were First Nations (Reading & Wien, 2009). First Nations communities received an average score of 20 points lower than non-Aboriginal communities (Aboriginal Affairs and Northern Development Canada, 2014). The index did, however, find great variation between First Nations communities, many of which are above the Canadian average. Thus, it is worthwhile to continue to study
the causes of variation in the wellbeing of indigenous communities, and to better identify the main underlying factors that contribute to this variation.
In Canada, the term Aboriginal is used to represent all of the descendants of the first peoples in North America (Willows, Veugelers, Raine, & Kuhle, 2011a). In article 35 of the Canadian Constitution Action of 1982, Aboriginal Peoples are identified as belonging to one of three groups: Indians (now referred to as First Nations), Métis and Inuit or Inuk (National Collaborating Center for Aboriginal Health, 2012). Statistics Canada refers to “Aboriginal identity” as any person who meets one or multiple of three criteria: self-identification as an Aboriginal person of one of the three aforementioned groups; status as a Registered or Treaty Indian (registered under the Indian Act of Canada); and, membership in a First Nation or Indian band (Statistics Canada, 2009). The three groups are culturally distinct and concentrated in different geographic spaces. Inuit live mostly in Nunavut and around the coast in the Norwest Territories, Northern Quebec and Labrador. Métis have both European and First Nation ancestry, and have their own distinct nationhood (Canada, 2013; Willows, 2005). Finally, the predominant Aboriginal peoples of Canada living south of the Arctic are First Nations (Haman et al., 2010). Although examples will be taken from different Aboriginal peoples for the purpose of this research, the focus will be on First Nations peoples (FN) living below the 60th parallel.
In Canada, 1,400,685 people self-identified as Aboriginal in 2011, which represented 4.3% of the Canadian population (Statistics Canada, 2013a). Approximately 70% of Aboriginal peoples in Canada live off-reserve, mostly in urban areas, with First Nations representing the largest portion of the Aboriginal population, at 60.8%, while 32.3% identify as Métis and 4.2% as Inuit (Statistics Canada, 2013a; Willows et al., 2011b). There are over 600 recognized First Nations bands in Canada, speaking more than 60 languages (Canada, 2013)
The Canadian Aboriginal population is relatively young and is quickly growing, with a median age of 28, compared with 41 for non-Aboriginal people. Over a quarter of the Aboriginal population is under 14 years old, while 18.2% are between 14 and 24 years old
(Statistics Canada, 2013a). The Inuit population is the youngest among all Aboriginal peoples, with a median age of 23 (Statistics Canada, 2013b). Between 2006 and 2011, Statistics Canada also recorded a population increase of 20.1% amongst Aboriginal peoples in Canada, compared to the general Canadian average of 5.2% (Statistics Canada, 2013a). Higher fertility rates and shorter life expectancy than the non-Aboriginal population are cited as the main reasons for these observations (Statistics Canada, 2011). However, the growth of Aboriginal peoples is also said to have increased between 1996 and 2006 because more people self-identified as Aboriginal, notably among Métis (Gionet & Roshanafshar, 2013).
1.2 Health disparities experienced by Aboriginal Peoples
1.2.1 Overview
Indigenous peoples worldwide disproportionately experience health and economic disadvantages in countries of all income levels. No exception to this, Canadian Aboriginal peoples experience greater rates of morbidity and mortality than the rest of the Canadian population. Discrepancies in health status are observed most prominently in the rates of chronic diseases, as well as in mental, environmental, infant and maternal health outcomes (National Collaborating Center for Aboriginal Health, 2012). Even when controlling for obesity, health behaviours (e.g. smoking and alcohol consumption) and socioeconomic factors, health inequalities remain significant for Aboriginal people compared to the rest of the population (Willows et al., 2011b). Life expectancy for Aboriginal people in Canada is 12 years lower than that of non-Aboriginal Canadians (Kolahdooz, Nader, Yi, & Sharma, 2015), and the infant mortality rate is 50% greater than the Canadian average at 8.5 deaths per 1000 live births in 1999 (Adelson, 2005). Using a measurement of self-rated health, the Canadian Community Health Survey (2010b) found that Aboriginal people were less likely to rate their health as “very good” or “excellent”, when compared to non-aboriginal Canadians (Council of Canadian Academies, 2014).
1.2.2 Overweight and obesity
In Canada, as in other high-income countries such as the United States and Australia, the prevalence of overweight and obesity among the Aboriginal population greatly exceeds
that of the general population (Erber, Hopping, et al., 2010; Garriguet, 2008). Using self-reported height and weight measurement data from the Canadian Community Health Survey (CCHS), collected between 2007 and 2010, Statistics Canada calculated the obesity prevalence for adults 18 years old and over to be 16% among the Canadian non-Aboriginal population, 26% among both First Nations and Inuit, and 22% among Métis (Gionet & Roshanafshar, 2013). However, rates of overweight were similar for all groups (Gionet & Roshanafshar, 2013).
A study conducted by Ho et al. (2008) in 9 Anishinaabe First Nations’ communities in Northwestern Ontario found the prevalence of obesity to be 47.7% and overweight to be 32.6%, which was much higher than the Canadian rates of obesity (23.1%) and overweight (36.1%) at the time. This is consistent with results from the 2002/03 First Nations Regional Longitudinal Health Survey, which collected self-reported height and weight data from approximately 9,000 First Nations living on-reserve and found that the prevalence of overweight and obesity was higher for Aboriginal peoples than the non-Aboriginal Canadian population, and highest among First Nations living on-reserve (Katzmarzyk, 2008). Moreover, central obesity, which refers to a high waist-to-hip ratio and is associated with higher risk for diabetes, tends to be most prevalent among Aboriginal people (Young, Reading, Elias, & O'Neil, 2000).
1.2.3 Non-communicable diseases
Canadian Aboriginal peoples are more likely to self-report poorer health and diagnosed chronic disease when compared to the general Canadian population (Council of Canadian Academies, 2014; Gionet & Roshanafshar, 2013). Cardiovascular disease (CVD), which includes hypertension, arteriosclerosis, and heart failure, is more prevalent among Aboriginal peoples, with a 20% higher rate of acute myocardial infarction, and twice the rate of strokes than among the general Canadian population (National Collaborating Center for Aboriginal Health, 2012).
Of particular public health concern is the prevalence of Type 2 diabetes, which has been described as reaching ‘epidemic’ proportions among First Nations (Chan et al., 2016a; Ho et al., 2008; Seabert et al., 2013). Rates vary significantly across different First Nations
communities. Notably, adults living in Sandy Lake First Nation in northwestern Ontario experience the third highest rate of diabetes in the world (at 26% after adjusting for age) (Harris et al., 1997; Ho et al., 2008; Young et al., 2000). On average, the self-reported rate of diagnosed diabetes is approximately three to five times greater for First Nations people living on-reserve than among the general Canadian population (Chan et al., 2014; Pal et al., 2013; Young et al., 2000). Recent data from for the First Nations Food, Nutrition and Environment Study (FNFNES) revealed a prevalence of self-reported diabetes among First Nations adults of 24% in Ontario and 21% in Manitoba (Chan et al., 2014; Chan, Receveur, Sharp, Schwartz, et al., 2012). In contrast, results from the 2009-2010 Canadian Community Health Survey found the national rate of diabetes to be 5%, while the rate of FN living off-reserve was 10.3% (Chan et al., 2014). The 2008-2010 First Nations Regional Longitudinal Health Survey also found a higher prevalence of diabetes amongst First Nations living on-reserve (17.2%) than FN living off-reserve. All of these prevalence rates were age-standardized to the 1991 Canadian population (Public Health Agency of Canada, 2011). Additionally, Aboriginal peoples are more likely to experience diabetes-related complications, including renal disease and cardiovascular disease (Ho et al., 2008; National Collaborating Center for Aboriginal Health, 2012).
In the case of diabetes, one proposed theory for the disproportionally high burden among Canadian Aboriginal peoples is the “thrifty gene hypothesis”, which is based on the idea that genes have adapted to extended periods of food scarcity by promoting rapid insulin production as soon as glucose levels increase, leading to high levels of storage of glucose in fat cells as triglycerides (Egeland & Harrison, 2013; Young et al., 2000). Once food becomes readily available, the result may be hyperinsulinemia, hyperglycemia, obesity and finally, diabetes (Young et al., 2000). However, many researchers largely contest the theory that genetics are to blame for the elevated rates of diabetes. For one, Egeland & Harrison (2013) consider that the thrifty gene hypothesis is myopic in its explanation and that there are perhaps certain epigenetic effects that, though they may not alter DNA sequences, can be passed across generations (Egeland & Harrison, 2013; Halseth, 2015). One exception involves an Oji-Cree community of northern Ontario, where a specific gene (factor-1alpha (HNF1A) G319S) has been associated with a specific form of Type 2 Diabetes, which
differs from the standard Type 2 Diabetes in that it has an earlier age of onset and people tend to have a lower BMI and a higher post-prandial glycemic level. However, this genetic variation has not been found among other populations (Egeland & Harrison, 2013). More commonly, the literature points to high rates of obesity as the main culprit for the elevated diabetes rate in the Canadian Aboriginal population (Erber, Hopping, et al., 2010). Underlying causes will be further explored in the following sections of this review.
2 Social Determinants of Health
An individual’s health status is not determined merely by genetics, but is also the result of a combination of social factors, including environment, income, education, and social support networks (WHO, 2017). The Public Health Agency of Canada has identified twelve key determinants of health: income and social status, social support networks, education and literacy, employment/working conditions, social environments, personal health practices and coping skills, healthy child development, biology and genetic endowment, health services, gender, and culture (Public Health Agency of Canada, 2013). Of these factors, the most influential appears to be social and economic status. Life expectancy is lower and risk of illness is higher among low-income Canadians, irrespective of other factors such as age, sex, and race (Public Health Agency of Canada).
2.1 Determinants of health for Indigenous peoples in Canada
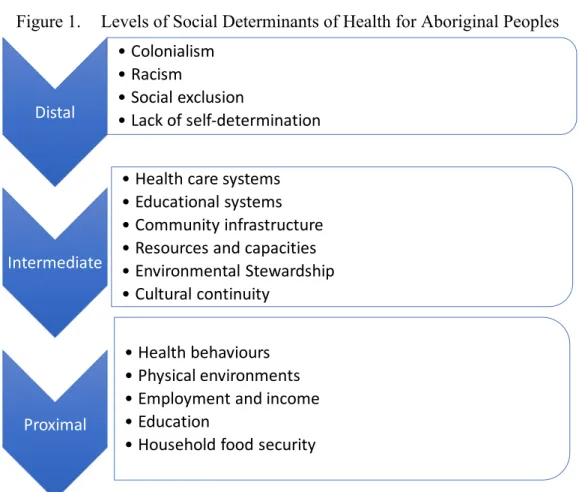
Besides the determinants of health assessed for the Canadian population, emerging evidence suggests that there are more specific social ones to consider for First Nations Peoples (Nesdole, Voigts, Lepnurm, & Roberts, 2014). In “Health Inequalities and Social Determinants of Aboriginal People’s Health”, Reading and Wein (2009) categorize the various determinants of health for Canadian Aboriginal peoples at the proximal, intermediate, and distal levels. Proximal determinants are those that have a direct impact on an individual’s state, be it physical, emotional, mental or spiritual. These include health behaviours, physical environments, employment and income, education, and food security. Intermediate determinants of health are those responsible for the proximal determinants, such as: health care systems, educational systems, community infrastructure, resources and capacities, environmental stewardship, and cultural continuity. Finally, distal determinants
are at the root of population health inequities. For First Nations, a history of colonialism, racism and social exclusion, and lack of self-determination represent the most fundamental distal determinants that continue to impact health today (Reading & Wien, 2009). The section below describes in greater detail some of the various social determinants of health that operate at either the distal, intermediate, and/or proximal levels.
Figure 1. Levels of Social Determinants of Health for Aboriginal Peoples
Adapted from (Reading & Wien, 2009)
2.1.1 Colonialism
The existing health discrepancies previously discussed stem from a wide array of underlying factors, such as a history of colonization, racism, loss of cultural practices, lack of financial resources and self-determination, which need to be studied, alongside a legacy of discriminatory laws, and marginalization, to better understand the contemporary issues experienced by Indigenous Peoples (Egeland & Harrison, 2013; Nesdole et al., 2014). Kolahdooze et al. (2015) explain that the foundation in health inequalities for Aboriginal peoples dates back to the Indian Act of 1867. The main objective of this Act was to
Distal • Colonialism • Racism • Social exclusion • Lack of self-determination Intermediate • Health care systems • Educational systems • Community infrastructure • Resources and capacities • Environmental Stewardship • Cultural continuity Proximal • Health behaviours • Physical environments • Employment and income • Education • Household food security
assimilate Indigenous peoples and impose upon them a reserve system, where the federal government would be responsible for providing health care, among other services. Aboriginal nations exchanged self-determination in return for a label of “Status Indian”. In doing so, they were confined to small parcels of land, which represented a fraction of their traditional territories, where many had been engaged in a nomadic lifestyle with a command of and sovereignty over often abundant resources (Reading & Wien, 2009). The Indian Act is a paternalistic legislation that offered to provide “civilization, protection and assimilation”, under the assumption that Indigenous peoples were not able to assume responsibility for overseeing their own affairs (Coates, 2008). First Nations leaders have protested that it has created dependency in restricting Aboriginal peoples from borrowing or owning collateral, which has made it extremely difficult to get a mortgage, start a business or invest in economic development on-reserve (Oster, Grier, Lightning, Mayan, & Toth, 2014). Moreover, it has restricted First Nations rights and privileges, where the government has maintained control over education, land and economic resource management in a way that has often been aggressive and in many cases abusive. The federal government continues to hold the right to manage and supervise traditional lands and funds, and band affairs (Coates, 2008). Despite these criticisms, Aboriginal peoples and the federal government have not yet agreed an alternative governance structure to protect the special rights of Aboriginal Peoples in Canada, and so the Indian Act remains in place, while being surrounded by great contention (Coates, 2008).
2.1.2 The physical environment Contamination and climate change
Land and health are intrinsically tied together in Aboriginal culture. The historical process of dispossession and settlement onto reserves has compromised traditional culture, reduced access to food resources and hindered community resilience (Richmond & Ross, 2009). Environmental degradation and climate change are also concerns that impact food security and health. Contamination of traditional foods (TF) from pollution and industry, destruction of traditional territories, from deforestation, overfishing and climate change compromise the health of those who continue to rely on TF as a fundamental part of their diets (Elliott & Jayatilaka, 2011; Richmond & Ross, 2009). Additional environmental concerns relate to changes in access and availability of TF sources, notably in northern
communities. Changes in weather patterns and declining wildlife species alter and often diminish hunting and fishing seasons, which in turn affects the safety and availability of foods (National Collaborating Center for Aboriginal Health, 2012). Such changes not only affect species, but also people’s ability to travel on the ice to harvest TF (Guyot, Dickson, Paci, Furgal, & Chan, 2006). Focus groups conducted in two northern First Nation communities revealed that community members had been observing changes in migration patterns and population decline in certain animal species, with a rise in others (Guyot et al., 2006). Emerging evidence also reveals an increase in infectious and water-borne diseases related to changing environments in the North (National Collaborating Center for Aboriginal Health, 2012). These issues are of particular concern as TF not only provide essential nutrients, but are also vital for cultural, social, and spiritual health (Richmond & Ross, 2009).
Moreover, studies have shown certain foods to be exposed to contaminants, including pesticides, polychlorinated biphenyls (PCBs) and heavy metals, such as cadmium, lead and mercury (Kuhnlein & Chan, 2000). Contaminants in the soil, plants, or water can bioaccumulate in animal species, reaching toxic levels in humans. This is especially a concern with fish, sea birds, and marine species (Kuhnlein & Chan, 2000). It thus becomes a challenge for Aboriginal peoples to weigh the benefits and risks of consuming traditional foods, which are rich in essential nutrients, but may be toxic or carcinogenic (Kuhnlein & Chan, 2000). In some cases, for instance, fear may prevent people from consuming TF that may be safe to eat. With this in mind, one important objective of the First Nation, Food Nutrition and Health Study (FNFNES) has been to analyze and report on contamination of TF across a representative sample of First Nations communities in Canada. Of the 48 communities studied in British Columbia, Manitoba and Ontario, most TF had detectible levels of chemical contaminants, but not high to pose a risk on health. Levels of mercury found in hair samples were also not of concern in communities surveyed. Reports from the remaining provinces are expected by 2018 and will provide a better picture of the situation, providing information to community-members on whether there is a real concern to allow evidence-based decision making at the community level (Sharp, Black, & Mitchell, 2016).
Moreover, it has been hypothesized that there is an association between environmental contaminants, notably persistent organic pollutants such as polychlorinated biphenyls (e.g. PCBS), heavy metals (e.g. Mercury) and pesticides, and insulin resistance, and eventually the development of Type 2 diabetes. Since First Nations consume more TF than the rest of the Canadian population, they may face up to 7 times greater exposure to certain contaminants (Pal et al., 2013). Pal et al. (2013) tested the associations between diabetes and plasma concentrations of pesticides in First Nations and found that diabetic individuals had higher age and lipid-adjusted plasma concentrations of some pesticides, suggesting that contaminants may play a role in diabetes development.
Housing
Additionally, housing on reserves is often inadequate. Crowded households are defined as those where there is more than one person per room, other than bathrooms, laundry room, hall, and attached shed (Kolahdooz et al., 2015). Canada’s National Health Survey revealed that in 2011, almost a third (27.2%) of First Nations living on reserves lived in crowded households, compared to 4% of non-Aboriginals (Statistics Canada, 2015). There is not only a problem with insufficient housing on reserves, but also of poor quality of dwellings. The First Nations Regional Longitudinal Health Survey i(FNRHS) in 2002-2003 showed that 33.6% of homes were in need of major repairs (i.e. for plumbing, electrical wiring, ceilings, etc.), whereas this was the case in only 7.5 % of Canadian households (Reading & Wien, 2009). Mold from inappropriate ventilation is also a widespread issue on many reserves. Household crowding has been associated with certain infectious diseases, asthma, poor mental health, stress, and allergies (Reading & Wien, 2009). Further, household crowding may also be a precursor to substance abuse and parenting issues, as well as youth behavioural problems (Reading & Wien, 2009). 2.1.3 Residential schools and cultural continuity
The high-school dropout rate among Aboriginal peoples is estimated at 50% (Neegan, 2005; Reading & Wien, 2009). In their report on the state of Band-Operated Schools, Anderson and Richards (2016) found that while 9 out of 10 non-Aboriginal young adults graduated from high-school, this was the case for 7 out of 10 First Nations living
off-reserve and only 4 out 10 FN living off-reserve (Anderson & Richards, 2016). Schools on-reserve have been found to be of much poorer quality than provincial schools for reasons that include remoteness, inherent social problems, lack of resources and complex administration between federal and provincial governments (Anderson & Richards, 2016).
Education is an important determinant of health at the proximal level, since poor education leads to a cycle of low literacy, unemployment and poverty for generations (Anderson & Richards, 2016; Kolahdooz et al., 2015). Poor literacy has also been associated with poor food skills and nutrition knowledge (Kolahdooz et al., 2015). However, distal causes are also responsible for the failure of educational systems to meet the needs of First Nations peoples in Canada. Residential schools, which were opened as early as the 1870s, with the last one closing in 1996, were church-run schools that aimed to turn Aboriginal children into “civilized people” by forcing them to leave their families and culture in exchange for a European way of life, void of all Aboriginal cultural practices, including speaking traditional languages, holding traditional beliefs, and eating according to traditional dietary patterns (Council of Canadian Academies, 2014; Neegan, 2005). Reports continue to surface to this day, revealing the trauma and its potential impact on the health of Indigenous peoples, generations later. A recent article explains that hunger in residential schools was widespread and likely to blame for the high mortality rates of students (Mosby & Galloway, 2017). Moreover, there are reports of inedible and rotten food being served, as well as force feeding. Such experiences may have caused traumatic memories and possibly created distorted relationships with foods for some survivors (Mosby, 2013). Another horror is that leading Canadian nutrition researchers went as far as conducting randomized controlled experiments on approximately 1000 malnourished children in six Residential Schools, without informed consent, between 1948 and 1952 (Mosby, 2013; Mosby & Galloway, 2017). Half of the malnourished test subjects were given micronutrient supplements, while the rest acted as a control group, and none were given additional caloric intake, despite researchers knowing that students were not receiving enough calories to meet their needs. Although nutrition was a young science, the notion of minimal caloric requirements to prevent starving was well understood by scientists at the time (Mosby, 2013). This unethical nutrition experiment is an example of the oppressive and dehumanizing nature of
these schools. The impact of this trans-generational trauma is still being felt today and has been related to many health issues, including mental health issues, suicide, alcohol and drug dependencies, and violence (Kolahdooz et al., 2015). In a focus group discussion, survivors listed a broad array of impacts of the residential schools, including diabetes, broken communities, loss of parenting skills, addictions and suicide (Oster et al., 2014).
Another potential impact of residential schools on health is that the experience of hunger, consistently reported by residential school survivors, may explain high rates of obesity and early-onset of insulin resistance and diabetes amongst Aboriginal peoples today (Mosby & Galloway, 2017). Survivors of residential schools recount a diet insufficient in energy, protein, and fat, little availability of fruits and vegetables, and low food hygienic quality, resulting in many food-borne infections (Mosby & Galloway, 2017). Population studies that have looked at the impact of famines or severe food restrictions in the 20th century have shown that chronic undernutrition can cause height stunting, with an increased risk for insulin sensitivity and greater fat-mass accumulation later in life (Mosby & Galloway, 2017). Through this pathway, stunting puts children at risk of becoming obese and developing Type 2 diabetes as adults, when sufficient calories become available (Mosby & Galloway, 2017).What’s more, these effects appear to extend across generations, where infants of mothers who experienced childhood undernutrition and later became obese and developed diabetes, have a higher risk of developing insulin resistance and diabetes. Some studies have shown effects to extend even to adult grandchildren of famine survivors (Mosby & Galloway, 2017).
In addition to the countless cases of abuse, ranging from spiritual and psychological, to sexual that have since been reported, one of the most significant repercussions of residential school was eroding cultural continuity (Kolahdooz et al., 2015). Cultural continuity describes “the degree of social and cultural cohesion within a community” and encompasses how knowledge is passed on from one generation to the next (Reading & Wien, 2009). Residential schools purposefully prevented indigenous forms of education, in which parents and elders commonly taught young people through observation, connection with the natural world, and giving children active roles and responsibilities
within the household. Furthermore, traditional foods, such as dried meats and berries, were considered lowly, and were confiscated from children whose parents would bring some for them (Neegan, 2005). In these ways, residential schools not only failed to meet the nutritional needs of the students, they also interfered with the passing of traditional food knowledge between generations.
Ground-breaking research in the 1990s showed that cultural continuity today is protective against suicide (Chandler & Lalonde, 1998). More recent work has since looked at other health impacts of cultural continuity. For instance, a mixed methods study that looked at the relationship between cultural continuity, self-determination, and diabetes in 31 First Nations communities in Alberta found an inverse relationship between diabetes prevalence and cultural continuity (Oster et al., 2014). Of all socio-demographic predictors of diabetes explored (income, employment, education, language), only Indigenous language knowledge, used as a proxy for cultural continuity, was found to be significantly associated with diabetes prevalence, even after adjustment for socio-economic factors. Traditional food intake has also been associated with cultural continuity (Oster et al., 2014). Thus, as research builds on the importance of cultural continuity, there is increasing evidence in favour of reforming educational institutions for Aboriginal youth, with an emphasis on integrating traditional forms of education and practices into the classroom. There has been a call for additional funding to ensure that language and culture are adequately covered in school curricula on-reserves, as such programs have been shown to improve high school retention (Anderson & Richards, 2016; Reading & Wien, 2009).
2.1.4 Employment, income, and food security
Despite representing roughly 5 % of the global population, indigenous peoples make up 15% of the global poor worldwide (FAO, 2010). In Canada, the poverty rate is double that of the non-aboriginal population and Aboriginal peoples receive greater amounts of social assistance (Egeland & Harrison, 2013; Reading & Wien, 2009). The unemployment rate for Aboriginal peoples in Canada has been said to be 2 to 3 times more than for the non-Aboriginal population (Reading & Wien, 2009). Income is a well-recognized determinant of health. In the case of Aboriginal peoples in Canada, low-income has been associated with increased likelihood of chronic diseases and poor mental health (Kolahdooz et al.,
2015). It is no surprise that when poverty is compounded with the high cost-of-living and high food prices, food insecurity becomes of particular concern in remote northern communities. As one example, The First Nations Food, Nutrition and Environment Study found that the cost of a nutritious food basket1 varied significantly among First Nations communities in Ontario (from $175 to $344 per week), while the cost in remote communities in the Yukon and Alberta have been found to be 80 to 200% more than in southern cities (Chan et al., 2014; Lawn & Harvey, 2003). Moreover, poverty affects the availability and accessibility Aboriginal peoples have to not only purchase foods from markets, but also to participate in traditional food activities, which have associated costs such as fuel and equipment (Domingo, 2016; Reading & Wien, 2009).
2.1.5 Health behaviours and health care systems
While Aboriginal peoples in Canada experience more chronic disease even when controlling for a number of behaviour and socioeconomic factors, their higher rates of smoking, obesity, lack of physical activity, and poor dietary habits are widely understood as lifestyle behaviours that compound the problem (Council of Canadian Academies, 2014; Pal et al., 2013; Reading & Wien, 2009; Willows et al., 2011b). Smoking cigarettes is more than twice as common amongst Aboriginal peoples in Canada compared to the rest of the Canadian adult population (Gionet & Roshanafshar, 2013). FNFNES data found that 39 % of First Nations adults in British Columbia reported smoking (2008-09), 49% in Ontario (2011-2012), 56% in Alberta (2013), and 59% in Manitoba (2010), while the Canadian average of people 12 years old and up was observed at 18.1% in 2014 (Chan et al., 2014; Statistics Canada, 2016). As a result, Aboriginal peoples have greater risk of contracting the diseases associated with smoking, and Aboriginal non-smokers are also more likely to be exposed to second-hand smoke.
Excessive alcohol consumption is another proximal determinant of health, associated with all-cause mortality (Reading and Wield, 2009). All three groups of Aboriginal peoples
1 Health Canada’s Nutritious Food Basket (NNFB) is a tool used to monitor the cost of about 60 foods that make up a healthy diet for Canadians (Health Canada, 2009).
living off-reserve were found to have greater alcohol consumption than non-Aboriginals (L. Gionet & Roshanafshar, 2011). Alcohol intake during pregnancy is also a concern for Aboriginal health, notably causing Fetal Alcohol Syndrome, which can have a range of impacts on child development (Reading & Wien, 2009). It is worthwhile to note that prior to European contact, there were no traditions of distillation or fermentation in Indigenous cultures in North America and that alcohol may only have been introduced to nations living in the Midwestern and western regions of North America as late as the mid-19th century. Alcohol’s relative newness has been identified as a key element that led to the development of harmful drinking practices, which have persisted across generations (Frank, Moore, & Ames, 2000).
Health care systems in Canada have also been widely criticized as not meeting the needs of Aboriginal peoples, be it for a lack of attention paid to the real issues at hand, such as chronic disease prevention, or due to limited social access, where services may not be culturally-appropriate or offered in people’s first language (Adelson, 2005; Egeland & Harrison, 2013; Reading & Wien, 2009). In many cases there is a lack of confidence in medical institutions, where traditional values may not be adequately regarded or integrated into care practices (Kuhnlein & Receveur, 1996b). Since health is more than simply the absence of illness, a broader vision of health, which extends beyond physical well-being, to include mental, emotional, and spiritual health, should be considered for First Nations Peoples (Kolahdooz et al., 2015; Nesdole et al., 2014).
2.1.6 Cultural norms
Some research has suggested that cultural preference may dictate body image perceptions and thereby influence body size and eating habits. For instance, a study in an Ojibway-Cree community in northern Ontario revealed that older adults preferred a heavier build. A possible explanation is that people consider larger body size to be a sign of strength, whereas thinness may evoke memories of times where infectious diseases were rampant (Willows, 2005). However, body image preferences are not homogenous, with some First Nation and Métis girls and women, mostly living in proximity to urban areas, viewing thinness as more desirable and have reported using restrictive eating behaviours in order to control their body weight (Willows, 2005).
3 Dietary Patterns of Aboriginal Peoples
3.1 Aboriginal peoples and the nutrition transition
Although the human diet has been evolving continuously since the Paleolithic period, changes have accelerated in the last three centuries, mostly, occurring rapidly over the last few generations (Haman et al., 2010; Popkin, 2006). This change in lifestyle is referred to as the “Nutrition Transition” and has occurred to varying degrees around the world (Popkin, 2006). The rate and extent of this shift has varied greatly amongst different Aboriginal groups across the country, but the overall impact of this change on health has been widespread (Willows, 2005).
Prior to contact with Europeans, varying traditional food systems offered Aboriginal peoples a wide diversity of foods from the land and water. Through hunting, fishing, gathering and agriculture, people engaged in physical activity and subsisted on diets largely high in animal protein, while being relatively low in fat and carbohydrates (Chard, 2010; Willows, 2005). There are reports that indicate that Aboriginal northern communities were mostly self-sufficient up to the 1950s, in some cases, relying only on staples such as flour and sugar to complement traditional food, in addition to some local gardens (Thompson et al., 2011). The catalyst of changing dietary patterns can be traced back to colonisation and settlement onto reserves in the 1900s (Chard, 2010). Reserves were often set up in remote locations where the soil was not fertile or it was difficult for previously nomadic nations to begin growing foods, especially in a northern climate. During the Great Depression, incomes from the fur trade fell, while animal populations declined largely due to over-hunting by non-Aboriginal trappers in preceding decades, compromising the availability and accessibility of traditional food sources (Mosby, 2013). As previously discussed, the abrupt severing of cultural continuity, which occurred during the residential school era, also played an important role in escalating changes in dietary patterns (Neegan, 2005). These varying factors led to an increased dependency on store-bought foods, a dependency that continues to rise in many communities today (Chard, 2010; Willows, 2005).
3.2 Assessments of dietary patterns in Aboriginal populations in
Canada
Despite the fact that many of the health disparities experienced by Aboriginal peoples in Canada have been linked to poor dietary quality, there is little information available on their consumption patterns, especially of First Nations living below the 60th parallel (Willows, 2005). The little research that has been conducted in select communities has largely studied the Arctic region among Inuit populations, where low intakes of fruit, vegetables, and fibre and excessive intakes of fat and sugar have been observed. For instance, in a study conducted among adults in Inuvialuit in the Northwest Territories (NWT), Erber and colleagues (2010) reported low intakes of fruits and vegetables, and traditional foods (TF), while the diet was seemingly very high in non-nutrient-dense foods (NNDF), such as sugar-sweetened beverages and highly processed foods. This study helped explain the results of previous research conducted among the same population that exposed low intakes of vitamins A and C, total folate and fibre (Erber, Beck, et al., 2010). Other studies have revealed dietary patterns that are often deficient or low in certain micronutrients, such as iron, folacin, calcium, vitamin D, and fibre (Willows, 2005).
Market foods most frequently consumed have been found to be processed, containing excessive amounts of energy, refined carbohydrates, free sugar and saturated fats, and when they make up the greatest proportion of the diet, they jeopardize overall diet quality (Batal et al., 2017; Chard, 2010; Erber, Hopping, et al., 2010; Halseth, 2015; Hopping et al., 2010; Kuhnlein et al., 2004; Popkin, 2006; Popkin & Gordon-Larsen, 2004; Receveur, Boulay, & Kuhnlein, 1997; Sheehy, Kolahdooz, Roache, & Sharma, 2015). For instance, a dietary quality study conducted in the Mohawk nation of Kahnawake found that fourth- to sixth-grade children exceeded the World Health Organization’s (WHO) recommended limit for free sugar intake, set at 10% of total food energy (Trifonopoulos, Kuhnlein, & Receveur, 1998). Research for Hopi, Sahtu Dene/Métis and Aboriginal children in Northern Alberta also found intakes of sugar to be high for school-children (Trifonopoulos et al., 1998). Data from the 2004 Canadian Community Health Survey (CCHS) cycle 2.2, which looked at Aboriginal adults living off-reserve in Ontario and western provinces, found that women between 19 and 50 years old and men between 31-50 years old
consumed significantly higher amounts of soft drinks than non-Aboriginal Canadians (Health Canada, 2012). Soft drinks add sugar and energy to the diet, without contributing essential nutrients (Health Canada, 2012).
A paradox exists, as the increase in variety of food stuffs to northern remote communities has not necessarily increased dietary diversity (i.e. diversity in terms of food groups), as people consume fewer traditional foods and only a restricted variety of market foods (Kuhnlein & Receveur, 1996a). And so, it is no surprising that many of the biggest health concerns for Aboriginal peoples are now associated with this new dietary pattern, including: obesity, diabetes, cardiovascular disease, anemia, and dental cavities (Batal, Gray-Donald, Kuhnlein, & Receveur, 2005; Willows, 2005).
3.3 Traditional food consumption
Aboriginal diets are unique in that they are made up of market foods and traditional foods. Traditional foods are “culturally accepted foods available from local natural resources that constitute the food systems of Aboriginal peoples’ diets” (Kuhnlein & Receveur, 1996a; Willows, 2005). In general, the term TF is used by First Nations and Métis, while Inuit prefer the term “country food” (Council of Canadian Academies, 2014). TF have been praised for their nutritional value, diversity, and cultural and spiritual significant and have been associated with protective effects against chronic diseases (Arvaniti & Panagiotakos, 2008). In fact, traditional food systems around the world, despite differing greatly, have been composed of a great variety of plant and animal foods, providing adequate amounts of micronutrients, fibre, while being low in refined carbohydrates or saturated fats (Kuhnlein & Receveur, 1996a). Research in the Canadian Arctic found that the decrease in TF availability and consumption to correspond with a decreased intake of vitamins A, C, D and E, as well as other nutrients, including iron, calcium, folate, omega-3 fatty acids, and fibre (Batal et al., 2005; Donaldson et al., 2010). Moreover, the benefits of consuming TF also encompass the physical activity required to harvest them, as well as their lower cost relative to healthy market foods (Halseth, 2015).
As previously discussed, in Aboriginal communities there has been a significant decline in the consumption of TF, notably for youth, who are more likely to consume processed store-bought food (Donaldson et al., 2010; Loring & Gerlach, 2015). Inuit populations went from consuming 100% of their dietary intake from traditional foods in the 19th century, to approximately one-quarter of their energy from these foods today (Erber, Beck, et al., 2010; Kuhnlein, Receveur, Soueida, & Berti, 2008; Mirindi, 2013). Though, another study revealed great variations in the amounts depending on the season, gender and age –with higher intakes reported for men compared to women and older people compared to younger people (Kuhnlein & Chan, 2000; National Collaborating Center for Aboriginal Health, 2012). In the Baffin Inuit community studied, the average amount of TF harvested for the entire community of about 400 people varied from 180 kg/day during the late summer harvest, to 100 kg/day in the early winter (Kuhnlein & Chan, 2000). Since little is known about current harvesting and consumption practices of First Nations living on-reserve in Canada, the First Nation Food, Nutrition and Environment Study set out to gather this data. To date, data collected by FNFNES in Manitoba in 2010 found that only 20% of participants reported harvesting traditional foods, with caribou being the most important traditional food consumed in the Taiga shield/sub-arctic ecozone, with an average of 113 days per year (Chan, Receveur, Sharp, Schwatz, et al., 2012; Council of Canadian Academies, 2014).
4 Diet quality
It is widely recognized that a well-balanced diet contributes to good health and that a poor diet is a risk factor for the development of chronic diseases (World Health Organization and Food and Agriculture Organization, 2003; Alberti et al., 2007). Choosing the appropriate metric to measure diet quality is essential to adequately understand its relationship with disease. A “single-nutrient approach”, focusing on individual nutrients was traditionally used in nutritional epidemiology (Arvaniti & Panagiotakos, 2008; Hu, 2002). However, it fails to assess interactions, such as influence on bioavailability and absorption, and it is often difficult to identify causality between one nutrient and disease due to confounding with other nutrients and/or foods. Since people do not consume single nutrients, but rather combinations of foods, this approach has been critiqued and has given
way to new methods that aim to assess dietary patterns in relationship to chronic diseases (Hu, 2002; Kourlaba & Panagiotakos, 2009; Waijers, Feskens, & Ocke, 2007).
Two main approaches have been developed in order to measure dietary patterns: a priori methods (known as “diet quality indices”), which use predefined dietary patterns, generally national dietary guidelines, as a framework with which to evaluate diets; and alternatively, empirically derived or a posteriori methods, either factor analysis or cluster analysis, which rely on statistical modelling of nutritional data collected from a sample population (Kourlaba & Panagiotakos, 2009; Mirindi, 2013; Perry et al., 2015; Vandevijvere et al., 2013). Since a posteriori methods do not reflect predetermined nutritional recommendations, they may not necessarily highlight optimal eating patterns, rather, they provide more of a snapshot account of the current eating patterns and behaviours of a population (Hu, 2002). Alternatively, if the dietary indices are based on standing nutritional recommendations that do not reflect the most up-to-date evidence in nutrition, there is a risk of overlooking certain correlations between diet and disease (Hu, 2002). As nutrition is a relatively new and constantly evolving science, this may also present a limitation if nutritional epidemiological research moves forward faster than the development of indices to measure diet quality.
4.1 Global diet quality indicators
With the main public health nutrition burden shifting away from micronutrient deficiencies to excessive energy and unbalanced macronutrient intakes, there is greater interest in using indices that consider global diet quality, which includes concepts such as adequacy, variety, balance, and moderation (Arvaniti & Panagiotakos, 2008; Garriguet, 2009). A great number of such indices have been developed and used in Canada and the United States. In an effort to identify the most appropriate diet quality indicator for use in the North American context, Dubois and colleagues compared three of the most popular indices with data from the Quebec Nutrition Survey conducted in 1990: the Diet Quality index (DQI), the healthy eating index (HEI), and the healthy diet indicator (HDI) (Dubois, Girard, & Bergeron, 2000). The authors concluded that the HEI was most suitable as it is a mixed-method dietary index, which means it is based on both nutrient content and the contribution
of each food group to the diet, reflecting standing nutrient recommendations and dietary guidelines. Previously, Kant (1996) had classified indices into three categories, according to their approach, as either being: 1) based on nutrients; 2) based on specific foods or groups; 3) a combination of both (Arvaniti & Panagiotakos, 2008; Kant, 1996). The HEI falls into this last category, where nutrients and foods included in the metric are associated with general wellbeing or specific health outcomes. They also found that of the three indicators, the HEI produced the highest correlation coefficient with the mean adequacy ratio1 (MAR) for each nutrient, as well as a stronger correlation with people’s perceptions of their diets (Chard, 2010; Dubois et al., 2000). Another strength is that its classification is easily interpreted, as it is a continuous measure, rather than a discrete one, as is based on a total score of 100 (Dubois et al., 2000; Woodruff & Hanning, 2010). HEI will be discussed in greater detail below.
4.2 The Healthy Eating Index
The HEI was initially developed by Kennedy and colleagues from the United States Department of Agriculture (USDA) in 1995 to assess how closely the American population was following dietary recommendations (Buhendwa, 2013; Kennedy, Ohls, Carlson, & Fleming, 1995). It is based on two main concepts: adequacy, a measure of nutrient sufficiency, and moderation, a measure of excessive consumption (Garriguet, 2009).
The first HEI included the following 10 components: grains, vegetables, fruits, milk, meat, total fat, saturated fat, cholesterol, sodium and dietary variety (Vandevijvere et al., 2013). Scores are assigned for each component, each worth 10 points, adding up to a total score of 100. Since its inception, the HEI has been continuously adapted to keep up with the changing Dietary Guidelines for Americans (Guenther, Reedy, & Krebs-Smith, 2008). It was first updated with the release of the 2005 Dietary Guidelines for Americans, which put a greater emphasis on the inclusion of whole grains in the diet, consideration of types of fats, and the “other food” category. In this version, diets that meet the minimum food-group recommendation for the nine adequacy components (total fruit, total vegetables, dark green
1 The MAR is the ratio of an individual’s nutrient intake to dietary recommendation for that specific nutrient (Woodruff & Hanning, 2010)