Environmental Hydraulics
Environmental impact and risk assessment
Water management of large dams
Th. Mouzelard, P. Archambeau, S. Erpicum & M. PirottonDepartment of Applied Hydrodynamics, University of Liege, Belgium
1 INTRODUCTION
Engineers are interested in developing efficient tools for the prediction of a large scope of hydraulic behaviours. Scale models are considered for a long time as powerful tools for the design of hydraulic structures. Provided the right similitude law is used, they give reliable and uncontested results. Such experimental tests on scale models remain attractive for highly complex situations where hydrodynamic models already fail to predict with confidence for example turbulent effects.
However, physical modelling suffers from several intrinsic defaults : high cost for building and measurement equipments, low geometrical flexibility once the model has been constructed, etc. In order to circumvent these problems, physical experimentations are more and more advantageously completed by numerical simulations. In this way, the quasi-tri-dimensional flow solver WOLF2D is currently used in the Laboratories in interaction with the physical model. The aim of this article is to show the benefits gained with the combination of both physical and numerical modelling, provided a suitable complementary approach is followed.
2 THE FREE-SURFACE FLOW SOFTWARE WOLF2D
All the numerical simulations presented in this report were performed with the free-surface flow solver WOLF2D. This efficient analysis and optimization tool is completely developed for several years in the Service of Applied Hydrodynamics and Hydraulic Constructions of the ULg.
WOLF is a hydraulic surface flow package where coexist in the same development environment the resolutions of the 1D and 2D depth-integrated Navier-Stokes equations as well as a physically based hydrological model, along with powerful graphical pre- and post-processings. Each code handles structured or on unstructured grids dealing with any topography or bed friction, for any unsteady situation with mixed regimes.
2.1 EQUATIONS SYSTEM
The governing equations for hydrodynamic free-surface flows are the Navier-Stokes equations for an incompressible fluid :
0 = ∂ ∂ + ∂ ∂ j j x hu t h (1) 4 3 2 2 cos j sin , 1, 2 j i i i i i i t i j i j j u u u h u u g g n u g G i t x x θ h θ x ν x ∂ ∂ + + ∂ + = + ∂ ∂ + = ∂ ∂ ∂ ∂ ∂ (2)
where the subscript j stands for a sum in both directions. Eqn (1) expresses the mass conservation, and eqn (2) the momentum conservation along the x- and y-axis. The different variables are defined as follows :
H is the water level, Z the bed elevation or bathymetry and h the water depth (h=H-Z) ui = two horizontal components of the depth-averaged velocity
g = gravitational acceleration
n = Manning’s roughness coefficient
νt = total kinematic viscosity
Gi = external forces as Coriolis effects
The total kinematic viscosity is given by eqn (3) :
2 1 2 2 1 2 2 ∂ ∂ + ∂ ∂ + ∂ ∂ + = x u x u x u j j t υ γ υ (3) with :
ν the fluid viscosity
γ a turbulence coefficient, empirically determined It must be outlined that no restrictive
assumption is needed for the bottom slope (Pirotton [1]). In order to simulate flows on very steep topographies (as spillways or torrents for example), local references are defined with the x- and y-axis following locally the mean bottom slope. This later technique ensures the water depth to be orthogonal to the main flow direction, as can be seen on Figure 1 (dotted arrows).
2.2 SPATIAL DISCRETISATION
The spatial discretisation of the 2D conservative shallow-water equations is performed by a widely used finite volume method (Mouzelard et al [2]). The partial differential equations are integrated on control volumes covering the whole computational domain. This ensures the mass and momentum properties to be conserved, especially across discontinuities such as hydraulic jumps.
Flux treatment is here based on two different upwind schemes. The first one uses an original flux-vector splitting technique developed for WOLF. Fluxes are split according to the sign of the flow path, along with a suitable downstream or upstream reconstruction for both parts according to stability analysis. Efficiency, simplicity, optimal agreement with source terms and low computational cost are the main advantages of this scheme.
On the other side, the well-known approximate Riemann solver of Roe brings its robustness to the code, and was introduced as reference in the scope of numerical comparisons. Both methods showed their ability to simulate sharp transitions without excessive smearing on several meshes or excessive growing of dissipative processes.
w at er de p th z x z x
Variable reconstruction can be selected to gain a first or second order accuracy on regular grids. However, it is well known that second order finite volume schemes, although very accurate in smooth regions, cause unphysical oscillations near the discontinuities. The flux reconstructions are therefore limited (Venkatakrishnan [3]) to prevent such undesired effects.
2.3 TEMPORAL DISCRETISATION
As we are mostly interested in transient flows, an accurate and non-dissipative temporal scheme has to be chosen. It has been experienced in the Department that implicit schemes do not provide a substantial advantage for transient free surface flows in comparison with the explicit ones (see Rogiest [4]). In this way, the Runge-Kutta algorithm is applied to solve the ordinary differential equations.
This well-known scheme can provide a suitable dissipation rate for an acceptable computer cost, and is commonly preferred to other popular coexisting schemes. Furthermore, for a steady state solution, this scheme is easily tuned to provide a higher dissipation rate in order to accelerate the convergence process.
3 THE NAM THEUN LARGE DAM SCALE MODEL
The Nam Theun II dam takes part in a complex of three dams located on the Nam Theun river, Laos. A gated spillway is integrated in the main structure, and is followed downstream by a stilling basin.
The Consultant Office Electricité de France (EDF) Pôle Industrie requested to the Laboratories of Fluid Mechanics, Applied Hydrodynamics and Hydraulic Constructions to undertake the study of the hydraulic scale model of the spillway and the stilling basin of the Nam Theun II dam.
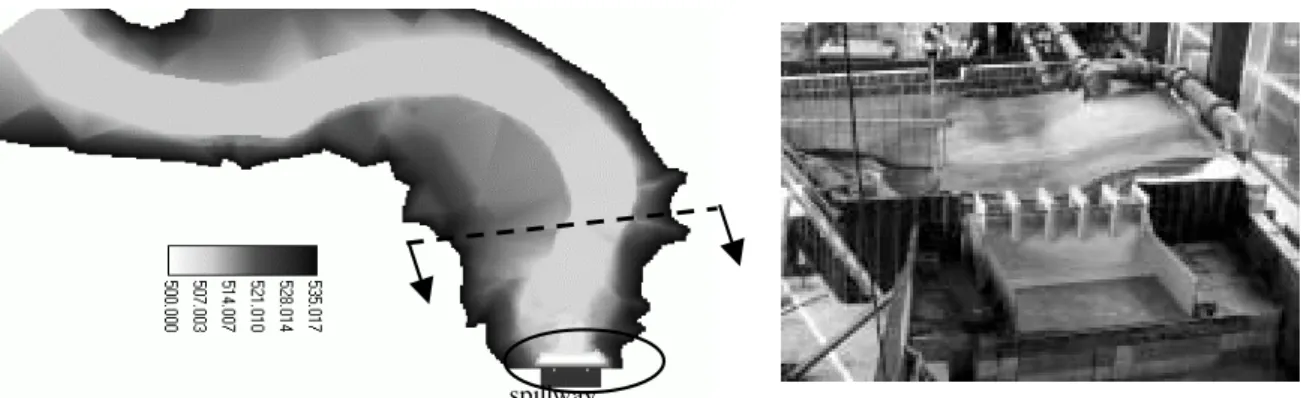
The topography of the upstream basin reported on the Figure 2 shows that the dam is located near an important meander, which should be included in the geometry of the scale model to ensure right stream orientation at the approach of the spillway.
Figure 2 : Topography (m) of the upstream basin Figure 3 : Global view of the scale model
However, the need of high precision measurements on the spillway induced the physical model to be scaled at 1/60. Therefore, the geometry of the scale model was restricted to the last part of the upstream basin (see the dotted line on Figure 2), the spillway and its stilling basin, and the first part of the downstream river (see Figure 3). In order to respect the real upstream flow orientation and repartition, some numerical simulations were decided to be performed to delineate the upstream scale model boundaries.
4 NUMERICAL SIMULATIONS
4.1 UPSTREAM PART
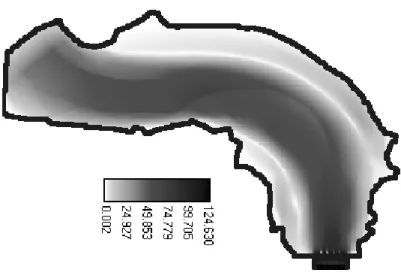
The building of a scale model including a large upstream area was impossible due to the scale used and the space limitation. A first series of numerical simulations covering the whole reservoir flow (Figure 2) of the dam was performed in order to compute the flow field near the spillway without influence of the upstream boundary conditions.
The maximum discharge was numerically introduced by an upstream filling basin without any downstream boundary condition (supercritical flow), thanks to the use of inclined axes. The results computed (Figure 4) show that the main stream leaves the river path, and flows in the floodplain. This causes a highly asymmetric flow near the spillway. This latter is in fact more effective by the right part (considered in the stream direction), and not by the left one as it could be expected by the topography design (see
Figure2). Figure 4 : Discharge on the upstream basin (m²/s)
4.2 SIMULATION ON THE GEOMETRY OF THE SCALE MODEL
A second set of simulations was performed on the precise geometry selected for the scale model. The results strongly differ from those obtained on the global geometry, and confirm the poor analogy of the discharge distribution at the upstream part of the scaled geometry, see Figure 5. It is obvious that the main flow follows the river bed path, in absence of the upstream bend.
Figure 5 : Discharge repartition at the upstream Figure 6 : Bed elevation of the filling basin limit of the scale model geometry
To improve the behaviour of this reduced geometry in comparison with the whole reservoir and to ensure correct upstream flow conditions for the scale model, several modifications were decided for the upstream part of the reservoir.
The first modification concerns the topography. In concordance with the scale model, the computation simulates an upstream filling basin. This means that there is no upstream
0 5 10 15 20 25 30 35 40 D ischar ge ( m ²/ s) Large scale simulation Simulation on the
scale model geometry
505 510 515 520 525 530 535 540 545 El evat ion ( m ) modified bed initial bed
discharge or speed boundary condition, but only a solid wall. The discharge is introduced in the geometry by a bottom infiltration process, which avoids any arbitrarily imposition of speed direction, and ensures a perfect fitting with the scale model conditions. As the filling procedure depends on the topography, it was decided to modify this latter in order to get the same discharge distribution as in the global, previous simulation. The river bed of the filling basin was thus deeply modified (Figure 6).
The second modification concerns the adjunction of deflectors to the upstream basin. Several simulations were performed to determine their number and to estimate their optimal length and orientation in the scope of minimising the difference with the large scale simulation. The figure 7 shows the discharge field with and without these two modifications. The bed modification ensures a good upstream discharge distribution, while the deflectors forces the flow in the right orientation. From these simulations, the scale model was build to respect the final design taking into account the effect of the whole reservoir. The deflectors are shown on the Figure 8.
Figure 7 :Discharge distribution before and after modifications on the scale model geometry.
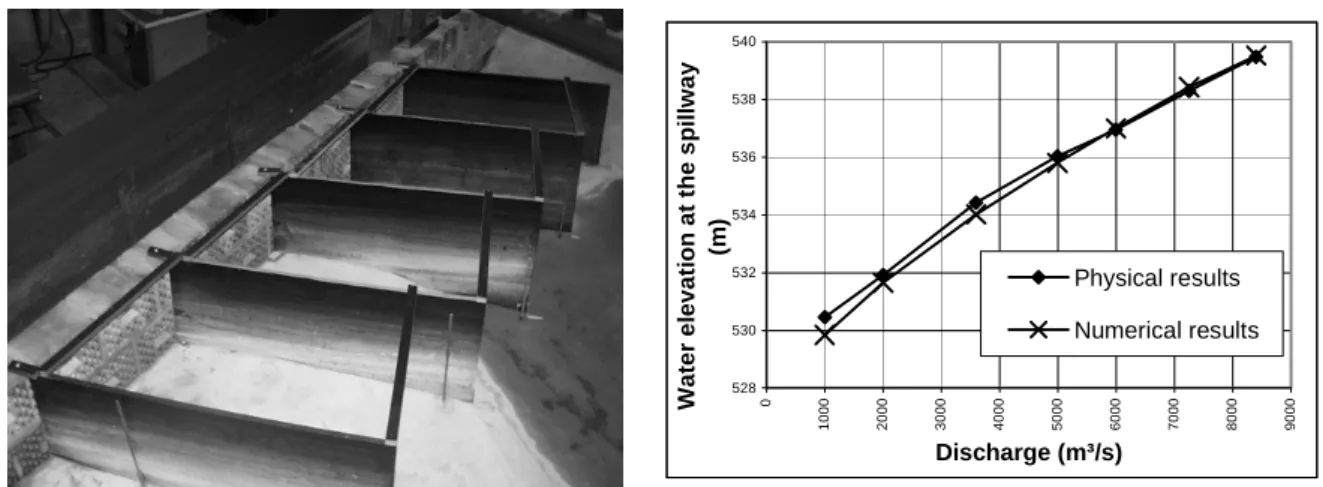
Figure 8 : Deflectors of the scale model. Figure 9 : Height/discharge curve of the spillway
4.3 HEIGHT/DISCHARGE CURVE OF THE SPILLWAY
The different measurements on the scale model enable a comparison between physical and numerical simulations. Figure 9 proves the good agreement obtained in the estimation of the height/discharge curve related to the spillway.
528 530 532 534 536 538 540 0 1000 2000 3000 4000 5000 6000 7000 8000 9000 Discharge (m³/s) Water el evati o n at th e sp illw a y (m ) Physical results Numerical results
4.4 STILLING BASIN AND RIVER RESTITUTION
The dam spillway is completed by five large gates to regulate accurately the discharge and the upstream level. However, the operations with asymmetric gate opening focused the attention because of the erosion risk in the downstream natural river. A complete numerical and physical hydrodynamic study of to the stilling basin design was thus performed to induce and control dissipation for a wide range of discharge
and gate opening configuration. Figure 10 : Speed field in the case of a single gate opened
Conclusions obtained from physical tests and numerical simulations showed that some opening configurations should be avoided to keep erosion process into an acceptable level. For example, the Figure 10 shows the speed field in the situation of a low discharge flowing through the right gate only. Such situation produces an extreme erosion downstream the stilling basin and must be rejected.
5 CONCLUSIONS
An original approach for the global study on a scale model was described. It demonstrates that the increase of the computers performance, and the efficiency of the actual free-surface flow solvers lead to useful numerical information for optimal scale model design and studies. In this way, the software WOLF2D developed by the Service of Applied Hydrodynamics and Hydraulic Constructions is described as an efficient tool in the scope of study and design of hydraulic structures. The detailed example of a large dam in Laos showed that the numerical simulations has allowed to win precious time by circumscribing the scale model in the precise part where a physical model is required.
References
[1] Pirotton, M., "Une Approche Globale pour Modéliser la Genèse et la Propagation des Crues Naturelles ou Accidentelles ", Classe des Sciences, Académie Royale de Belgique, 182 pages, 1997.
[2] Mouzelard, Th., Archambeau P. and Pirotton M., "An effective resolution of quasi-3D surface flows for spillways design and impact studies ", Hydroinformatics 2000.
[3] Venkatakrishnan, V., "On the accuracy of limiters and convergence to steady state solutions", AIAA paper, 1993.
[4] Rogiest, P., "An implicite finite volume scheme for the computation of unsteady compressible flows on multi-block structured grids.", Doctoral thesis, 1997.
[5] Pirotton, M., A. Lejeune, "River design and environmental protection in Europe; Planning of the river Ourthe in Wallonia, Belgium", Universitad de Cantabria, Sanatander, pp. 401-508, 1999.