@
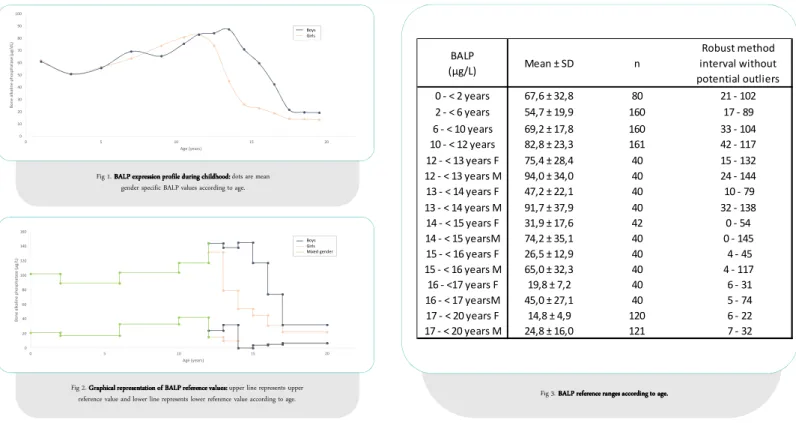
Fig 3. BALP reference ranges according to age.BALP reference ranges according to age.BALP reference ranges according to age.BALP reference ranges according to age.
@
PEDIATRIC REFERENCE INTERVALS FOR BONE ALKALINE PHOSPHATASE ON LIAISON
PEDIATRIC REFERENCE INTERVALS FOR BONE ALKALINE PHOSPHATASE ON LIAISON
PEDIATRIC REFERENCE INTERVALS FOR BONE ALKALINE PHOSPHATASE ON LIAISON
PEDIATRIC REFERENCE INTERVALS FOR BONE ALKALINE PHOSPHATASE ON LIAISON°°°° XL
XL
XL
XL
(DIASORIN
(DIASORIN
(DIASORIN
(DIASORIN°°°°))))
A. Ladang, O. Rousselle, A.-C. Bekeart, S. Kovacs, E. Cavalier
Department of Clinical Chemistry, ULiège and CHU of Liège, Belgium
Bone Alkaline Phosphatase (BALP) is an essential biomarker of bone formation together with osteocalcin. BALP is an enzyme produced by osteoblasts during bone mineralization. Its follow-up is useful in Paget disease, bone metastasis and diseases of phosphor-calcic metabolism such as vitamin D dependent rachitism and hyperparathyroidism. Due to children’s growth, bone metabolism and therefore bone turn-over markers are in constant evolution during childhood. Here, we defined age and gender specific reference intervals in a cohort of 1200 Belgian children.
Our cohort is based on healthy children selected from our daily routine. Under the age of 10 years, 40 boys and 40 girls were tested by 2 year age group while from 10 to 20 years, we defined age group of 1 year (40 boys and 40 girls per group). BALP was measured on Liaison XL (Diasorin°) with LIAISON° BAP OSTASE° kit (Diasorin°). After exclusion of outliers according to Tukey analysis, we defined an age and gender specific pediatric reference interval for each subgroup. In a second time, we assessed with Mann-Withney tests whether results were statistically different between subgroups. In the negative, groups were further fused to limit the number of age and gender groups.
Introduction
Introduction
Introduction
Introduction::::
Material
Material
Material
Material and Methods
and Methods
and Methods::::
and Methods
Results
Results
Results
Results::::
Conclusions:
Conclusions:
Conclusions:
Conclusions:
Fig 1. BALP expression profile during childhood: BALP expression profile during childhood: BALP expression profile during childhood: BALP expression profile during childhood: dots are mean gender specific BALP values according to age.
Definition of reference intervals is important to interpret clinical laboratory results and providing them is mandatory according to ISO 15189 standards. In this study, we provided reference intervals for BALP in a large cohort of 1200 healthy Belgian children.
@
0 - < 2 years 67,6 ± 32,8 80 21 - 102 2 - < 6 years 54,7 ± 19,9 160 17 - 89 6 - < 10 years 69,2 ± 17,8 160 33 - 104 10 - < 12 years 82,8 ± 23,3 161 42 - 117 12 - < 13 years F 75,4 ± 28,4 40 15 - 132 12 - < 13 years M 94,0 ± 34,0 40 24 - 144 13 - < 14 years F 47,2 ± 22,1 40 10 - 79 13 - < 14 years M 91,7 ± 37,9 40 32 - 138 14 - < 15 years F 31,9 ± 17,6 42 0 - 54 14 - < 15 yearsM 74,2 ± 35,1 40 0 - 145 15 - < 16 years F 26,5 ± 12,9 40 4 - 45 15 - < 16 years M 65,0 ± 32,3 40 4 - 117 16 - <17 years F 19,8 ± 7,2 40 6 - 31 16 - < 17 yearsM 45,0 ± 27,1 40 5 - 74 17 - < 20 years F 14,8 ± 4,9 120 6 - 22 17 - < 20 years M 24,8 ± 16,0 121 7 - 32 n Robust method interval without potential outliers BALP (µg/L) Mean ± SD 0 20 40 60 80 100 120 140 160 0 5 10 15 20 B o n e a lk a li n e p h o sp h a ta se ( µ g /L ) Age (years) Boys Girls Mixed gender 0 10 20 30 40 50 60 70 80 90 100 0 5 10 15 20 B o n e a lk a li n e p h o sp h a ta se ( µ g /d L) Age (years)Fig 2. Graphical representation of BALP reference values: Graphical representation of BALP reference values: Graphical representation of BALP reference values: Graphical representation of BALP reference values: upper line represents upper reference value and lower line represents lower reference value according to age.
After statistical analysis, we found no need of gender specific reference intervals below the age of 12 years (p > 0.05). We have defined that the most appropriate age groups are from 0 to 1 year old, 2 to 5 years old, 6 to 9 years old and 10 to 11 years old. For teenage years, we observed significant differences between each subgroup (p < 0.05 between each group of 1 year).
General expression profile showed a slight increase during childhood ranging from 67.6 µg/L to 82.8 µg/L followed by a constant decrease of BALP values during teenage years starting from 12 years old for female and 14 years old for male. For 17 to 20 years old subjects, mean was 14.8 µg/L for girls and 24.8 µg/L for boys.
Boys Girls