Biogas
(O
2
, CO
2
and DMS)
dynamics within and below sea
ice during coastal sea ice edge
retreat
www.ulg.ac.be/oceanbio/co2/
1Université de Liège, MARE, Unité d’Océanographie Chimique, Belgium
(Bruno.Delille@ulg.ac.be)
2
UMR 7621 , Observatoire Océanologique de Banyuls, France
3
Laboratoire Chimie Environnement, Université de Provence, Marseille, France
4
CNRS, Laboratoire de Glaciologie et Géophysique de l’Environnement, St Martin d'Hères,
France
Acknowledgements: Office for Scientific, Technical and Cultural affairs (A4/DD/B14 and EV/12/7E) IPEV
Approach
Fig. 2: Site
The study was carried out from
November to December 1999 during
the sea ice edge retreat in Terre
Adélie, Antarctica (66°40'S, 140°01 E).
Samples were collected weekly at four
stations (denoted A, B, C, D) located in
the vicinity of the Dumont d'Urville
base.
Analytical methods
For study area and sampling strategy , please refer to fig.1 and 2
• The inorganic carbon speciation was calculated from pH and total alkalinity (TAlk) measurements. pH was measured using commercial combination electrodes calibrated on to the total hydrogen scale using Tris and Amp buffers according to Dickson (1993). Attention has been paid to carry out pH measurement as soon as possible after return to the laboratory (typically less than 3 hours after sampling) and to make calibration between 1 and 3°C using buffers prepared at salinity of 30, 35, 40 and 80. CO2speciation was calculated using the CO2acidity constants of Roy et al. (1993) and assumption have been made that these latters are valid for salinity up to 90. The accuracy of pH measurements was 0.01 pH units. TAlk was measured using the classical Gran electrotitration method on 100ml GF/F filtered samples. The accuracy of TAlk measurements was 4 µeq.kg-1thus the errors in pCO2and DIC were 14 µatm and 9 µmole.kg-1 respectively. TAlk and DIC have been normalized at salinity 35
(TAlk35and DIC35)
• Phytoplankton was studied using chlorophyll a concentration. Samples were filtered by gentle vacuum filtration of 1l of seawater through a Whatman GF/F glass-fiber filter. The measurements of chlorophyll a were carried out following the recommendations of Arar and Collins (1997). Fluorescence was measured on a Turner Designs TD 700 spectrofluorometer.
• Sampling for dissolved DMS was realised by flushing seawater through a glass fibre filter (Whatman GF/F, Ø47 mm) into 20 mL polyethylene vials. DMS analyses were performed in the field during the four hours following the sampling using a gas chromatograph equipped with a flame photometric detector (HP 6890, 393 nm). DMS was then cryogenically trapped at -60°C on a tenax GC 80 loaded tube maintained in a bath of ethanol cooled by a Cryocool CC100 device. DMS was subsequently transferred to the gas chromatograph by thermal desorption of the tenax trap (boiling water) as detailed by Nguyen et al. (1990). Working chromatographic conditions applied here were an oven temperature of 95°C, a detector temperature of 200°C, and a flow rate at the flame of 30 mL.min-1of helium (carrier gas), 80 mL.min-1of air, and 55 mL.min-1of hydrogen. Calibration range was typically from 1.18 to 3.54 ng of DMS. The detection limit was found to be close to 0.2 ng of DMS, leading to a DMS detection limit under 0,3 nmol.L-1for 10 mL of sea-water.
Station D has been poorly sampled due to the early ice edge retreat at the most offshore site.
O
2saturation, and pCO
2cover a large
range of values and thereafter exhibit
large temporal changes. Furthermore
all the parameters are contrasted
between the three environments .
However each environment examined
individually shows conspicuous and
similar trends at all stations.
DMS concentrations in the underlying
layer is in the range of previous
observations in the Southern Ocean. In
platelet layer and brine, three times
higher concentrations can be
expected.
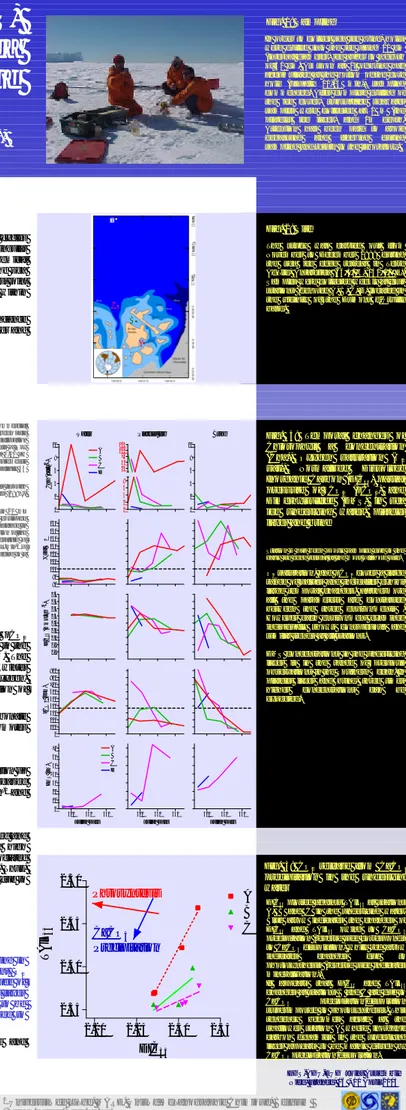
Fig. 4: CO
2release from CaCO
3precipitation in the underlying
water
DIC
35plotted against TAlk
35at stations
A, B and C in the underlying water.
Blue arrow indicates the changes of
DIC
35and TAlk
35owing to CaCO
3precipitation (reverse side corresponds
to CaCO
3dissolution) while red arrow
indicates changes due to
photosynthesis (reverse side indicates
mineralization).
It appears that DIC
35and TAlk
35changes at stations B and C are due to
CaCO
3precipitation/dissolution
superimposed to photosynthesis. This
tendency becomes acute at the
shallower station A where inorganic
carbon dynamics in the underlying
layer appears to be mainly driven by
CaCO
3precipitation/dissolution.
B. Delille
(1)
, D. Delille
(2)
, B. Jourdain
(3)
, M.Legrand
(4)
,
S. Ferrón Smith
(1)
and M. Frankignoulle
(1)
Fig. 1: Sampling
In order to collect sea ice brine, holes
were drilled into the ice using 10 cm
(internal diameter) ice auger to a depth
of 50 cm. As soon as 1l of brine had
accumulated at the bottom of the core
hole (usually 10-15 min), sampling
commenced. After complete drilling of
the ice cover, subsurface seawater
samples were collected at 0 m (the
platelet ice
layer)
and
1m
depth.
Attention has been
paid
to
avoid
degassing and freezing during
sampling and return to the laboratory.
Fig. 3: Temporal changes of
Chlorophyll a concentration
(Cha), Oxygen saturation (O
2sat), Normalized Dissolved
Inorganic Carbon (DIC
35)
,partial
pressure of CO
2(pCO
2) and
Dimethylsulfide (DMS) in sea
ice underlying water, platelet
layer and brine
2.20
2.25
2.30
2.35
2.35
2.40
2.45
2.50
A
B
C
Phtosyntesis
CaCO
3
Precipitation
DIC
35
TAlk
35
Brine 0 2 4 6 8 10 Platelet Ice 0 2 4 6 8 25 50 75 100 125 Water 0 2 4 6 8 10 A B C D Cha (µg.l -1) 80 90 100 110 120 130 140 150 160 %sat O 2 1.8 1.9 2.0 2.1 2.2 2.3 2.4 2.5 2.6 DIC 35 (mmol.kg -1) 0 100 200 300 400 500 600 700 800 900 pCO 2 (ppm) 320 330 340 0 10 20 30 40 50 60 70 A B C D Julian Days DMS (nM) 320 330 340 Julian Days 320 330 340 Julian DaysEGS-AGU-EUG Joint Assembly
Nice, France, 06 - 11 April 2003
D A B C 66°39' S 66°38‘30 S 66°38’ S
•
In spite of the high biological activity of the sea ice environment, biogeochemical cycles
within and below sea ice receive less attention that they actually deserve. In spite of the singular
interest of biogeochemistry in such an environment submitted to extreme physico-chemical
constrains, little is known of the impact of the biogeochemical processes specific to the sea
ice environment at larger scale for the whole marginal ice zone. We present here the first joint
measurements of dissolved oxygen (O
2), carbon dioxide (CO
2) and dimethylsulfide (DMS) within
and below sea ice.
•
We focused on the dynamic of these three biogas in relation to chlorophyll a abundance
during spring breaking of coastal fast ice. Three specific environments - brine, platelet layer and
underlying have been sampled.
Main results
•
Underlying water
exhibited (Fig.3) both O
2undersaturation (around 85%) and pCO
2oversaturation (up to 600 µatm). Moderate chlorophyll a content (less than 4 µg/l) leads to the
decrease of DIC
35while DMS concentration increases but remains below 20 nM. The
observed persistent undersaturation of pCO
2could be related at first sight to winter
hydrodynamical processes or organic matter decay, as
indicated
indicated by undersaturation of oxygen.
However, comparison of normalised DIC and TAlk shows that precipitation/dissolution of
CaCO
3(Fig.4) occurred below the sea-ice.
Precipitation of CaCO
3can be written as: Ca
2++ CO
3 2-
-> CaCO
3
. As a result, the carbonate
system shifts to higher CO
2levels so that precipitation of CaCO
3in the underlying water promotes
the increase of pCO
2and subsequent oversaturation.
•
In the
platelet layer
, O
2saturation level increased, from undersaturation to oversaturation up
to 130 % owing to high chlorophyll a content (up to 85 µg l
-1). Accordingly, pCO
2
decreased
down to 150 µatm while the magnitude of DIC
35changes was about 400 µmol kg
-1