HAL Id: hal-00716579
https://hal.archives-ouvertes.fr/hal-00716579
Submitted on 26 Apr 2021
HAL is a multi-disciplinary open access
archive for the deposit and dissemination of
sci-entific research documents, whether they are
pub-lished or not. The documents may come from
teaching and research institutions in France or
abroad, or from public or private research centers.
L’archive ouverte pluridisciplinaire HAL, est
destinée au dépôt et à la diffusion de documents
scientifiques de niveau recherche, publiés ou non,
émanant des établissements d’enseignement et de
recherche français ou étrangers, des laboratoires
publics ou privés.
Predicting the subjective evaluation of vehicle behaviour
in a driving simulator
Thomas Denoual, Jean-François Petiot, Franck Mars, Andras Kemeny
To cite this version:
Thomas Denoual, Jean-François Petiot, Franck Mars, Andras Kemeny. Predicting the subjective
evaluation of vehicle behaviour in a driving simulator. 11th Biennial Conference On Engineering
Systems Design And Analysis (ESDA2012), Jul 2012, Nantes, France. �hal-00716579�
HAL Id: hal-00716579
https://hal.archives-ouvertes.fr/hal-00716579
Submitted on 26 Apr 2021
HAL is a multi-disciplinary open access
archive for the deposit and dissemination of
sci-entific research documents, whether they are
pub-lished or not. The documents may come from
teaching and research institutions in France or
abroad, or from public or private research centers.
L’archive ouverte pluridisciplinaire HAL, est
destinée au dépôt et à la diffusion de documents
scientifiques de niveau recherche, publiés ou non,
émanant des établissements d’enseignement et de
recherche français ou étrangers, des laboratoires
publics ou privés.
Predicting the subjective evaluation of vehicle behaviour
in a driving simulator
Thomas Denoual, Jean-François Petiot, Franck Mars, Andras Kemeny
To cite this version:
Thomas Denoual, Jean-François Petiot, Franck Mars, Andras Kemeny. Predicting the subjective
evaluation of vehicle behaviour in a driving simulator. 11th Biennial Conference On Engineering
Systems Design And Analysis (ESDA2012), Jul 2012, Nantes, France. sous presse. �hal-00716579�
1
e
PREDICTING THE SUBJECTIVE EVALUATION OF DRIVERS IN A DRIVING
SIMULATOR DURING LOSS OF ADHERENCE
Thomas Denoual
RENAULT, Technical Centre for Simulation Avenue du golf, 78288 Guyancourt, France LUNAM Université, CNRS, Ecole Centrale de
Nantes, IRCCyN (institut de Recherche en Communications et Cybernétique de Nantes 1 rue de la Noë, BP 92101, 44321 Nantes Cedex3,
France
Jean-François Petiot
LUNAM Université, CNRS, Ecole Centrale de Nantes, IRCCyN (institut de Recherche en Communications et Cybernétique de Nantes 1 rue de la Noë, BP 92101, 44321 Nantes Cedex3,
France
Franck Mars
LUNAM Université, CNRS, Ecole Centrale de Nantes, IRCCyN (institut de Recherche en Communications et Cybernétique de Nantes 1 rue de la Noë, BP 92101, 44321 Nantes Cedex3,
France
Andras Kemeny
RENAULT, Technical Center for Simulation Avenue du golf, 78288 Guyancourt, France Arts et Métiers ParisTech, Institut Image 2 rue Thomas Dumourey, 71100
Chalons-sur-Saone, France
ABSTRACT
This paper investigates the possibility of using objective indicators to predict the subjective evaluation of a driver in a simulator. Situations of loss of adherence (LOA) were controlled and modulated in intensity and duration on a static and on a dynamic simulator (with and without a motion base). Multiple regression analyses were performed using the subjective evaluation of participants as the dependent variable, and the objective physical variables of the interaction driver/vehicle as the independent variables. The results assigned the most contributive variables to the accuracy of the model’s prediction for each subjective item, lateral acceleration and yaw rate for “control feeling” for instance. They also underlined the consistency of our approach and the influence of motion rendering on the perception of LOA intensity. A similar method could be used to evaluate the perception of various configurations of electronic stability control (ESC) systems.
INTRODUCTION
Electronic Stability Control (ESC) is an advanced driving assistance system (ADAS) that dynamically corrects vehicle trajectory according to the driver’s intentions in emergency situations [1][2]. It is particularly useful in cases of loss of adherence (LOA) in bends that are caused by excessive speed or a change in road grip, and can help to maintain vehicle control. The calibration and validation processes of ESC systems are time consuming. They require the development of physical prototypes based on expert drivers and specific terrain, especially for low adherence situations. Understanding drivers’ perceptions of and reactions to LOA situations would be useful for the engineering specification of ESC. Driving simulators are useful tools in vehicle design and perceptual studies. They allow the safe exploration of critical situations with naive drivers and without environmental bias [3]. Consequently, driving simulators are being used to study LOA episodes and ESC performance [4][5]. This study aimed at evaluating the possibility of using objective indicators to predict the subjective evaluation of vehicle behaviour in a simulator.
Measuring human perception has been a major challenge since the middle of the 19th century. In recent decades, with the
emergence of human-centred design approach [6],there has been a clear need to provide measurement standards and methods. Numerous sensitivity analysis methods have been proposed and used in various fields [7]. These methods, together with the relationship between stimuli and sensory response, have been widely investigated in areas such as textile [8] and food quality [9][10]. Multiple linear regression models based on the Weber-Fechner law seem to give good results for predicting textile quality [11] or food preferences [12]. However little has been done in the field of vehicle dynamics. We thus propose to explore the use of this approach to explain and predict drivers’ perceptions of LOA situations.
This paper presents two driving simulator experiments in which episodes of LOA were triggered to produce significant modifications of the vehicle trajectory without loss of control and road departure. Intensity and duration of the LOA were manipulated. Previous studies [13][14] have focused on developing an evaluation method to describe LOA episodes by means of subjective indicators using a non-structured-scaled questionnaire [15] and determining to what extent objective and subjective indicators were related [16].
In this study, the first objective was to develop models to explain each subjective item from the questionnaire and to determine which objective variables contributed the most to the accuracy of the predictions. Another objective was to determine the influence of motion rendering on the selected models and their predictions.
MATERIALS AND METHODS
PARTICIPANTS
STATIC SIMULATOR
A total of 20 participants (4 females, 16 males) aged between 20 and 24 (mean age: 21.4) participated in the first experiment on the static simulator. They had held a driving licence for 3.4 years on average and drove between 1000 and 25000 km per year (mean: 6325 km).
DYNAMIC SIMULATOR
A total of 20 participants (5 females, 15 males) aged between 19 and 58 years old (mean age: 36.8) participated in the second experiment. They had held a driving licence for 16.7 years on average and drove between 1000 and 40000 km per year (mean: 17538 km).
PROCEDURE
The same graphics database was used in both experiments. It reproduced an open countryside driving environment. Behavioural measures (lateral position, steering angle, lateral acceleration, etc.) were recorded during the trials at 20 Hz. All trials were performed on a short section of the driving environment, which comprised a straight line followed by a bend (total distance: 700 m; mean radius in the bend: 111 m) without traffic.
Modifying the adherence under the wheels when the vehicle reached a defined point in the bend yielded LOA. The intensity (adherence coefficient) and duration of the simulated LOA in the bend were manipulated as independent variables (IV). An adherence coefficient decrease corresponds to an increase in the intensity of LOA. These values of intensity and duration values were chosen to induce perceptible but controllable LOA simulated on the four wheels. The LOA situation induced a skid towards the outside of the bend. The environment did not give clues about a potential LOA (such as snow, rain or a mark on the road).
Participants were asked to keep to their lane without cutting the corner, even if there was no oncoming traffic. After a 10-minute practice session, they drove around the test bend at a predefined speed. An automatic gearbox and a speed regulator helped subjects in the first experiment. For the second experiment, the subjects received verbal assistance from the person conducting the experiment, in order to maintain a constant speed and stay focused on steering control. Four trials without any LOA were performed first in order to offer the participants the time to familiarize themselves with the task. For the LOA, a 3*3 factorial design was used (3 levels of intensity: 0.1, 0.3 & 0.5; 3 levels of duration: 250 ms, 500 ms & 750 ms). Nine experimental trials followed four preliminary trials representing mild and strong LOA episodes. The preliminary trials were conducted in order to familiarize the participants with the range of steering perturbations they would encounter during the experiment, but they were not analysed. A Williams Latin Squares design [17] was adopted to control rank and carry-over effects. After each trial, a questionnaire about the subjects’ perception of the event was displayed. As a first approach, the items were chosen to evaluate LOA perception using “actual” drivers rather than professional expert drivers. The latter are commonly used to evaluate the dynamic handling of a car during the design process.
Subjective item Question
Perceived intensity The LOA appeared to be weak/strong
Perceived duration The LOA appeared to be short/long
Danger I perceived a danger during the bend
Control feeling I easily kept my vehicle in the lane
Table 1: Questionnaire and definition of the rating scales for the LOA (Variable Yj)
Thus, a voluntary choice was to made to use nontechnical vocabulary. Two items were about the perception of the LOA itself (intensity and duration) and two others about its consequences in terms of perceived danger and feeling of control (Table 1). The aim here was not to use an extensive vocabulary to evaluate the participants’ perceptions in detail, but to evaluate a method that relies on subjective and objective indicators.
Answers to the questions were given by means of continuous horizontal scroll bars representing two ends of a continuous scale (0: totally disagree to 10: totally agree).
3 OBJECTIVE INDICATORS
Three types of objective indicators can describe a driving situation: vehicle dynamics, driver’s inputs and environmental indicators. The latter are even more easily recordable or computable in a driving simulator where the environment is managed. The specific case of LOA induces significant variations in vehicle dynamics and requires an appropriate response from the driver to keep the vehicle on the road.
For each trial, a time to stability (TTS) was computed. It corresponds to the time taken by the driver after the onset of LOA to bring the vehicle speed drift back into a stability envelope. The stability envelope is defined as the average standard deviation of the speed drift measured in the control condition for all the participants. The angular drift speed ( ) was calculated from the longitudinal speed (Vx) and the lateral speed (Vy):
(Equation 1)
Objective indicator Unit Acronym Time to stability Seconds TTS Maximum lateral
acceleration
Meters.seconds-2 LA
Maximum slip angle Degrees SA Maximum heading speed Degrees.seconds-1 HS Maximum steering wheel angle Degrees SW Maximum lateral deviation Meters LD Root mean square of
the lateral deviation
Meters LDrms
Table 2: Definition of the objective indicators (variables Xi)
According to the consequences of an LOA event on vehicle behaviour, pertinent indicators were computed in the TTS interval. The maximum lateral acceleration (LA, in m.s-2),
maximum slip angle (SA, in deg), maximum heading speed (HS, in deg.s-1) and TTS were chosen for the vehicle dynamics;
the maximum steering wheel angle (SW, in deg) for drivers’ inputs; and the maximum lateral deviation (LD, in m) and root mean square of the lateral deviation during TTS (LDrms, in m) for the environmental indicators (table 2).
APPARATUS
STATIC SIMULATOR
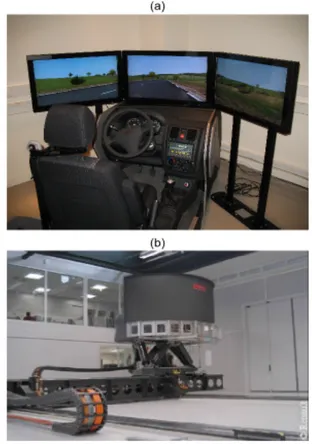
The first experiment was conducted on a fixed-base simulator at the IRCCyN laboratory (Fig. 1a). It consists of a compact size passenger car with actual instrument panel, clutch, brake and accelerator pedals, handbrake, ignition key and an adjustable seat with seat belt. It is equipped with a
TRW© active steering system for realistic "scale one" force-feedback. Transmission was carried out using an automatic gearbox. Vibrators are installed underneath the driver seat and upper position of the steering column to render engine noise and vibrations. The audio system reproduces the audio environment for an interactive vehicle. It comprises an amplifier, four speakers and a subwoofer.
Figure 1: (a) IRCCyN driving simulator. (b) Ultimate Renault driving simulator
The SCANeR©II software package was used with the CALLAS© dynamic vehicle model [18]. The visual environment was displayed on three 32-inch LCD monitors, each with a resolution of 1280 x 720. One monitor was positioned in front of the driver, with two laterals inclined at 45° from the front one, viewed from a distance of about 1 m and covering 115° of visual angle. A simple generic speed regulator was used, consisting of a PID corrector with a nominal speed of 75 km/h, using the automatic gearbox mode in order to reject inter-subject velocity bias. This also allowed the subject to concentrate on the steering task.
DYNAMIC SIMULATOR
The second experiment was conducted on the high-performance dynamic Ultimate simulator [19] at the Renault Technical Center for Simulation (Fig. 1b). It consists of a compact size passenger car based on a real Laguna interior design. The cab is mounted on a large X-Y table and a hexapod motion system to render physical accelerations and rotations. Transmission is carried out using a manual gearbox. A system of sound synthesis is used to reproduce engine noise and the
audio environment for an interactive vehicle. Active steering force feedback is computed by a proprietary model and reproduced by a TRW electric power steering system.
The SCANeR© Studio software package was used with a real-time version of the MADA (Advanced Modelling of Vehicle Dynamic) vehicle dynamic software, developed by RENAULT. The visual environment was displayed on a cylindrical screen (radius 1.9 m) by three single-chip DLP projectors, each with a resolution of 1024 x 768. The system covers a visual angle of 150°. Speed regulation was unavailable for this experiment.
DATA ANALYSIS
The objective indicators mentioned above are composed of a set of basic properties i, for which a measured value Xi has been obtained. Each basic property can be considered as a stimulus that may be perceived by the driver, and may create an associated sensation Ai. It is said that the Weber-Fechner law
can be applied to represent the relation between a stimulus and its sensory response in a fairly wide area of this stimulus. We hypothesize that the Weber-Fechner law is also valid for the study of such a complicated stimulus as basic property i. Thus, we used a logarithmic transformation on the measured values Xi
to obtain Ai, objective variables used in the next modelling step.
The purpose of this study was not to find all the parameters for each basic property. We concentrated on “high level” subjective descriptors, which enable us to describe the situation from a non-expert driver point of view. In order to simplify the method, we assume that the perception of these descriptors is a weighted sum of the basic properties. Let j be a subjective descriptor and Yj the magnitude of its sensation, we propose a
multivariable linear model, where Yj is the dependent variable
and Ai are the independent variables:
(Equation 2)
Multiple linear regression models were determined to predict each subjective descriptor from both static and dynamic simulator data. The selection of the best model was made with a step-by-step procedure according to the AIC criterion (Akaike information criterion, a measure of the relative goodness of fit of models - best model selection procedure; STATISTICA, 2004).
Parameters estimates for all models were tested using t-test. To evaluate the quality of the models, we used a two-fold validation procedure. For each subjective descriptor and each simulator, we have a dataset of 180 observations (20*9). We split it randomly into two blocks of N=90 observations, the first one to determine the multiple regression models (training) and the second one to evaluate the predictive capabilities of the models (holdout validation).
Three indicators were used to estimate the quality of the linear adjustment:
• The determination coefficient of the regression R2. It represents the percentage of variance taken into account by the linear model,
• The p-value of the Fisher’s test (variance analysis –
significance of the model),
• The Mean Absolute Percentage Error (MAPE). It represents the forecast accuracy of the model (equation 3): the smaller the MAPE, the better the forecast accuracy. MAPE is a measure of how high or low are the differences between the predictions and actual data. For e.g., a 15% MAPE means on average that the predictions from a model will be 15% higher or lower than in actuality. The MAPE was computed on the validation set.
(Equation 3)
The MAPE can be compared to the MAPEn of a « naive » model, which would simply predict the average value of all the data, for each observation.
(Equation 4)
To assess the quality of the model, we propose to compute the predictive confidence, a measure of the improvement gained by the model over chance. The predictive confidence is defined by:
(Equation 5)
We also compute the Pearson coefficient correlation (r) between the predicted values by the models and the actual observed values Yj on the validation sample, to evaluate the
quality of the predictions.
RESULTS
For each subjective variable Yj, a two variables model was
chosen according to the AIC criterion (Eq.6).
(Equation 6)
In the followings tables, all parameters are given with their standard deviation for each multiple regression linear model on the static (table 3) and the dynamic simulator (table 4). For each subjective variable Ai, the standardized coefficient (βi*) is
given to show the more contributive variable of each model. Residuals analyses have been performed to check basic hypotheses of the generalized analysis.
5 Yj β0 SD β1 SD β1* A1 β2 SD β2* A2 F p R² Total variance Perceived Intensity -8.49 3.34 2.41 0.57 0.53 SA 3.45 1.36 0.32 HS 91.38 <.05 0.68 10.39 Perceived duration -12.69 4.34 3.97 0.98 0.62 SW -0.49 0.48 -0.16 LDrms 14.81 <.05 0.25 9.08 Danger -11.94 2.60 3.80 2.13 0.32 LA 2.42 1.37 0.32 SW 2.30 <.05 0.39 12.56 Control feeling 28.38 2.94 -0.49 0.41 -0.13 TTS -7.55 1.13 -0.72 HS 99.88 <.05 0.70 9.47
Table 3: Models parameters, selected objective variables and statistics of multiple linear regressions for subjective variables on static simulator (without motion base)
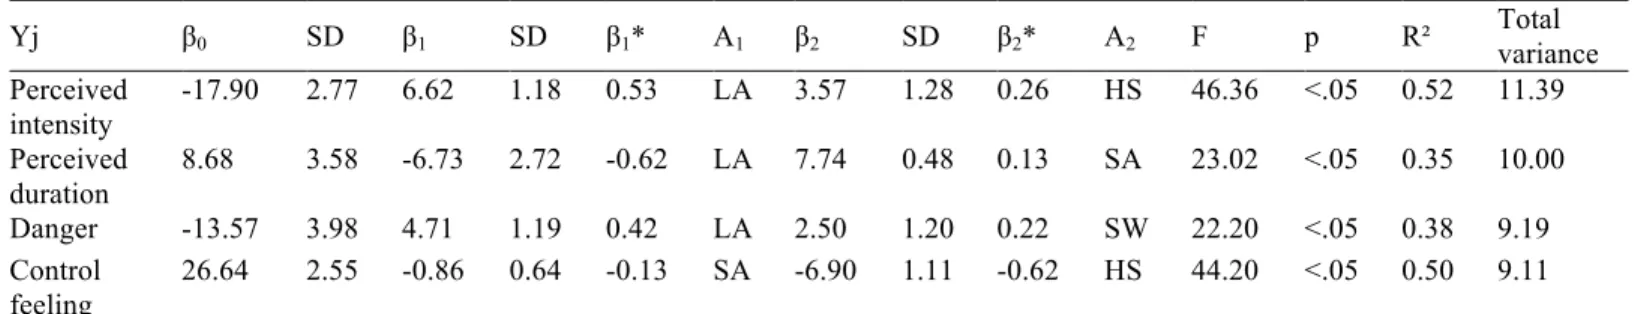
Yj β0 SD β1 SD β1* A1 β2 SD β2* A2 F p R² Total variance Perceived intensity -17.90 2.77 6.62 1.18 0.53 LA 3.57 1.28 0.26 HS 46.36 <.05 0.52 11.39 Perceived duration 8.68 3.58 -6.73 2.72 -0.62 LA 7.74 0.48 0.13 SA 23.02 <.05 0.35 10.00 Danger -13.57 3.98 4.71 1.19 0.42 LA 2.50 1.20 0.22 SW 22.20 <.05 0.38 9.19 Control feeling 26.64 2.55 -0.86 0.64 -0.13 SA -6.90 1.11 -0.62 HS 44.20 <.05 0.50 9.11
Table 4: Models parameters, selected objective variables and statistics of multiple linear regressions for subjective variables for dynamic simulator (with motion base)
The followings tables give the results of the MAPE criteria (equation 3), the predictive confidence (equation 5) and the coefficient correlation between predicted and actual values for each model on static (table 5) and dynamic simulator (table 6).
Yj MAPE Pc r Perceived intensity 0.72 45.57 0.77 Perceived duration 0.93 23.76 0.58 Danger 0.82 30.92 0.55 Control feeling 0.30 55.38 0.77
Table 5: MAPE, Pc and correlation coefficient indicators for model forecast on static simulator
Yj MAPE Pc r Perceived intensity 0.43 42.70 0.74 Perceived duration 0.48 36.52 0.58 Danger 0.63 12.88 0.62 Control feeling 0.38 50.55 0.77
Table 6: MAPE, Pc and correlation coefficient indicators for model forecast on dynamic simulator
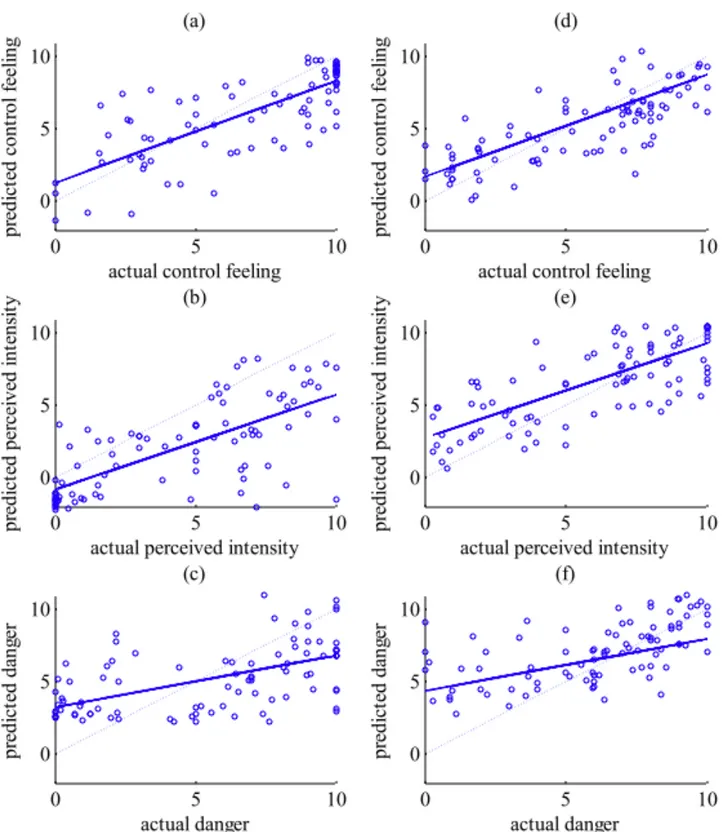
Figure 2 represents the correlation between observed and predicted scores for all subjective indicators on the static and dynamic simulators for the evaluation data sample.
Figure 2: Correlation between actual and predicted scores for feeling of control , perceived intensity and danger (n=90) for static (a,b,c) and dynamic (d,e,f) simulator. Solid line: actual correlation, dotted line: perfect correlation (actual=predicted)
7 Without motion base With motion base Yj H Sig. H Sig. Perceived intensity 26.63 n.s 20.63 n.s Perceived duration 34.84 p<.05 34.84 p<.05 Danger 83.8 p<.05 48.19 p<.05 Control feeling 34.58 p<.05 41.42 p<.05
Table 7: Kruskal-Walis test results for between-subject effect on subjective items; df=19 and n=90 for each
experiment
A significant between-subject effect was observed (Table 7) on the subjective items for both experiments, except on “perceived intensity”.
DISCUSSION
The first objective of the study was to evaluate how the chosen models could explain the variability of the subjective items and which objective variable was the most influential in each model. The results of the model selection method applied on the subjective items showed similar trends with both the static and dynamic simulators in terms of explanation capabilities. The models were able to explain more than 50 % of the variability for perceived intensity and feeling of control. However, poorest results were observed for perceived duration (static: R² = 0.25 and dynamic: R² = 0.35) and danger (static: R² = 0.39 and dynamic: R² = 0.38). This could be explained by the large between-subjects variability observed on these items.
Heading speed was the second contributive variable for explaining perceived intensity in both dynamic and static simulators. This suggests that heading speed variation had a primary influence in detecting and assessing variation of LOA intensity. Interestingly, the most contributive variable in the models differed in both experiments. On the static simulator, the slip angle was the most contributive variable, while the lateral acceleration dominated on the dynamic simulator. This suggests that the perception of LOA intensity was mostly influenced by vestibular and other inertial cues. However, in the absence of motion rendering, drivers principally relied on visual cues to estimate the strength of the LOA .
The feeling of control was mainly influenced by heading speed variation, in both the static and dynamic simulators. In both cases, the second contributive variable has a very weak normalized coefficient. This suggests that heading speed variation was the most influent variable in explaining the subjective assessment of feeling of control.
As suggested by a previous study [14], the duration of the LOA was poorly perceived in the simulator, which could explain the poor fit of the model. This also does not allow us to discuss the selected contributive objective variables, which differed in both experiments. The models obtained for perceived danger did not show a much larger explanatory
power, but the same objective variables contributed the most for both simulators. The level of lateral acceleration and quantity of steering wheel angle needed to correct the trajectory had a primary influence on perceived danger. This supports the idea that drivers control a variable safety margin of perceived lateral acceleration according to their anticipated steering deviations when negotiating bends [20].
From a global point of view, the models obtained with the static simulator explained more variability than those obtained in the dynamic condition. A plausible explanation is that the static simulator gave fewer cues to subjectively assess LOA events and that a simple multiple linear regression model is sufficient to fit the data. Through motion rendering, the dynamic simulator provided more complex stimuli to the driver, closer to a real driving situation. Models with interactions should be preferred, especially to take into account visuo-vestibular interactions that come into play in the perception of self-motion [21]. In this case a linear model may not be sufficient.
It remains now to examine the capabilities of the selected models to predict new scores. Even if the selected models for both static and dynamic simulators were not able to capture all the variability of subjective items assessment, they gave good correlation scores (around 0.75) for predicting values of perceived intensity and feeling of control. For feeling of control, errors in prediction (as measured by the MAPE) were quite similar in the static and dynamic conditions. This suggests that motion rendering had little influence on this subjective item. Given that the variation of heading speed was the most contributive variable, the fidelity of the heading motion restitution should be investigated. For perceived intensity, errors in prediction are markedly better in the dynamic condition (MAPE = 0.43) than in the static condition (MAPE = 0.72); again, this suggests a determining influence of motion rendering on the perception of LOA intensity. The selected models for predicting perceived duration and danger have coefficients of correlation that are too small; thus, further investigations will be necessary to improve them.
The predictive confidence values are the highest for “perceived intensity” and “feeling of control ”. For both simulators, these subjective items are predicted with the highest accuracy. For all subjective items, we noticed that the predictive confidence values are in the same range for both static and dynamic simulator. This underlines the consistency of our approach.
CONCLUSION
Multiple regression analyses were used to evaluate the relations between the subjective judgements and the vehicle dynamics for loss of adherence episodes. Mathematical models based on established psychophysical principles (the Weber-Fechner law) were tested. They were able to explain more than 50% of the variance for two subjective items out of four. This study highlights the objective indicators of vehicle behaviour that influence the variation of each subjective indicator the most. This study is a preliminary approach to objectivize
drivers’ perceptions and to help the tuning of ADAS by means of a simulator. Further research is planned to optimize the model prediction in various situations. A similar method might be used to objectivize how drivers perceive various configurations of ESC.
BIBLIOGRAPHY
[1] Liebemann, E.K., Meder, K., Schuh, J. and Nenninger, G., 2004, “Safety and Performance Enhancement: The Bosch Electronic Stability Control (ESP),” SAE Paper No. 2004-21-0060, Detroit, MI, USA.
[2] Erke, A., 2008, “Effects of electronic stability control (ESC) on accidents: A review of empirical evidence,” Accident Analysis & Prevention, 40(1), pp. 167-173. [3] Kemeny, A., 2009, “Driving Simulation for Virtual
testing and perception studies,” Proceedings of DSC
Europe Conference 2009, Monte-Carlo, pp. 15-23.
[4] Watson, G., Papelis, Y. and Ahmad, O., 2006, “Design of Simulator Scenarios to Study Effectiveness of Electronic Stability Control Systems,” Transportation Research Record, 1980, pp. 79-86.
[5] Papelis, Y.E., Watson, G.S. and Brown, T.L., 2010, “An empirical study of the effectiveness of electronic stability control system in reducing loss of vehicle control,” Accident Analysis & Prevention, 42(3), pp. 929-934. [6] Rossi, G.B. and Berglund, B., 2011, “Measurement
involving human perception and interpretation,” Measurement, 44(5), pp. 815-822.
[7] Christopher Frey, H. and Patil, S.R., 2002, “Identification and Review of Sensitivity Analysis Methods,” Risk Analysis, 22(3), pp. 553-578.
[8] Giboreau A., Navarro S., Faye P., Dumortier J., 2001, Sensory evaluation of automotive fabrics: the contribution of categorization tasks and non verbal information to set-up a descriptive method of tactile properties. Food Quality and Preference, 2(5–7), 2001, pp 311-322.
[9] Williams, A.A., 1994, “Flavour quality — Understanding the relationship between sensory responses and chemical stimuli. What are we trying to do? The data, approaches and problems,” Food Quality and Preference, 5(1-2), pp. 3-16.
[10] Skovgaard, M., 1995, “Modelling relations between instrumental and sensory measurements in factorial experiments,” Food Quality and Preference, 6, pp. 239-244.
[11] Mazzuchetti, G., Demichelis, R., Songia, M. and Rombaldoni, F., 2008, “Objective Measurement of Tactile Sensitivity Related to a Feeling of Softness and Warmth,” Fibres & Textiles in Eastern Europe, 16(4), pp. 67-71.
[12] Cliff, M.A., Dever, M.C., Hall, J.W. and Girard, B., 1995, “Development and evaluation of multiple regression models for prediction of sweet cherry liking,” Food Research International, 28(6), pp. 583-589.
[13] Denoual, T., Mars, F., Petiot, J.-F., Reymond, G. and Kemeny, A., 2010, “Drivers’ perception of simulated loss of adherence in bends,” Trends in driving simulation
design and experiments, A. Kemeny, F. Merienne, S.
Espié, eds., Les collections de l’INRETS, Paris, pp. 43-53.
[14] Denoual, T., Mars, F., Petiot, J.-F., Reymond, G. and Kemeny A., 2011, “Drivers’ Perception of Loss of Adherence in Bends: Influence of Motion Rendering,” Journal of Computing and Information Science in Engineering, 11(4), 041004.
[15] Strigler, F., Touraille, C., Sauvageot, F., Barthelemy, J. and Issanchou, S., 1998, “Les épreuves,” évaluation
sensorielle: manuel méthodologique, F. Depledt, F.
Strigler, eds., Lavoisier, pp. 45-83.
[16] Petiot, J.-F. and Yannou, B., 2004, “Measuring consumer perceptions for a better comprehension, specification and assessment of product semantics,” International Journal of Industrial Ergonomics, 33(6), pp. 507-525.
[17] Williams, E.J., 1949, “Experimental Designs Balanced for the Estimation of Residual Effects of Treatments,” Australian Journal of Scientific Research, Series A: Physical Sciences, 2, pp. 149-168.
[18] Lechner, D., Delanne, Y., Schaefer, G. and Schmitt, V, 1997, “Méthodologie de validation du logiciel de dynamique automobile CALLAS,” Ingénieur de l’automobile, 713, pp. 10-38.
[19] Dagdelen, M., Berlioux, J.C., Panerai, F., Reymond, G. and Kemeny A., 2006, “Validation process of the ULTIMATE high-performance driving simulator,”
Proceedings of DSC Europe Conference 2006, Paris, pp.
37-48.
[20] Reymond, G., Kemeny, A., Droulez, J. and Berthoz, A., 2001, “Role of lateral acceleration in curve driving: driver model and experiments on a real vehicle and a driving simulator,” Human Factors, 43(3), pp. 483-495. [21] Kemeny, A. and Panerai, F., 2003, “Evaluating
perception in driving simulation experiments,” Trends in Cognitive Sciences, 7(1), pp. 31-37.