HAL Id: hal-00318067
https://hal.archives-ouvertes.fr/hal-00318067
Submitted on 3 Jul 2006
HAL is a multi-disciplinary open access
archive for the deposit and dissemination of
sci-entific research documents, whether they are
pub-lished or not. The documents may come from
teaching and research institutions in France or
abroad, or from public or private research centers.
L’archive ouverte pluridisciplinaire HAL, est
destinée au dépôt et à la diffusion de documents
scientifiques de niveau recherche, publiés ou non,
émanant des établissements d’enseignement et de
recherche français ou étrangers, des laboratoires
publics ou privés.
Equatorial ionospheric disturbance observed through a
transequatorial HF propagation experiment
T. Maruyama, M. Kawamura
To cite this version:
T. Maruyama, M. Kawamura. Equatorial ionospheric disturbance observed through a
transequato-rial HF propagation experiment. Annales Geophysicae, European Geosciences Union, 2006, 24 (5),
pp.1401-1409. �hal-00318067�
www.ann-geophys.net/24/1401/2006/ © European Geosciences Union 2006
Annales
Geophysicae
Equatorial ionospheric disturbance observed through a
transequatorial HF propagation experiment
T. Maruyama and M. Kawamura
National Institute of Information and Communications Technology, Koganei, Tokyo, 184-8795, Japan Received: 1 September 2005 – Revised: 9 February 2006 – Accepted: 21 April 2006 – Published: 3 July 2006 Part of Special Issue “The 11th International Symposium on Equatorial Aeronomy (ISEA-11), Taipei, May 2005”
Abstract. A transequatorial radio-wave propagation experi-ment at shortwave frequencies (HF-TEP) was done between Shepparton, Australia, and Oarai, Japan, using the radio broadcasting signals of Radio Australia. The receiving fa-cility at Oarai was capable of direction finding based on the MUSIC (Multiple Signal Classification) algorithm. The re-sults were plotted in azimuth-time diagrams (AT plots). Dur-ing the daytime, the propagation path was close to the great circle connecting Shepparton and Oarai, thus forming a sin-gle line in the AT plots. After sunset, off-great-circle paths, or satellite traces in the AT plot, often appeared abruptly to the west and gradually returned to the great circle direction. However, there were very few signals across the great cir-cle to the east. The off-great-circir-cle propagation was very similar to that previously reported and was attributed to re-flection by an ionospheric structure near the equator. From the rate of change in the direction, we estimated the drift ve-locity of the structure to range mostly from 100 to 300 m/s eastward. Multiple instances of off-great-circle propagation with a quasi-periodicity were often observed and their spa-tial distance in the east-west direction was within the range of large-scale traveling ionospheric disturbances (LS-TIDs). Off-great-circle propagation events were frequently observed in the equinox seasons. Because there were many morpho-logical similarities, the events were attributed to the onset of equatorial plasma bubbles.
Keywords. Ionosphere (Equatorial ionosphere; Ionospheric irregularities) – Radio science (Ionospheric propagation)
1 Introduction
After the pioneering work done by R¨ottger (1973), not much attention has been paid to high-frequency transequatorial
Correspondence to: T. Maruyama
propagation (HF-TEP) experiments using a direction find-ing technique in ionospheric studies, except for a short cam-paign at a Peruvian longitude (Flaherty et al., 1996). How-ever, it was shown early on that HF-TEP observations can be used for remote detection of equatorial ionospheric distur-bances. Comparing the off-great-circle propagation along the Lindau-Tsumeb transequatorial path and the radar backscat-ter at Nairobi, Kelleher and R¨ottger (1973) found a high cor-relation between the occurrences of these two events. Later, R¨ottger (1976) suggested that a macro-scale structure of the equatorial ionosphere that causes off-great-circle propaga-tion is related to the formapropaga-tion of equatorial spread-F (ESF) irregularities through a spatial resonance mechanism that amplifies traveling ionospheric disturbances.
The basic mechanism of the ESF onset came to be known as the Rayleigh-Taylor (R-T) instability (e.g. Fejer and Kel-ley, 1980). The nonlinear evolution of the Rayleigh-Taylor instability forms density depleted plasma bubbles, which in-trude into the topside and extend along the magnetic field line over several thousand kilometers. Satellite in-situ obser-vations revealed density biteouts in the topside ionosphere. Tsunoda et al. (1982) showed that the local uplifts observed by east-west scanning radar are vertically connected with topside ion density biteouts measured by the Atmospheric Explorer-E (AE-E) satellite. Weber et al. (1982) related the topside density biteouts measured by the AE-E satellite to bottomside signatures through airglow and ionosonde mea-surements. Local uplifts of bottomside isodensity surfaces cause a 630-nm airglow depletion and oblique ionosonde echoes from local electron density gradients (Weber et al., 1980). Airglow depletion appears as a band with an east-west dimension ranging from 50 to 200 km, and is elongated in the direction of the magnetic meridian over 3000 km or more (e.g. Weber et al., 1980; Mendillo and Baumgardner, 1982). A recent nonlinear simulation of R-T instability vealed a three-dimensional structure of a plasma depleted re-gion, which is associated with bottomside uplifts along the
1402 T. Maruyama and M. Kawamura: TEP observation of equatorial ionospheric disturbances Shepparton Oarai 60 120 180 E 60 S 30 0 30 60 N Latitude, deg HF Transequatorial Propagation Experiment Radio Australia Longitude, deg. Yamagawa Darwin 8000 km
Magnetic Equator
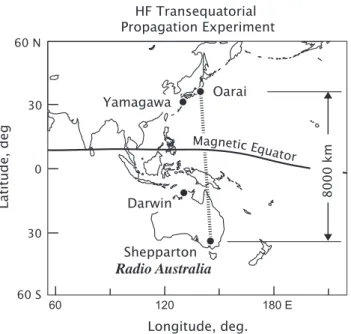
Fig. 1. Geometry of the HF transequatorial propagation experiment
between Shepparton, Australia and Oarai, Japan. A VHF transe-quatorial propagation experiment between Darwin and Yamagawa was reported in 1980.
magnetic meridian (Keskinen et al., 2003). The modulated isodensity surfaces, a bottomside signature of plasma bub-bles, would change HF radio wave propagation paths because of local ionospheric tilt. Thus, HF-TEP experiments should reveal the local uplifting of the ionospheric layer associated with plasma bubbles.
One major difficulty in transequatorial propagation exper-iments is finding a suitable location pair in the two hemi-spheres near the conjugate points. We located the MUSIC (Multiple Signal Classification) directional-finder (Schmidt, 1986; Hawlitschka, 2006) in Oarai, 100 km northeast of Tokyo, in our propagation experiments. The MUSIC al-gorithm is applicable to any kind of radio wave modula-tion. Thus, no dedicated transmitters were required if a ra-dio broadcasting station already existed. Rara-dio Australia is a station in Shepparton, 180 km north of Melbourne, Australia, that transmits HF signals, 24 h a day.
2 Measurement setup
Broadcasting signals of Radio Australia transmitted from Shepparton (145.3◦E, 36.2◦S) were received at Oarai
(140.6◦E, 36.3◦N). The transmitting and receiving stations were aligned along the 140–145◦E meridian separated by 8000 km and the great circle direction from Oarai to Shep-parton is 4.3◦ from due south to east, as shown in Fig. 1. The Oarai MUSIC HF direction finder consisted of seven crossed-loop antennas, each 2 m in diameter, aligned in a 60-m diameter circle. The azimuth and elevation angle
25 20 15 10 5 Frequency, MHz 03 21 15 09 03 UT, hr 11.65 11.88 15.23 15.24 21.725 21.725 17.75 17.75 6.08 6.02 9.475 Frequency allocation,
Radio Australia (Shepparton), May 2005
9.71
5.995
Fig. 2. Frequency allocation of Radio Australia (Shepparton) as of
May 2005. The frequencies were subject to change depending on the season and solar activity.
resolutions of the direction of arrival (DOA) were 1◦ and
up to three ray directions were simultaneously resolved with a time resolution of 0.5 s. In general, radio broadcasting signals are transmitted simultaneously at several frequen-cies and those frequenfrequen-cies are changed depending on the lo-cal time and season. Thus, the receiving frequencies were scanned, i.e. the azimuth and elevation angles were measured for 8 s when signals were received, and then the measurement was moved to the next frequency. An example of frequency allocation is shown in Fig. 2.
3 Results
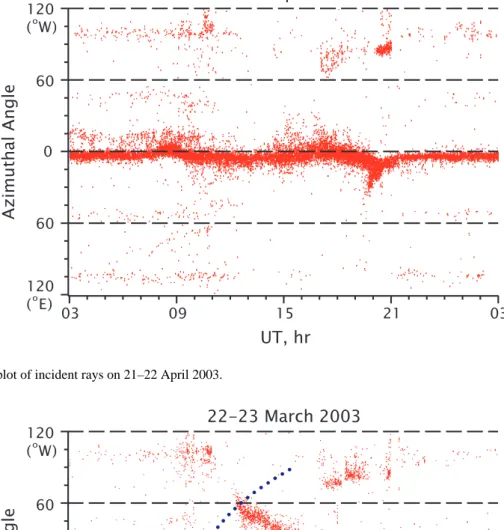
Our major interest was the off-great-circle propagation caused by an ionospheric tilt associated with large-scale structures. We analyzed the temporal variation of the az-imuth angle of the DOA. Results were plotted in azaz-imuth- azimuth-time diagrams (AT plots), as shown in Fig. 3. This example was from the day of 21–22 April 2003, and local midnight is centered. The angle was measured from due south to east or west. In HF broadcasting, several stations generally use the same frequencies for transmission, which is undesirable for the current experiment. Fortunately, most stations are in the Northern Hemisphere and interference from these sources can be easily recognized by eye in the AT plots. Points with an azimuth angle greater than 60◦to the west in Fig. 3 and other AT plots (Figs. 4, 5, and 7) are from such sources of interference.
During the daytime (UT + 09 h 20 min is mean local time at 140◦E), the DOA of Radio Australia was close to the great circle, forming a single horizontal trace near 4◦E in the AT plot. At about the sunset terminator, the DOA shifted west-ward reaching due south at 08:40 UT and returned to the
21-22 April 2003
120 (oW) 120 (oE) 60 0 60Azimuthal Angle
03 21 15 09 03UT, hr
Fig. 3. Azimuth-time plot of incident rays on 21–22 April 2003.
22-23 March 2003
120 (oW) 120 (oE) 60 0 60Azimuthal Angle
03 21 15 09 03UT, hr
Fig. 4. The same as for Fig. 3, but for 22–23 March 2003. The dotted curve means a constant local time condition at the reflection point.
normal direction by 09:30 UT. After this, the trace shifted eastward and gradually returned to the normal direction through the night. This pattern was basically repeated ev-ery day and we interpreted it as a terminator effect. Similarly, near the sunrise terminator, the ray direction shifted eastward and gradually returned to the normal daytime direction. This pattern was also repeated every day.
Figure 4 shows an example of a satellite trace observed on 22–23 March 2003, in addition to the above-mentioned diur-nal pattern of the DOA. The satellite trace abruptly appeared at 12:00 UT in the direction of 60◦to the west and moved eastward at a constant rate for about 3.5 h.
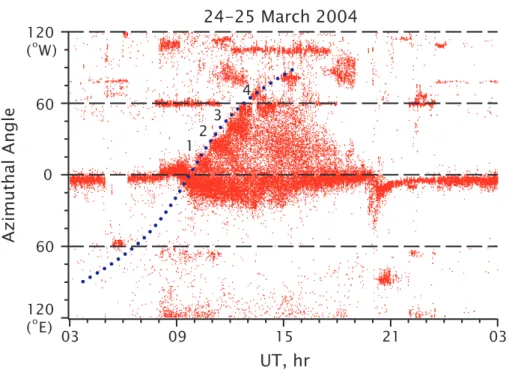
A more spectacular event observed on 24–25 March 2004 is shown in Fig. 5. This figure shows multiple satellite traces
1404 T. Maruyama and M. Kawamura: TEP observation of equatorial ionospheric disturbances 12 3 4
24-25 March 2004
120 (oW) 120 (oE) 60 0 60Azimuthal Angle
03 21 15 09 03UT, hr
Fig. 5. The same as for Fig. 3, but for 24–25 March 2004.
that appeared in the west, each similar to the satellite trace in Fig. 4 but of a shorter duration. At least four traces last-ing about one hour were observed (numbered from 1 to 4). They were nearly evenly spaced in the diagram and the start position shifted westward with time. However, the individ-ual traces were tilted eastward. A blob between numbers 3 and 4 was probably interference, since it appeared every day during these months irrespective of the satellite traces. Each satellite trace kept its shape for about 1 h, and then became diffused. In addition, the main trace was somewhat scattered during the night compared with the previous two nights.
4 Discussion 4.1 Terminator effect
First, we discuss the DOA deviation from the great circle di-rection that repeatedly appeared near the sunset and sunrise terminators. At the sunset terminator, the layer height rapidly rises due to the evening enhancement of the eastward electric field (e.g. Fejer et al., 1989), in addition to the rapid chem-ical recombination in the bottomside. The equatorial east-ward electric field is enhanced for about two hours before its reversal near 19:30 LT. During this period, the layer height increases by several tenths to 100 km or more, although the amount greatly varies with the season and solar activity (Fe-jer et al., 1989). If the local time pattern of changes in the layer height at a given location is equivalent to the longitu-dinal structure over the equator at a given instance, the bot-tomside isodensity surface will tilt over 3000 km, reaching
higher altitudes in the east, thus causing the shift of the DOA to the west. When the layer reaches the maximum altitude – in other words, when the vertical drift direction reverses – the isodensity surface becomes horizontal and the DOA returns to the great circle direction. After that, the DOA shifts to the east because of the reversed tilt of the layer caused by the per-sistent downward drift. Through the night, the DOA returns to the great circle direction when the layer height reaches the chemical equilibrium state.
Near sunrise, new ionization starts in the east in the lower part of the ionosphere, which results in a tilt of the isodensity surface with a lower altitude in the east. Thus, the DOA of the incident ray shifts east.
4.2 Onset time of satellite traces
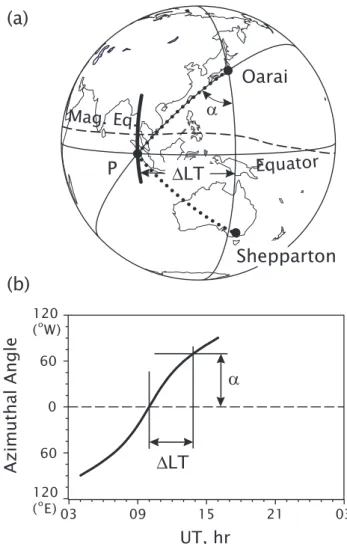
By assuming that the radio waves forming the satellite traces are reflected by the bottomside structure of plasma bubbles near the equator, we relate the points in the AT plot to the lo-cal time at the reflection point. The bottomside signature of plasma bubbles is a local uplift elongated along the magnetic meridian over several thousand kilometers with an east-west width of about 50–200 km (Tsunoda et al., 1982; Weber et al., 1982; Mendillo and Baumgardner, 1982). In this paper, we use the term plasma bubble for this bottomside signature. The magnetic declination angle near the equator at Southeast Asian longitudes is close to zero. We thus consider a north-south aligned linear structure model (Fig. 6a). As Sheppar-ton and Oarai are in almost geographically conjugate loca-tions, we assume that the reflection point P lies at the geo-graphic equator. A great circle passing through P and Oarai
is drawn and the azimuth angle α is related to the longitude of P. The longitudinal distance between Oarai’s meridian and P, together with UT when a signal is received, gives the lo-cal time at the reflection point or the location of the plasma bubble. In the AT diagram, the locus of the points fitting a constant local time condition at the reflection point is an S curve (Fig. 6b). The time (UT) where the S curve crosses
α=0◦in the diagram is the local time (LT) at Oarai’s merid-ian; i.e. LT = UT + 09 h 20 min (corresponding to the longi-tude of 140◦E).
In Figs. 4 and 5, the line of constant local time (the S curve) that contacts the satellite traces crosses the horizontal line of α=0◦near 09:45 UT, which corresponds to 19:05 LT. To generalize, we plotted all data points for the days on which satellite traces were observed during March 2003 (i.e., 23 of 31 nights) together in Fig. 7. The upper-left envelope of the satellite traces, west of the main trace, coincides well with the S curve, i.e. satellite traces started at the same lo-cal time. Recently, beam steerable Equatorial Atmosphere Radar (EAR) at a longitude of 100◦E revealed that the onset time of radar backscattering from a plasma bubble is con-fined to a narrow time slot after sunset (Yokoyama et al., 2004). A white dotted curve showing the mean diurnal varia-tion of the main trace is also plotted in Fig. 7. The two dotted curves intersect at the time when the DOA of the main trace returned to the great circle direction after the westward de-viation caused by the evening enhancement of the upward
E×B drift. That is, the satellite traces started when the layer
vertical drift reversed. This is consistent with radar backscat-ter plumes that often start when the layer is at its peak height or the layer is descending (Argo and Kelley, 1986). From an-other perspective, the fact that the starting point of the satel-lite traces was aligned with the S curve, a constant local time condition at the geographic equator, provides evidence sup-porting the validity of our assumption regarding the reflec-tion points at the geographic equator. If the reflecreflec-tion points were located at a latitude higher (lower) than the geographic equator, α should have been large (small) for the same north-south aligned plasma bubble.
In Fig. 7, there are very few traces to the east of the main trace (the lower half of the plot). A similar east-west asym-metry of HF-TEP radio reception rate is reported by R¨ottger (1973), although the degree of asymmetry looked stronger in our observations. One possible explanation is the east-west asymmetry of the structure. Tsunoda (1983) found that plumes of radar backscatter from ESF start at the west wall of the upwellings.
4.3 Drift velocity and spatial structure
Satellite traces of the off-great-circle propagation in AT plots moved eastward. The quantity we observed was the azimuth angle of the DOA, α, which was related to the location of plasma bubbles, as illustrated in Fig. 6. For the event of 22–23 March 2003, we estimated graphically the drift
ve-Equator
∆
LT
Oarai
P
03 21 15 09 03UT, hr
∆
LT
Shepparton
Azimuthal Angle
(a)
(b)
120 (o W) 120 (o E) 60 0 60Mag. Eq.
Fig. 6. Relationship between the direction of arrival of the incident
ray (α) and the reflection point (P) at the geographic equator. The dotted curve represents the ray path reaching Oarai.
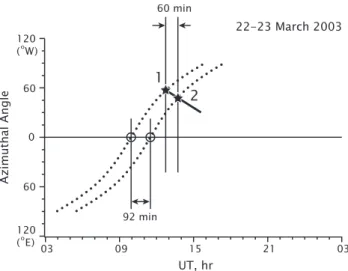
locity using the S-curve slider, as shown in Fig. 8. In the figure, the thick slanted line replicates the satellite trace and we put two reference points on it. Two dotted S curves were drawn to obtain the local time at the reflection points. The lo-cal time difference at the reflection points was 92 min, while the actual elapsed time was 60 min. The excess local time of 32 min was due to the eastward movement of the reflec-tion point, which corresponded to 8◦in longitude or 890 km. Thus, the drift velocity was calculated as 247 m/s. In this process, a different pair of reference points yields a different velocity because the tangent of the S curve at the reference points becomes shallower with any divergence from the hor-izontal line of α=0◦. A reference point pair closer to the line of α=0◦yields a lower velocity.
We calculated the drift velocities for the satellite traces observed in the high occurrence season around the March equinox by applying this method. In general, the nighttime bulk zonal drift velocities of plasma drift and neutral wind
1406 T. Maruyama and M. Kawamura: TEP observation of equatorial ionospheric disturbances
March 2003
120 (oW) 120 (oE) 60 0 60Azimuthal Angle
03 21 15 09 03UT, hr
Fig. 7. Azimuth angle of incident rays for 23 days on which satellite traces were observed in March 2003. All data points were put together
in one diagram. The white dotted curve is the averaged main trace.
1 2 60 min 92 min 120 (oW) 120 (o E) 60 0 60 Azimuthal Angle 03 21 15 09 03 UT, hr 22-23 March 2003
Fig. 8. Graphical estimation of zonal drift velocity (see the text for
details).
near the equator vary with local time (Fejer et al., 1985). We chose reference points where one was near the start of the satellite trace and the other was 60 min to the right, i.e. drift velocities were determined for about 19:30–20:30 LT at the reflection point. Figure 9a shows the drift velocity for Febru-ary to April over three years, while Fig. 9b shows it for the month of the largest occurrence frequency only (March) and Fig. 9c shows it for the other months (February and April). The drift velocity depended on the month, becoming higher
during the high occurrence month, with a median value of about 220 m/s and lower during the other months, with a me-dian of about 190 m/s. The meme-dian value of the drift velocity over the three months was 200 m/s (Fig. 9a). In all cases, the drift velocity was higher than the average plasma drift veloc-ity obtained by the Jicamarca radar (Fejer et al., 1985), which was about 150 m/s at 20:00 LT for the solar maximum period. The neutral wind velocity obtained by the DE-2 satellite for similar conditions was somewhat higher than the Jicamarca radar results (Fejer et al., 1985), but still it was lower than our drift velocity.
Space-based far ultraviolet (FUV) optical measurements from an imager aboard the IMAGE satellite revealed that the zonal drift velocity of equatorial plasma bubbles largely de-pends on the longitude (Immel et al., 2004). The highest velocity was 9.9◦/h (306 m/s) around the Indian sector, while the mean speed was 6.5◦/h (200 m/s). Lin et al. (2005) dis-cussed the difference between the plasma bubble drift veloc-ities based on the IMAGE FUV observations and the plasma drift velocities obtained from the ROCSAT-1 satellite, which are much lower than the FUV bubble velocity. Our estimated drift velocity based on the HF-TEP observation is close to the IMAGE results.
In the calculation of drift velocities described in this paper, we assumed that the reflection point P lay at the geographic equator. When the reflection point was assumed to be at the magnetic equator, which is about 8.5◦ northward of the geographic equator at longitudes from 110–140◦E, we ob-tained a lower velocity by some 30 m/s. To reach a definitive
30 20 10 0 400 350 300 250 200 150 100 50 0 February to April (2003-2005) 20 10 0 400 350 300 250 200 150 100 50 0 Drift velocity, m/s February/April (2003-2005) 20 10 0 Number of events 400 350 300 250 200 150 100 50 0 March (2003-2005) (a) (b) (c)
Fig. 9. Zonal drift velocity for (a) the February to April period
from 2003 to 2005, (b) March (high occurrence month) only, and
(c) February and April.
conclusion regarding the drift velocity and to support fur-ther discussion on the difference in the background plasma drift velocity, we need to perform more propagation experi-ments between magnetically conjugate points while obtain-ing simultaneous ground-based observations near the reflec-tion point.
For the multiple events on 24–25 March 2004 in Fig. 5, the estimated drift velocity was 232 m/s, although this esti-mation was not very accurate, since the traces were blob-like rather than lines. Using this velocity, we then estimated the wavelength of the periodic satellite traces. The local times of the onset of these traces were the same, and the onset time (UT) was delayed by 50 min for each. In 50 min, the onset location moved 1390 km westward. During the same time, the first bubble drifted 700 km eastward. Thus, we obtained a separation between the two bubbles of 2090 km, which is in the range of large-scale traveling ionospheric dis-turbances (LS-TIDs). This is fairly large compared with the horizontal wavelength of equatorial patches investigated by R¨ottger (1973), in which the disturbances were in the range of medium-scale traveling ionospheric disturbances (MS-TIDs). The IMAGE FUV observations also show a sepa-ration distance between airglow depletion bands in a range from 400 to 1100 km. In our HF propagation experiment, we often observed diffused traces, like the late local time sec-tion and main trace shown in Fig. 5. Most probably,
mul-tiple bubbles with a small separation caused these diffused traces. Another explanation is the bifurcation of bubbles, i.e. the high-latitude section of the airglow depletions split into two or more bands (Mendillo and Baumgardner, 1982). Although we assumed a specular reflection for the HF ra-dio propagation, if the local uplifts contained smaller scale structures, a scattering mechanism cannot be excluded. The equatorial ionospheric structure should have a wide spectrum and different techniques are likely to be sensitive to different wavelengths.
4.4 Seasonal variation
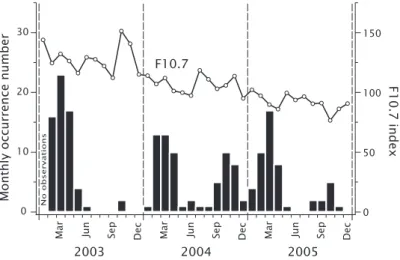
Figure 10 shows the monthly occurrence frequency of satel-lite traces and the monthly mean F10.7 solar flux index. (The vertical axis shows the number of days on which one or more satellite traces were observed in each month.) Occurrences were mostly confined to the months from February to April with a secondary peak around October. Seasonal variation in the occurrence of equatorial irregularities is known to vary with longitude. At the longitudes where the magnetic decli-nation angle is small, like Southeast Asia to India, ESF and plasma bubbles tend to be active around the equinoctial sea-sons (Maruyama and Matuura, 1984; Burke et al., 2004a, b). Similar equinoctial occurrence maxima of gigahertz equato-rial scintillations were reported by Paulson (1981) and Fang and Liu (1983).
In addition to the general equinoctial maxima, a March/September asymmetry can be seen in Fig. 10, which was not clearly seen in the seasonal longitudinal variation diagram of density biteout occurrence at 800 km based on a large database of DMSP satellite observations (Burke et al., 2004a, b). The degree of asymmetry in Fig. 10 dif-fered from year to year; strong asymmetry was observed in 2003, but the asymmetry was much less significant in 2004. A transequatorial propagation experiment in the VHF band conducted between Darwin, Australia, and Yamagawa, Japan (see Fig. 1) also revealed equinoctial maxima and March/September asymmetry of the signal reception rate (Tanohata et al., 1980). The reception rate was higher at the March equinox than the September equinox in some years, while it was almost equal in other years. The transequatorial propagation in the VHF band is thought to be due to forward scattering by irregularities inside a plasma bubble or wave guiding by a sharp boundary of the bubble (Heron, 1981).
During the three years analyzed here, the solar activity gradually declined as seen in the change in the F10.7 in-dex from about 130 to 80 (Fig. 10). Except for the very small number of occurrences during the September equinox in 2003, the occurrence number generally decreased. This tendency is also consistent with the climatology of plasma density biteout detection at 800 km altitudes by the DMSP satellite (Huang et al., 2002).
1408 T. Maruyama and M. Kawamura: TEP observation of equatorial ionospheric disturbances
30
20
10
0
Monthly occurrence number
2003 2004 2005
No observations
Mar Jun Sep Dec Mar Jun Sep Dec Mar Jun Sep Dec
150 100 50 0 F10.7 index F10.7
Fig. 10. Monthly occurrence of satellite trace and F10.7 solar flux index.
5 Concluding remarks
An HF transequatorial propagation experiment was con-ducted by receiving broadcasting signals of Radio tralia transmitted from Shepparton near Melbourne, Aus-tralia. Off-great-circle propagation was often observed at nighttime, and this was attributed to bottomside uplifts as-sociated with plasma bubbles. The morphology and char-acteristics of those satellite traces, including the onset time, the drift velocity, the east-west asymmetry, and the seasonal variation, were consistent with a vast number of previous observations. There were, however, quantitative differences between the present results and previous ones, such as in the eastward drift velocity of the irregularities and the large wavelength of the spatial separation of multiple events. In our experiment, satellite traces were detected up to 60◦west of the great circle propagation direction, which enabled us to monitor the onsets of plasma bubbles and, more practically, the onsets of ionospheric scintillations in a wide upstream area of general eastward drift. This is a great advantage for monitoring space weather (which can lead to communica-tion/navigation outages) monitoring. The analysis in this pa-per assumed that the reflection points lay on the geographic equator, which led to ambiguity concerning the estimated drift velocity of plasma bubbles. To overcome this problem, we need to do a propagation experiment between geomag-netically conjugate points using a dedicated transmitter at a fixed frequency throughout the day.
Acknowledgements. Topical Editor M. Pinnock thanks S. Crowley and another referee for their help in evaluating this paper.
References
Argo, P. E. and Kelley, M. C.: Digital ionosonde observations dur-ing equatorial spread F, J. Geophys. Res., 91, 5539–5555, 1986.
Burke, W. J., Huang, C. Y., Gentile, L. C., and Bauer, L.: Seasonal-longitudinal variability of equatorial plasma bubbles, Ann. Geo-phys., 22, 3089–3098, 2004a.
Burke, W. J., Gentile, L. C., Huang, C. Y., Valladares, C. E., and Su, S. Y.: Longitudinal variability of equatorial plasma bub-bles observed by DMSP and ROCSAT-1, J. Geophys. Res., 109, A12301, doi:10.1029/2004JA010583, 2004b.
Fang, D. J. and Liu, C. H.: A morphological study of gigahertz equatorial scintillations in the Asian region, Radio Sci., 18, 241– 252, 1983.
Fejer, B. G. and Kelley, M. C.: Ionospheric irregularities, Rev. Geo-phys. Space Phys., 18, 401–454, 1980.
Fejer, B. G., Kudeki, E., and Farley, D. T.: Equatorial F region zonal plasma drifts, J. Geophys. Res., 90, 12 249–12 255, 1985. Fejer, B. G., de Paula, E. R., Batista, I. S., Bonelli, E., and
Wood-man, R. F.: Equatorial F region vertical plasma drifts during solar maxima, J. Geophys. Res., 94, 12 049–12 054, 1989.
Flaherty, J. P., Kelley, M. C., Seyler, C. E, and Fitzgerald, T. J.: Simultaneous VHF and transequatorial HF observations in the presence of bottomside equatorial spread F, J. Geophys. Res., 101, 26 811–26 818, 1996.
Hawlitschka, S.: Travelling ionospheric disturbances (TIDs) and tides observed by a super-resolution HF direction finding system, J. Atmos. Solar-Terr. Phys., 68, 568–577, 2006.
Heron, M. L.: Recent progress in transequatorial propagation – re-view, J. Atmos. Terr. Phys., 43, 597–606, 1981.
Huang, C. Y., Burke, W. J., Machuzak, J. S., Gentile, L. C., and Sultan, P. J.: Equatorial plasma bubbles observed by DMSP satellites during a full solar cycle: Toward a global climatology, J. Geophys. Res., 107(A12), 1434, doi:10.1029/2002JA009452, 2002.
Immel, T. J., Frey, H. U., Mende, S. B., and Sagawa, E.: Global observations of the zonal drift speed of equatorial ionospheric plasma bubbles, Ann. Geophys., 22, 3099–3107, 2004.
Kelleher, R. F. and R¨ottger, J.: Equatorial spread-F irregularities observed at Nairobi and on the transequatorial path Lindau-Tsumeb, J. Atmos. Terr. Phys., 35, 1207–1211, 1973.
Keskinen, M. J., Ossakow, S. L., and Fejer, B. G.:
Three-dimensional nonlinear evolution of equatorial ionospheric
spread-F bubbles, Geophys. Res. Lett., 30(16), 1855, doi:10.1029/2003GL017418, 2003.
Lin, C. S., Immel, T. J., Yeh, H.-C., Mende, S. B., and Burch, J. L.: Simultaneous observations of equatorial plasma depletion by IM-AGE and ROCSAT-1 satellites, J. Geophys. Res., 110, A06304, doi:10.1029/2004JA010774, 2005.
Maruyama, T. and Matuura, N.: Longitudinal variability of annual changes in activity of equatorial spread F and plasma bubbles, J. Geophys. Res., 89, 10 903–10 912, 1984.
Mendillo, M. and Baumgardner, J.: Airglow characteristics of equa-torial plasma depletions, J. Geophys. Res., 87, 7641–7652, 1982. Paulson, M. R.: Scintillation of VHF/UHF and L band satellite
sig-nals at Guam, Radio Sci., 16, 877–884, 1981.
R¨ottger, J.: Wave-like structures of large-scale equatorial spread-F irregularities, J. Atmos. Terr. Phys., 35, 1195–1206, 1973. R¨ottger, J.: The macro-scale structure of equatorial spread-F
irreg-ularities, J. Atmos. Terr. Phys., 38, 97–101, 1976.
Schmidt, R. O.: Multiple emitter location and signal parameter esti-mation, IEEE Trans. Antennas Propagat., AP-34, 276–280, 1986. Tanohata, K., Kuriki, I., Iguchi, M., Yamashita, K., and Sakamoto, T.: The results of long-term experiment of trans-equatorial VHF wave propagation, Rev. Radio Res. Lab. (in Japanese), 26, 885– 897, 1980.
Tsunoda, R. T. and White, B. R.: On the generation and growth of equatorial backscatter plumes, 1. Wave structure in the bottom-side F layer, J. Geophys. Rs., 86, 3610–3616, 1981.
Tsunoda, R. T.: On the generation and growth of equatorial
backscatter plumes, 2. Structuring of the west walls of up-wellings, J. Geophys. Res., 88, 4869–4874, 1983.
Tsunoda, R. T., Livingston, R. C., McClure, J. P., and Hanson, W. B.: Equatorial plasma bubbles: Vertically elongated wedges from the bottomside F layer, J. Geophys. Res., 87, 9171–9180, 1982.
Weber, E. J., Buchau, J., and Moore, J. G.: Airborne studies of equatorial F layer ionospheric irregularities, J. Geophys. Res., 85, 4631–4641, 1980.
Weber, E. J., Brinton, H. C., Buchau, J., and Moore, J. G.: Coordi-nated airborne and satellite measurements of equatorial plasma depletions, J. Geophys. Res., 87, 10 503–10 513, 1982.
Yokoyama, T., Fukao, S., and Yamamoto, M.: Relationship of the onset of equatorial F region irregularities with the sunset termi-nator observed with the Equatorial Atmosphere Radar, Geophys. Res. Let., 31, L24804, doi:10.1029/2004GL021529, 2004.