TH `
ESE
TH `
ESE
En vue de l’obtention du
DOCTORAT DE L’UNIVERSIT´
E DE TOULOUSE
D´elivr´e par : l’Universit´e Toulouse 3 Paul Sabatier (UT3 Paul Sabatier) Cotutelle internationnale Hanoi Institute of Physics
Pr´esent´ee et soutenue le 01/11/2014 par :
PHAM Tuan Anh
Observations millimetriques/submillimetriques de galaxies lentill´ees gravitationellement `a haut redshift
JURY
M. Peter von BALLMOOS IRAP, Observatoire de
Midi-Pyr´en´ees
Pr´esident
M. Johan RICHARD CRAL, Observatoire de Lyon Rapporteur
M. NGUYEN Quang Rieu LERMA, Observatoire de Paris Rapporteur
M. Fr´ed´eric BOONE IRAP, Observatoire de
Midi-Pyr´en´ees
Directeur de th`ese
M. Pierre DARRIULAT VATLY, Hanoi Directeur de th`ese
M. DINH Van-Trung IOP, Hanoi Examinateur
M. PHAN Bao Ngoc HCMIU, Ho Chi Minh City Invit´e
´
Ecole doctorale et sp´ecialit´e :
SDU2E : Astrophysique, Sciences de l’Espace, Plan´etologie
Unit´e de Recherche :
Institut de Recherche en Astrophysique et Plan´etologie (UMR 5277)
Directeur(s) de Th`ese :
Fr´ed´eric BOONE et Pierre DARRIULAT
Rapporteurs :
ii
Acknowledgements
I express my deep gratitude to my supervisors in Toulouse, Dr. Frédéric Boone, and in Ha Noi, Pr. Pierre Darriulat, for their constant support. In particular, I would like to thank Frédéric for introducing me to this extremely exciting field of astrophysics and for his explaining things to me when I was in Toulouse. This thesis would have not been possible without him. I would like to thank Pierre for his utmost contribution to get me involved in the game, for always beside me to learn together and to help me get through. His un-tired effort is an example for me to pursuit this kind of study.
I thank my colleagues in Ha Noi and in Toulouse for the friendly working atmosphere to which they contribute and their many helpful advices. In particular, I would like to thank Dr. Pham Tuyet Nhung for her patient guidance in data analysis with PAW, for her following my progress and for her encouragement. I am also very grateful to Do Thi Hoai for her contribution to the work on gravitational lensing. I would also like to thank Dr. Pham Ngoc Diep, Dr. Pham Ngoc Dong, Dr. Nguyen Thi Thao, Nguyen Thi Phuong for sharing the same interest, for their encouragements and their help.
On this occasion, I would like to thank Pr. Nguyen Quang Rieu for his encouragement and support to get me involved in the field of radio astronomy. I would like to thank Pr. Dinh Van Trung for his useful comments/suggestions on various occasions in which he took part. I would also like to thank Eric Jullo for his very patient explanations on how to use LENSTOOL properly. I express my gratitude to professors/lecturers to let me take part in wonderful schools about mm radio astronomy in Granada for single dish observation and in Grenobe for interferometer system, in particular to Pr. Frédéric Gueth for clearly explaining how to work in uv plane, to Pr. Axel Weiss for guiding me on how to observe with the IRAM 30m dish, to Dr. Pierre Gratier and Dr. Sebastien Bardeau for their help of using GILDAS.
I am indebted to the French Embassy in Ha Noi for the allocation of a fellowship that made it possible for me to travel to and live in Toulouse during my three four-month stays. Financial and/or material support from the Université Paul Sabatier, the Institute for Nuclear Studies and Technology, NAFOSTED, the World Laboratory, Rencontres du Vietnam and Odon Vallet fellowships is gratefully acknowledged.
On a private side, I express my gratitude to my family for their continuous support and encouragement. They are always behind me in whatever step I make.
iii
Abstract
The study of the formation and evolution of galaxies in the early Universe is one of the most active lines of research in contemporary astrophysics.
One distinguishes between star-forming galaxies − typically blue, dense and dusty spirals including a fast rotating disk of young stars and a halo of low metallicity stars − and star-not-forming galaxies − typically red ellipticals, made of old stars and containing little to no dust. Both types usually have a black hole in their centre, with masses ranging from a few millions to a few billions solar masses, and are contained in large dark matter haloes, the more so the more massive they are. Mergers play an important role in the evolution of structures in the Universe, major mergers between two spirals producing elliptical galaxies.
At large redshifts (z), we observe the early Universe. In addition to star emission in the visible, we learn about the dust content and the Star Formation Rate (SFR) from the Far Infrared (FIR) continuum distribution, about the gas content from molecular lines (mostly CO), about Active Galactic Nuclei (AGN) from the radio and X ray emission of their jets. At all wavelengths, the exploration of the early Universe has recently made spectacular progress. The star formation rate density and stellar mass build-up have been quantified back to 1 Gyr of the Big Bang. The comoving SFR density starts with a steady rise from z~10 to 6 when light from the first galaxies re-ionizes the neutral intergalactic medium. It then peaks at z~3 to 1, in what is known as the epoch of galaxy assembly during which about half of the stars in the present day Universe form. Last comes the order of magnitude decline from z~1 to 0.
The present work studies the host galaxy of a z=2.8 quasar, RX J0911, namely a galaxy having an active black hole in its centre, seen at the epoch of galaxy assembly. It uses data collected at the Plateau de Bure Radio Interferometer at the frequency corresponding to the red-shifted emission of the CO(7-6) molecular rotation line. Observation of the line probes the gas in the galaxy, observation in the continuum probes the dust. The intensity of the line tells us about the size and physical properties of the gas reservoir of the galaxy, its width and profile tell us about its dynamics and therefore kinetic energy content. The intensity of the continuum provides important information on the star formation rate, which is itself associated with the production of dust.
As is often the case with the observation of remote galaxies, RX J0911 is gravitationally lensed by a foreground galaxy, producing four resolved images. At the same time as the large magnification, ~20, offered by gravitational lensing
iv eases considerably the observation of the prominent features of the galaxy, it significantly complicates the interpretation of the data. As usual, large magnifications are obtained when the source is near the lens caustic where the distortion of the image is maximal. This is the case of RX J0911, the host galaxy of which overlaps the lens caustic.
The work is organised in 5 chapters and 4 annexes.
The first chapter starts with a general introduction to the subject covering
the main topics addressed in the thesis: galaxies in the early universe, quasars at high redshift, gravitational lensing and radio interferometry. It borrows much from textbooks, lectures, reviews and encyclopaedia articles. It continues with a review of earlier observations of RX J0911, including Hubble Space Telescope observations of the quasar in the visible and near infrared, X ray data and earlier molecular data (mostly CO). A description of the lens and of the galaxy cluster in which it is contained sets the scene for the gravitational lensing mechanism. The chapter closes with a description of data collection at Plateau de Bure and data reduction from raw data into visibilities in the Fourier plane and sky maps.
The second chapter provides a detailed study of the gravitational lensing
scenario. It makes use of two different lensing potentials (1 and 2) allowing for a comparison between their predictions and for an estimate of the most important systematic uncertainties attached to the results. One of the potentials combines an elliptic lens with an external shear term mimicking the presence of the galaxy cluster and of a small satellite galaxy. Its treatment is fully home made, with a code including the explicit resolution of the lens equation. The other uses a more sophisticated code, available for public use, called LENSTOOL. Instead of using a phenomenological shear term, it describes the lensing effect of the cluster by a fictitious lens located at its centre of mass. As the source is very close, in the sky plane, to the main lensing galaxy, the effect of the cluster is only a perturbation and it is interesting to study how the two approaches differ in their results. The method of resolution of the lens equation is spelled out in detail and particular attention is given to the proximity of the lens caustic. Indeed, the host galaxy of RX J0911 overlaps the lens caustic, implying that part of it gives only two images and the other part four images, with maximal distortion at the boundary. As the caustics obtained from the two lensing potentials differ slightly, so do the distortions imposed on the images, generating a source of systematic uncertainties that is thoroughly explored. General features characteristic of sources located near the lens caustic are described, in particular for quadruply imaged quasars and for what concerns velocity gradients and image brightness ratios.
The third chapter applies what precedes to a model of the host galaxy of
v the uv plane where a more rigorous treatment can be applied. The agreement between observations and model predictions is quantified by the evaluation of a χ2, which is minimized by adjusting the model parameters in order to best fit the data. The reliability of the method is discussed together with a critical evaluation of the sources of uncertainties contributing to the result.
The source size is evaluated using a model of the source brightness including a uniform central region and Gaussian edges, both elliptical with a ratio λ2
between the major and minor axes. The overall size is defined by a parameter ρ, the square root of the mean square radius, and the orientation by a position angle α. Particular cases where the brightness distribution is purely uniform or Gaussian and where the shape is circular have been studied. Both potentials 1 and 2 are used as lens models and the difference between their predictions gives an estimate of systematic uncertainties. The best fit to the line data is given by the following set of parameters: ρ=104±16 mas, λ=1.60+0.35
−0.18 and α=111
o
±9o. The hypothesis of a point source is rejected at the level of 6 standard deviations, that of a circular source at the level of 3.3 standard deviations. This result is consistent with the measured B/A ratio of image brightness. However, including a more precise earlier measurement, B/A=21±1%, implies ρ=120±15 mas. Combining all results together gives ρ=106±15 mas and B/A=0.19±0.01.
Evidence for a velocity gradient on the line has been found at the level of 4.5 standard deviations. While potential 2 produces a best-fit source position closer to the caustic than potential 1 does, it also implies larger magnifications and, as a result, a smaller source size. However, potentials 1 and 2 make remarkably similar predictions in terms of source ellipticity and velocity gradient. Fits performed on the clean and dirty maps have illustrated the difficulties of dealing properly with the noise in such cases and have added further confidence to the results obtained in the uv plane. The best fit to the continuum data, using the same values of λ and α as found on the line, gives ρ=32±16 mas, implying that the source is resolved at the level of only 2 standard deviations.
The fourth chapter gives an interpretation of the above results. It starts
with a general introduction to galaxy formation and evolution, with particular emphasis on recent FIR and CO data.
The line luminosity is obtained from the integrated line flux, Sline∆ν, evaluated on the clean map. A Gaussian fit to the line gives a peak value of 47.6 mJy, a mean velocity of −22±6 kms−1 and a full width at half maximum of 120±14 kms−1 for a continuum level of 4.0±0.5 mJy. The line integrated flux is measured to be 5.0±0.5 Jykms−1 and the continuum 4.4±0.5 mJy. The evaluation of the luminosities is strongly dependent on the values of the magnification adopted as best describing the lensing mechanism. This is by far the main source of
vi uncertainties. Magnifications of 12±4 are retained on the line, 24±10 in the continuum and 26±10 for the quasar point source. The table below summarizes the main properties.
RX J0911 data
Lens potential P1 P2 Retained
Magnification (point source) 17.4 35.9 26±10
Magnification (line) 9.4±0.7 16.0±1.1 12±4 Magnification (continuum) 15.4±2.2 33.9±4.8 24±10 L’CO(7-6) [109K km s–1pc2] 3.9±0.8 2.3±0.5 3.1±1.0 L’CO(1-0) [109K km s–1pc2] 4.9±1.0 2.9±0.6 3.9±1.3 Continuum [mJy] 0.31±0.08 0.14±0.04 0.20±0.09 MH2 [109 MSun] 3.9±0.8 2.3±0.5 3.1±1.0 SFR [MSun/yr] ~360 ~160 ~230
Depletion rate [107 yr] 1.1 1.4 1.3
Dust mass [108 MSun] ~1.3 ~0.6 ~0.8
Mdyn [109 MSun] 4.7±1.4 4.7±1.4 4.7±1.4
ρ (line) [arcsec] 115±13 81±9 106±15
ρ (continuum) [arcsec] 51±15 24±10 39±18
Details of the calculations are given in the first two annexes. The main uncertainty on the gas mass remains the value of the magnification, which is nearly halved when using potential 1 rather than potential 2, meaning twice as high a gas mass. Even so, the molecular gas mass is quite small in comparison with other quasar hosts and lies at the low end of their observed range. Possible biases that might have caused a gross underestimate are thoroughly explored but the low gas mass of RX J0911, when compared with other high-z objects, whether quasar hosts or SMGs, is unescapable. The spectral energy distribution, the knowledge of which is necessary to calculate the star formation rate, is not strongly constrained by available data and its evaluation is accordingly somewhat arbitrary, having to rely on general knowledge obtained from other galaxies to obtain a total FIR luminosity LFIR=320 µ
–1
1011LSun, where µ is the magnification. Similarly, the evaluation of the dust mass from the continuum luminosity is subject to major uncertainties. The RX J0911 star formation efficiency is seen to be on the high side of all galaxies, whether low-z or high-z and both CO and FIR luminosities are at the low end of the high-z population, at the border between high-z and low-z quasar hosts and SMGs. It is as if RX J0911 had exhausted much of its gas after a period of intense star formation.
With respect to other quasar hosts, RX J0911 has an outstandingly small line width. While this observation directly rules out any contribution from important virial dispersion, it suggests that the gas is in the form of a rotating disk
vii seen face on. This is however in contradiction with the elliptic morphology that has been measured, requiring a critical assessment of the uncertainties attached to the associated measurements. Using the full band X-ray luminosity density of RX J0911 that has been measured by Fan et al. 2009 one obtains further evidence for an abnormally low dynamical mass: while both the gas and dynamical masses are low with respect to other quasar hosts, this is not to be blamed on a particularly low black hole mass.
The last chapter summarizes the work and opens a window on the
future.
The detailed study of the host galaxy of a remote quasar, observed at millimetre wavelengths, has illustrated some of the most remarkable properties of far away galaxies and of their evolution in the early Universe when most of the existing stars were being formed. The observation of CO and continuum emissions has taken advantage of the magnification offered by gravitational lensing and of the quality of the Plateau de Bure interferometer in terms of sensitivity and resolution, allowing for resolving the source in space and for a precise measurement of the observed molecular line.
A careful study of the properties of gravitational lensing for sources close to the caustic has shed light on its most remarkable properties et can be used as a guide for future observations of galaxies in similar situations of gravitational optics. The data analysed here have illustrated the complications that result and have made it possible to evaluate the associated sources of uncertainties, in particular concerning the strong dependence of the magnification on the source dimensions.
As the CO(7-6) line stands out clearly above continuum, reliable measurements of the luminosities related to the gas and to the dust have been possible. A detailed study of the images has made it possible to resolve the source in space and, for what concerns the gas volume, to evaluate its morphology – size, ellipticity, position angle – and to provide evidence in favour of a velocity gradient. A remarkable property of the CO(7-6) emission is its extremely narrow line width, implying a small dynamic mass consistent with independent evaluations of the gas and dust masses. The large star formation efficiency suggests that the galaxy has exhausted a large part of its gas reserve following a period of intense star formation and lies now at the boundary between high z and low z quasar hosts.
The recent start-up of ALMA, offering substantially improved performance in terms of sensitivity and resolution with respect to Plateau de Bure, has led us to propose the observation of a quasar host similar to RX J0911,
viii gravitationally lensed into six images with a magnification of order hundred. As explained in the annexes 3 and 4, a resolution of ~50 pc could be reached in only two hours of observation of the CO(9-8) line. The water line could also be detected, offering useful information on the FIR luminosity.
The observation of high z quasar hosts has a rich future in front of it and will undoubtedly significantly contribute to our understanding of the formation and evolution mechanisms of structures in the early Universe. We hope to be able to take an active part in this exploration and make good use of the experience gained in the study of RX J0911.
ix
Résumé
L’étude de la formation et de l’évolution des galaxies dans les premiers temps de l’Univers constitue l’une des voies de recherches les plus actives de l’astrophysique contemporaine.
On a coutume de distinguer les galaxies à fort taux de formation d’étoiles − typiquement des spirales bleues, denses et riches en poussière, comportant un disque d’étoiles jeunes en rotation rapide et un halo d’étoiles de métallicité faible − des galaxies sans formation d’étoiles − typiquement des elliptiques rouges faites d’étoiles anciennes et ne contenant que peu de poussière, voire pas du tout. Les deux familles ont un trou noir à leur centre, de masses allant de quelques millions à quelques milliards de masses solaires, et baignent dans de grands halos de matière noire, d’autant plus grands qu’elles sont plus massives. Les collisions résultant en la réunion de deux galaxies jouent un rôle important dans l’évolution des structures dans l’Univers, les collisions de ce type entre deux spirales massives produisant les galaxies elliptiques.
À grand décalage vers le rouge (z), nous observons l’univers à ses débuts. Outre l’émission stellaire dans le visible, le continu de l’infrarouge lointain nous renseigne sur la quantité de poussière et le taux de formation d’étoiles, les raies moléculaires (essentiellement CO) sur la quantité de gaz. Les émissions X et radio des jets des noyaux galactiques actifs est une source additionnelle d’information. L’exploration de l’Univers à ses débuts a fait récemment des progrès spectaculaires dans tous les domaines de longueur d’onde. La densité du taux de formation d’étoiles et la croissance de la masse stellaire sont maintenant mesurées jusqu’à un milliard d’années après le Big Bang. La première commence par augmenter progressivement entre z~10 et z~6 , époque à laquelle le rayonnement émis par les premières galaxies ré-ionise le milieu interstellaire neutre. Elle atteint ensuite sa valeur maximale à z~3, ce qu’on appelle l’époque d’assemblage des galaxies, lors de laquelle près de la moitié des étoiles existant aujourd’hui se sont formées. La phase finale est une décroissance de près d’un ordre de grandeur entre z~1 et z=0.
La présente étude porte sur la galaxie hôte d’un quasar à z=2.8, RX J0911, abritant par conséquent un trou noir actif en son centre, à l’époque d’assemblage des galaxies. Elle fait usage de données collectées à l’Interféromètre Radio du Plateau de Bure à une fréquence correspondant à l’émission de la raie moléculaire de rotation CO(7-6) décalée vers le rouge par effet Doppler. L’observation de la raie sonde le gaz dans la galaxie, celle du continu sonde la poussière. L’intensité de la raie nous renseigne sur la taille et les propriétés physiques du volume de gaz, sa largeur et son profil sur ses propriétés dynamiques et son contenu énergétique.
x L’intensité du continu fournit des renseignements importants sur le taux de formation d’étoiles qui est étroitement lié a la production de poussière.
Comme c’est souvent le cas pour l’observation de galaxies lointaines, RX J0911 est lentillé gravitationnellement par une galaxie plus proche, avec formation de quatre images séparées. Le grandissement, de l’ordre d’un facteur 20, augmente considérablement la sensibilité du processus de détection mais, en même temps, complique grandement l’interprétation des données. Les grandissements les plus importants sont obtenus lorsque la source est proche de la caustique où la distorsion des images est maximale. Tel est le cas de RX J0911 dont la galaxie hôte chevauche la caustique.
L’ouvrage est construit en cinq chapitres et quatre annexes.
Le premier chapitre débute sur une introduction générale aux sujets traités
dans le corps de la thèse: galaxies lointaines, quasars à haut décalage vers le rouge, lentillage gravitationnel et interférométrie radio. Elle emprunte beaucoup à des ouvrages généraux, des cours, des articles d’encyclopédie et des articles de revue. Sont ensuite passées en revue les observations faites antérieurement sur RX J0911, comprenant celles du quasar dans le visible et l’infrarouge proche avec le Hubble Space Telescope, des données dans le spectre X et des mesures antérieures d’émission moléculaire (essentiellement CO). Suit une description du système de lentillage, la galaxie-lentille et l’amas dont elle fait partie. Le chapitre se termine sur une description de la collection de données au Plateau de Bure et de la réduction des données brutes en un ensemble de visibilités dans le plan de Fourier puis de cartes de brillance dans le ciel.
Le second chapitre présente une étude détaillée du scénario de lentillage
gravitationnel. Il utilise deux potentiels de lentillage distincts (1 et 2) permettant de comparer leurs prédictions et d’obtenir ainsi une estimation des incertitudes systématiques les plus importantes affectant la qualité des résultats. Un des potentiels associe une lentille elliptique à un terme de cisaillement qui rend compte de la présence de l’amas de galaxies et d’une petite galaxie satellite. La résolution de l’équation de lentillage suit une méthode conçue pour le cas présent et utilise un code écrit dans ce but. L’autre potentiel utilise un code plus élaboré, accessible dans le domaine public, LENSTOOL. Son potentiel, au lieu d’utiliser un terme de cisaillement, représente l’effet de l’amas par une source fictive placée au centre de masse. Comme la source est très proche, dans le ciel, de la lentille principale, l’effet de l’amas est une perturbation qu’il est intéressant d’étudier selon ces deux approches distinctes afin d’évaluer de combien leurs prédictions diffèrent. La méthode utilisée pour résoudre l’équation de lentillage est décrite en détail et une attention particulière est réservée aux effets liés à la proximité de la caustique. De fait, la galaxie hôte de RX J0911 chevauche la caustique, ce qui
xi implique qu’une partie de la source donne quatre images, l’autre partie seulement deux, avec distorsion maximale entre les deux. Comme les caustiques associées aux deux potentiels diffèrent légèrement, il en va de même pour les distorsions des images, ce qui crée une source d’incertitudes systématiques qui est étudiée en détail. Des propriétés générales caractéristiques de sources proches de la caustique sont décrites, en particulier dans le cas d’images quadruples et en ce qui concerne les gradients de vitesse et les brillances relatives des images.
Le troisième chapitre est une application des résultats précédents à un
modèle de la galaxie hôte de RX J0911. Bien que faisant parfois usage de cartes célestes, l’essentiel du travail est conduit dans le plan de Fourier où un traitement rigoureux des erreurs est possible. L’accord entre observations et prédictions du modèle est quantifié par l’évaluation d’un chi carré qui est minimisé en ajustant les paramètres du modèle pour reproduire au mieux les données. La fiabilité de la méthode est discutée ainsi qu’une évaluation critique des sources d’incertitudes affectant les résultats.
Les dimensions de la source sont évaluées en utilisant un modèle de sa brillance combinant une zone centrale uniforme et des bords gaussiens, avec une ellipticité mesurée par le rapport λ2 entre le grand et le petit axes. La dimension principale est définie par un paramètre ρ, racine carrée du rayon carré moyen, et son orientation par un angle polaire α. Les cas particuliers où la brillance est purement uniforme ou purement gaussienne, et où la forme de la source est circulaire, font l’objet d’études spécifiques. Les deux potentiels, 1 et 2, sont successivement utilisés dans la modélisation du lentillage et les différences que présentent leurs prédictions permettent d’évaluer les incertitudes systématiques associées. L’ajustement au plus près des paramètres du modèle aux données de la raie moléculaire donne le résultat suivant: ρ=104±16 mas, λ=1.60+0.35
−0.18 et
α=111o
±9o. L’hypothèse d’une source ponctuelle est rejetée au niveau de six déviations standards et celle d’une source circulaire au niveau de 3.3 déviations standards. Ce résultat est en accord avec la mesure des brillances relatives des images. Toutefois, en tenant compte d’une mesure antérieure plus précise de ce rapport, B/A=21±1%, on obtient ρ=120±15 mas. En combinant tous les résultats, on retient ρ=106±15 mas et B/A=0.19±0.01.
La présence d’un gradient de vitesse est avérée au niveau de 4.5 déviations standards. Comme le potentiel 2 prédit une position de la source plus proche de la caustique que le potentiel 1, il implique aussi des grandissements plus importants et par conséquent une dimension plus petite de la source. Par contre, les prédictions des potentiels 1 et 2 en termes d’ellipticité et de gradient de vitesse sont remarquablement semblables. L’ajustement des paramètres du modèle sur les cartes célestes déconvoluées illustre la difficulté de faire un traitement convenable des erreurs dans ce cas et donne une confiance accrue dans la fiabilité des résultats
xii obtenus dans le plan de Fourier. Dans le continu, en utilisant les valeurs de λ et α obtenues pour la raie, on obtient ρ=32±16 mas: la source n’est résolue qu’au niveau de 2 déviations standards.
Le quatrième chapitre offre une interprétation des résultats précédents. Il
débute par une introduction générale aux processus de formation et d’évolution des galaxies, en s’attardant sur les données récentes dans l’infrarouge lointain et en CO millimétrique et submillimétrique.
La luminosité de la raie est obtenue à partir du flux intégré, Sline∆ν, évalué sur la carte céleste déconvoluée. Une description gaussienne de la raie donne une valeur de 47.6 mJy au sommet, une vitesse moyenne de −22±6 kms−1 et une largeur à mi-hauteur de 120±14 kms−1 pour un niveau dans le continu de ~4.0±0.5 mJy. Le flux intégré sur la raie vaut 5.0±0.5 Jykms−1 et pour le continu 4.4±0.5 mJy. L’évaluation des luminosités dépend fortement des valeurs adoptées pour les grandissements censés décrire au mieux le mécanisme de lentillage. C’est là, et de loin, la cause principale d’incertitude. On retient des grandissements de 12±4 pour la raie, 24±10 dans le continu et 26±10 pour la source ponctuelle qu’est le quasar. Le tableau ci-dessous résume les propriétés les plus importantes.
RX J0911 data
Potentiel de lentillage P1 P2 Valeur retenue
Grandissement (source ponctuelle) 17.4 35.9 26±10 Grandissement (raie) 9.4±0.7 16.0±1.1 12±4 Grandissement (continu) 15.4±2.2 33.9±4.8 24±10 L’CO(7-6) [109K km s–1pc2] 3.9±0.8 2.3±0.5 3.1±1.0 L’CO(1-0) [109K km s–1pc2] 4.9±1.0 2.9±0.6 3.9±1.3 Continu [mJy] 0.31±0.08 0.14±0.04 0.20±0.09 MH2 [109 MSun] 3.9±0.8 2.3±0.5 3.1±1.0 SFR [MSun/yr] ~360 ~160 ~230
Taux de déplétion [107 yr] 1.1 1.4 1.3
Masse de poussière [108 MSun] ~1.3 ~0.6 ~0.8 Mdyn [109 MSun] 4.7±1.4 4.7±1.4 4.7±1.4 ρ (raie) [arcsec] 115±13 81±9 106±15 ρ (continu) [arcsec] 51±15 24±10 39±18
Les détails des calculs sont résumés dans les deux premières annexes. L’incertitude dominante sur la masse gazeuse est toujours la valeur adoptée pour le grandissement, presque deux fois plus petit pour le potentiel 1 que pour le potentiel 2, donnant une masse gazeuse deux fois plus grande. Même dans ce cas, la masse moléculaire reste très petite en comparaison avec d’autres galaxies hôtes
xiii de quasars et se tient à l’extrémité inférieure du domaine observé. La présence éventuelle de biais pouvant causer une forte sous-estimation de la masse gazeuse a été explorée mais la basse valeur de la masse gazeuse de la galaxie hôte de RX J0911, comparée à d’autres objets à haut z, galaxies hôtes de quasars ou SMGs, semble inéluctable. La distribution spectrale d’énergie, dont la connaissance est nécessaire au calcul du taux de formation d’étoiles, n’est pas fortement contraint par les données disponibles et son évaluation est par conséquent quelque peu arbitraire: on doit se fier à des propriétés globales obtenues par l’étude d’autres galaxies pour en déduire la luminosité dans l’infrarouge lointain LFIR=320 µ– 1
1011LSun, où µ est le grandissement. Semblablement, l’évaluation de la masse de la poussière à partir de la luminosité dans le continu est sujette à d’importantes incertitudes. L’efficacité du taux de formation d’étoiles de RX J0911 se situe dans la partie haute de celles d’autres galaxies, quelque soit leur décalage vers le rouge, et les luminosités dans l’infrarouge lointain et en CO se situent dans la partie basse de la population des galaxies lointaines, à la limite entre les SMGs et les galaxies hôtes de quasars, quelque soit la valeur de z.
En comparaison avec d’autres galaxies hôtes de quasars, RX J0911 a une latgeur de raie anormalement faible. Cette observation exclut d’emblée une contribution importante de dispersion virielle et suggère que le gaz se présente sous la forme d’un disque perpendiculaire à la ligne de vue, ce qui serait en contradiction apparente avec la mesure d’ellipticité décrite plus haut, et ce malgré l’étude critique qui a été faite des incertitudes attachées à cette mesure. En se servant de la densité de luminosité mesurée sur l’ensemble de la bande X de RX J0911, mesurée par Fan et al. 2009, on obtient une autre évidence en faveur d’une masse dynamique anormalement basse: s’il est vrai que la masse gazeuse et la masse dynamique sont faibles par rapport à celles d’autres galaxies hôtes de quasars, ce n’est pas le résultat d’une masse de trou noir particulièrement basse.
Le dernier chapitre résume l’ensemble et ouvre une fenêtre sur l’avenir.
Nous en reproduisons l’essentiel ci-dessous.
L’étude détaillée de la galaxie hôte d’un quasar distant, observée en longueurs d’ondes millimétriques, a permis d’illustrer quelques unes des propriétés les plus remarquables des galaxies lointaines et de leur évolution au début de l’histoire de l’Univers, à l’époque où la majorité des étoiles existantes se sont formées. L’observation de l’émission en CO et dans le continu a bénéficié du grandissement offert par le lentillage gravitationnel et de la qualité de l’interféromètre du Plateau de Bure en termes de sensibilité et de résolution qui a permis de résoudre la source dans l’espace et de mesurer avec précision la largeur de la raie moléculaire observée.
xiv Une étude minutieuse des propriétés du lentillage gravitationnel pour des sources proches de la caustique a permis de mettre en lumière ses propriétés les plus remarquables et pourra servir de guide pour des observations futures de galaxies placées dans des situations similaires d’optique gravitationnelle. Les données analysées ici ont permis d’illustrer les complications qui en résultent et d’en évaluer les sources d’incertitudes, en particulier en ce qui concerne la forte dépendance du grandissement sur les dimensions de la source.
Comme la raie d’émission CO(7-6) sort clairement du continu, il a été possible de mesurer de façon fiable les luminosités associées à la masse gazeuse et à la poussière. Une étude détaillée des images a permis de résoudre la source dans l’espace et, en ce qui concerne le volume gazeux, d’en déterminer la morphologie – taille, ellipticité, orientation – et de mettre en évidence la présence d’un gradient de vitesse. Une propriété remarquable de l’émission en CO(7-6) est l’extrême étroitesse de la raie, impliquant une faible masse dynamique en accord avec des évaluations indépendantes de la masse gazeuse et de celle de la poussière. La valeur élevée de l’efficacité de la formation d’étoiles suggère que la galaxie a dépensé une grande partie de sa réserve de gaz à la suite d’une période d’intense formation d’étoiles et se situe maintenant entre les galaxies hôtes de quasars à haut décalage vers le rouge et celles à faible décalage vers le rouge.
Le récent démarrage d’ALMA, offrant une qualité accrue en termes de résolution et de sensibilité par rapport au Plateau de Bure, nous a encouragés à y proposer l’observation de la galaxie hôte d’un quasar semblable à RX J0911, lentillé en six images avec un grandissement de l’ordre de la centaine. Comme expliqué en annexe, on pourrait atteindre une résolution de ~50 pc en seulement deux heures d’observation de la raie d’émission CO(9-8). La raie de l’eau pourrait aussi être détectée, donnant des renseignements utiles sur la luminosité dans l’infrarouge lointain.
L’observation de galaxies hôtes de quasars à fort décalage vers le rouge a un avenir riche et contribuera sans aucun doute largement à notre compréhension des mécanismes de formation et d’évolution des structures dans l’Univers à ses débuts. Nous avons l’espoir de pouvoir continuer à prendre une part active à ces explorations et à y faire usage de l’expérience acquise dans l’étude de RX J0911.
xv
Tóm tắt
Nghiên cứu sự hình thành và tiến hóa của các thiên hà thời kì đầu vũ trụ là một trong những hướng nghiên cứu năng động nhất của vật lý thiên văn đương
đại.
Có hai nhóm các thiên hà: một nhóm gồm các thiên hà đang hình thành sao và nhóm kia gồm các thiên hà không hình thành sao. Nhóm các thiên hà hình thành sao thường xanh, đậm đặc và có cấu trúc bụi xoắn ốc bao gồm một đĩa các ngôi sao mới đang quay và một quầng các ngôi sao có ít bạn đồng hành. Nhóm các thiên hà không hình sao thường là các thiên hà dạng elip đỏ, gồm các ngôi sao già và bao gồm rất ít hoặc không bụi. Cả hai nhóm loại thiên hà này thường gồm một hố đen ở tâm của chúng với khối lượng từ vài triệu tới và tỉ lần khối lượng mặt trời. Chúng nằm trong quầng vật chất tối lớn, khối lượng của chúng tỉ lệ với kích cỡ của quầng vật chất đó. Sự sáp nhập các thiên hà đóng vai trò quan trọng trong sự tiến hóa cấu trúc của vũ trụ, các vụ sáp nhập lớn giữa hai thiên hà xoắn ốc tạo nên thiên hà elip.
Với dịch chuyển đỏ lớn, chúng ta đang quan sát thời kì đầu của vũ trụ. Cùng với những thông tin về sao ở vùng nhìn thấy, chúng ta có thể tìm hiểu về thành phần bụi và tốc độ hình thành sao (Star Formation Rate) từ các bức xạ liên tục hồng ngoại (FIR), về thành phần khí (molecular gas) từ các vạch phổ phân tử (phần lớn là từ CO), về các thiên hà tâm hoạt động (Active Galactic Nuclei, AGN) từ bức xạ vô tuyến và tia X từ jets của chúng. Sự khám phá vũ trụ ở tất cả các bước sóng gần đây đã đạt được những tiến bộ ngoạn mục. Mật độ tốc độ hình thành sao (commoving SFR density) và quá trình tạo nên khối lượng của sao đã
được xác định tới thời điểm 1 tỷ năm sau Big Bang. Mật độ tốc độ hình thành sao
tăng ổn định trong khoảng z~10 tới 6 khi ánh sáng từ các thiên hà đầu tiên ion hóa (re-ionizes) môi trường trung hòa (về điện) giữa các thiên hà. Nó đạt đỉnh ở z~3 tới 1, thời kì các thiên hà tập hợp (epoch of galaxy assembly), thời mà một nửa các ngôi sao hiện nay trong vũ trụ được hình thành. Tốc độ hình thành sao trong giai
đoạn cuối giảm khoảng 10 lần với z~1 tới 0.
Luận văn tập trung vào nghiên cứu thiên hà chứa quasar, RX J0911, với z=2.8, chứa một lỗ đen hoạt động ở tâm của nó ở thời kì các thiên hà tập hợp. Nghiên cứu này sử dụng dữ liệu từ hệ thống kính thiên văn giao thoa Plateau de Bure ở tần số tương ứng với dịch chuyển đỏ của bức xạ vạch CO(7-6). Quan sát với vạch phổ cung cấp các thông tin về phân tử khí trong thiên hà, trong khi đó phổ liên tục cho các thông tin về bụi. Cường độ của vạch phổ cho biết kích thước và các tính chất vật lý của đám khí phân tử, độ rộng và đặc trưng của vạch phổ cho biết động học và thành phần động năng của đám khí. Cường độ phổ liên tục cho biết tốc độ hình thành sao, liên quan trực tiếp tới sự phát bức xạ của bụi.
xvi RX J0911 được quan sát qua bốn ảnh nhờ hiệu ứng thấu kính hấp dẫn bởi một thiên hà phía trước, điều cũng thường xảy ra khi quan sát các thiên hà ở xa. Lợi thế về tín hiệu được khuếch đại khoảng 20 lần cho phép tìm ra những tính chất của thiên hà nhưng hiệu ứng này cũng gây biến dạng nó làm tăng độ khó trong việc diễn giải dữ liệu sau đó. Thông thường với hệ số khuếch đại lớn thì vị trí của nguồn gần với đường caustic của thấu kính nơi biến dạng là lớn nhất. Đây chính là trường hợp của RX J0911, thiên hà chứa nó bao phủ lên đường caustic.
Nội dung luận văn được trình bày thành 5 chương và 4 phụ lục.
Chương đầu tiên giới thiệu chung các đối tượng chính được đề cập trong
luận án: các thiên hà trong vũ trụ sơ khai, các quasar với độ dịch chuyển đỏ cao, thấu kính hấp dẫn và giao thoa vô tuyến. Phần này nội dung trình bày được lấy từ các sách giáo khoa, bài giảng, các bài tổng hợp trong ngành liên quan. Các kết quả quan sát của RX J0911 cũng được trình bày bao gồm: các quan sát bởi kính viễn vọng Hubble ở vùng nhìn thấy và hồng ngoại, dữ liệu X ray và dữ liệu về vạch phân tử (chủ yếu là CO). Mô tả về thấu kính, các cụm thiên hà và cơ chế thấu kính hấp dẫn. Phần cuối chương mô tả về dữ liệu đo đạc bởi Plateau de Bure và cách xử lý từ dữ liệu thô tới visibilities trong mặt phẳng Fourier và mặt phẳng ảnh (sky map).
Chương thứ hai tập trung nghiên cứu chi tiết các kịch bản thấu kính hấp
dẫn. Chương này trình bày việc sử dụng hai thế thấu kính khác nhau (1 và 2) cho phép so sánh các kết quả giữa chúng và ước tính sai số hệ thống quan trọng nhất gắn liền với kết quả. Một thế năng kết hợp một thấu kính dạng elip với một external shear đại diện cho đóng góp của cụm các thiên hà và thiên hà vệ tinh nhỏ. Nghiên cứu với thế này là hoàn toàn do chúng tôi phát triển bằng cách giải tường minh phương trình thấu kính. Thế còn lại sử dụng một công cụ phức tạp hơn, gọi là LENSTOOL. Thay vì sử dụng external shear, nó mô tả các hiệu ứng thấu kính của cụm các thiên hà bởi một thấu kính hư cấu nằm ở tâm của chúng. Vị trí của nguồn ở mặt phẳng sky plane rất gần với thiên hà đóng vai trò thấu kính chính nên hiệu ứng gây bởi cụm các thiên hà chỉ đóng vai trò nhiễu loạn. Chúng tôi so sánh sự khác biệt kết quả từ hai phương pháp tiếp cận này. Phương pháp giải tường minh phương trình thấu kính được nêu ra một cách chi tiết và chú ý đặc biệt tới vùng gần đường caustic. Thiên hà chứa quasar RX J0911 bao phủ lên đường caustic, một phần của nó cho hai hình ảnh và một phần cho phần bốn ảnh khác, với sự biến dạng tối đa ở ranh giới. Các đường caustic ở hai thế khác nhau đôi chút gây ra các biến dạng khác nhau đối với các ảnh, tạo nên một sai số hệ thống. Chúng tôi khai thác triệt để sai số này cho các kết quả cuối cùng. Chúng tôi mô tả các đặc điểm chung của nguồn gần đường caustic đặc biệt là cho trường hợp quasar bốn ảnh và những vấn đề liên quan tới sự thay đổi vận tốc (velocity gradient) và độ sáng tỉ đối giữa các ảnh.
xvii
Chương thứ ba áp dụng kiến thức về thấu kính hấp dẫn từ chương trước để
xây dựng mô hình cho thiên hà RX J0911. Hầu hết các công việc được thực hiện trong mặt phẳng uv nơi các phép đo là độc lập. Chúng tôi sử dụng χ2 để đánh giá sự phù hợp giữa kết quả quan sát và mô hình dự báo bằng cách điều chỉnh các thông số mô hình để phù hợp tốt nhất với các dữ liệu đo đạc. Chúng tôi cũng thảo luận độ tin cậy của phương pháp cùng với đánh giá các nguồn sai số đóng góp vào kết quả.
Kích thước nguồn được đánh giá bằng cách sử dụng một mô hình phân bố
độ sáng với khu vực trung tâm đồng nhất (Uniform) và Gaussian ngoài cạnh, cả
hai đều là hình elip với λ2 là tỷ lệ giữa các bán trục lớn và bán trục nhỏ. Kích thước tổng thể được xác định bằng tham số ρ, căn bậc hai của trung bình bán kính bình phương, và định hướng bởi góc α (position angle). Chúng tôi cũng nghiên cứu cho trường hợp đặc biệt khi sự phân bố độ sáng là hoàn toàn đồng nhất hoặc Gaussian và hình dạng nguồn là hình tròn. Cả hai thế 1 và 2 được sử dụng làm thấu kính và sự khác biệt giữa kết quả giữa chúng được dùng để ước tính sai số hệ thống. Kết quả khớp hàm tốt nhất cho các thông số như sau: ρ=104±16 mas, λ=1.60+0.35
−0.18 và α=111
o
±9o. Giả thuyết về một nguồn điểm bị loại trừ tới 6 độ lệch chuẩn, với nguồn tròn là 3,3 độ lệch chuẩn. Kết quả này phù hợp với phép đo về tỉ số cường độ sáng B/A. Nếu kết hợp thêm phép đo chính xác hơn, B/A = 21±1% thì ρ = 120±15 mas. Kết hợp tất cả các kết quả lại với nhau cho ρ = 106±15 mas và B/A = 0.19 ± 0.01.
Chúng tôi tìm thấy bằng chứng về sự thay đổi vận tốc (velocity gradient)
đối với vạch phổ ở mức độ 4.5 độ lệch chuẩn. Thế 2 cho vị trí khớp hàm tốt nhất
của nguồn gần đường caustic hơn thế 1 (hệ số khuếch đại của thế 2 lớn hơn thế 1) do đó kích thước nguồn cho bởi thế 2 nhỏ hơn thế 1. Tuy nhiên, cả thế 1 và 2 đưa ra dự đoán tương tự đáng kể về độ elip của nguồn và velocity gradient. Các phép khớp hàm thực hiện trên cả ảnh bẩn (dirty map) và ảnh sạch (clean map) minh họa những khó khăn khi xử lý với nhiễu (noise) trong trường hợp này và củng cố thêm
độ tin cậy của các kết quả thu được trên mặt phẳng uv. Kết quả khớp hàm tốt nhất
cho dữ liệu liên tục, sử dụng cùng giá trị λ và α từ phổ vạch cho ρ=32±16 mas; nguồn được phân giải chỉ ở mức 2 độ lệch chuẩn.
Chương thứ tư dành cho diễn giải kết quả trên. Chương này bắt đầu bằng
giới thiệu chung về hình thành các thiên hà và sự tiến hóa, với sự nhấn mạnh đặc biệt vào các dữ liệu FIR và CO gần đây.
Độ trưng vạch phổ thu được từ thông lượng tổng đo trên clean map Sline∆ν.
Kết quả khớp hàm Gausian cho vạch phổ cho kết quả giá trị đỉnh phổ là 47.6 mJy, vận tốc trung bình (mean velocity) −22±6 kms−1 và độ rộng tại nửa chiều cao đỉnh (full width at half maximum) 120±14 kms−1; cho phổ liên tục ~4.0±0.5 mJy. Thông lượng tổng hợp đo được với vạch phổ 5.0±0.5 Jykms−1 và với phổ liên tục là 4.4±0.5 mJy. Việc đánh giá độ trưng phụ thuộc rất nhiều vào giá trị của hệ số
xviii khuếch đại nhận được từ các mô hình thấu kính. Đây là nguồn sai số quan trọng nhất. Hệ số khuếch đại được sử dụng cho vạch phổ là 12±4 cho phổ liên tục là 24±10 và cho nguồn điểm quasar là 26±10. Bảng dưới đây tóm tắt các tính chất chính:
RX J0911 data
Thế hấp dẫn P1 P2 Kết quả
Hệ số khuếch đại (nguồn điểm) 17.4 35.9 26±10
Hệ số khuếch đại (vạch) 9.4±0.7 16.0±1.1 12±4
Hệ số khuếch đại (liên tục) 15.4±2.2 33.9±4.8 24±10
L’CO(7-6) [109K km s–1pc2] 3.9±0.8 2.3±0.5 3.1±1.0 L’CO(1-0) [109K km s–1pc2] 4.9±1.0 2.9±0.6 3.9±1.3 Thông lượng liên tục [mJy] 0.31±0.08 0.14±0.04 0.20±0.09 MH2 [109 MSun] 3.9±0.8 2.3±0.5 3.1±1.0 SFR [MSun/yr] ~360 ~160 ~230 Tốc độ tiêu thụ [107 yr] 1.1 1.4 1.3
Khối lượng bụi [108 MSun] ~1.3 ~0.6 ~0.8
Mdyn [109 MSun] 4.7±1.4 4.7±1.4 4.7±1.4
ρ (vạch) [arcsec] 115±13 81±9 106±15
ρ (liên tục) [arcsec] 51±15 24±10 39±18
Các tính toán chi tiết được trình bày trong hai phụ lục đầu tiên. Sai số chính trong việc xác định khối lượng khí vẫn là do giá trị của hệ số khuếch đại, bằng một nửa khi sử dụng thế 1 so với thế 2, nghĩa là khối lượng khí 2 lần lớn hơn khi dùng thế 1 so với thế 2. Mặc dù vậy, khối lượng phân tử khí là khá nhỏ so với các thiên hà chứa quasar khác và nằm ở vùng phía dưới của các quasar đã được quan sát. Những sai sót (bias) có thể mắc phải trong việc đánh giá thấp khối lượng nói trên
đều được cân nhắc, khối lượng thấp này càng được củng cố khi so sánh với các đối tượng có độ dịch chuyển đỏ cao khác như các thiên hà chứa quasar hay các
SMGs. Sự phân bố phổ năng lượng, dùng để tính tốc độ hình thành sao, không
được ràng buộc chặt chẽ từ những dữ liệu đã có nên sự đánh giá có phần tùy ý ;
dựa trên hiểu biết từ các thiên hà khác chúng tôi đo được LFIR=320 µ –1
1011LSun, trong đó µ là hệ số khuếch đại bởi thấu kính. Tương tự, đánh giá về khối lượng bụi từ bức xạ liên tục cũng có sai số lớn. Hiệu suất hình thành sao (star formation efficiency) của thiên hà RX J0911 nằm ở phía trên của tất cả các thiên hà khác, kể cả các thiên hà có độ dịch chuyển đỏ thấp hoặc cao. Độ trưng CO và FIR của nó nằm ở ngưỡng dưới của các thiên hà có độ dịch chuyển đỏ cao, nằm ở ranh giới giữa thiên hà chứa quasar có độ dịch chuyển đỏ cao và thấp. Điều này gợi ý rằng thiên hà RX J0911 tiêu thụ phần lớn đám mây phân tử khí của nó sau một giai
xix So với các thiên hà chứa quasar khác, RX J0911 có độ rộng vạch phổ nhỏ
đáng chú ý. Như vậy có thể đám mây phân tử khí nằm trong một cái đĩa đang quay
có trục quay trùng với hướng nhìn. Tuy nhiên điều này lại mâu thuẫn với tính chất elip của nguồn đã đo được, do đó cần phải đánh giá cẩn trọng hơn về sai số của phép đo. Sử dụng kết quả đo độ trưng X-ray của RX J0911 bởi Fan và cộng sự năm 2009 chúng tôi nhận được bằng chứng củng cố thêm về khối lượng động học (dynamical mas) của nó nhỏ bất thường. Khi cả khối lượng đám mây khí và khối lượng động học nhỏ so với các thiên hà chứa quasar khác thì vấn đề không chỉ nằm ở khối lượng của hố đen ở tâm thiên hà này nhỏ.
Chương cuối tóm tắt lại nội dung công việc đã thực hiện và nêu lên hướng
nghiên cứu sau đó.
Nghiên cứu chi tiết về một thiên hà chứa quasar ở xa ở vùng bước sóng mm
đã minh họa một số thuộc tính đáng chú ý nhất của các thiên hà ở xa và sự tiến hóa
của chúng trong vũ trụ sơ khai khi hầu hết các ngôi sao hiện nay được hình thành. Nhờ hiệu ứng thấu kính hấp dẫn đã khuếch đại tín hiệu, độ nhạy và độ phân giải cao của hệ thống kính giao thoa Plateau de Bure đã quan sát được bức xạ vạch phổ CO và phổ liên tục để từ đó có thể phân giải được kích thước nguồn phát.
Nghiên cứu tỉ mỉ các tính chất của thấu kính hấp dẫn cho nguồn gần đường caustic đã làm sáng tỏ tính chất đáng chú ý nhất của nó và có thể áp dụng cho các quan sát sau này của các thiên hà trong các tình huống tương tự. Xử lý dữ liệu ở
đây đã minh họa những phức tạp của vấn đề và đánh giá được các nguồn sai số, đặc biệt là sự phụ thuộc mạnh của hệ số khuếch đại vào kích thước của nguồn.
Vạch phổ CO(7-6) được phân biệt rõ ràng trên một nền phổ liên tục nên có thể tin cậy các phép đo độ trưng liên quan tới đám mây phân tử khí và bụi. Nghiên cứu đã chỉ ra có thể phân giải được nguồn phát và hình thái của nó như kích thước,
độ elip, góc định hướng, và cung cấp bằng chứng về velocity gradient. Độ rộng
vạch phổ CO(7-6) rất hẹp gợi ý khối lượng động học đám mây nhỏ phù hợp với khối lượng đám mây khí và bụi được xác định một cách độc lập. Hiệu suất hình thành sao lớn ngụ ý rằng thiên hà này đã tiêu thụ phần lớn đám mây khí trong một giai đoạn hình thành sao ngắn nhưng có cường độ lớn; nó nằm ở ranh giới giữa các thiên hà chứa quasar có độ dịch chuyển đỏ cao và thấp.
Đài thiên văn ALMA còn có độ nhạy và độ phân giải cao hơn so với
Plateau de Bure nên chúng tôi đề xuất quan sát một thiên hà chứa quasar tương tự như thiên hà RX J0911. Nó có 6 ảnh gây bởi hiệu ứng thấu kính hấp dẫn với hệ số khuếch đại khoảng 100. Như được trình bày trong phụ lục 3 và 4, chúng tôi có thể
đạt tới độ phân giải cỡ 50 pc chỉ với 2 giờ quan sát ở vạch CO(9-8). Chúng tôi
cũng chỉ ra khả năng có thể phát hiện một vạch phổ của phân tử nước cung cấp các thông tin hữu ích về độ trưng vùng hồng ngoại FIR.
xx Những quan sát về các thiên hà chứa quasar ở xa chắc chắn rất triển vọng và sẽ có đóng góp to lớn trong việc tìm hiểu cơ chế sự hình thành và tiến hóa của các cấu trúc thời kì vũ trụ sơ khai. Chúng tôi hy vọng có thể tham gia vào hành trình khám phá này dựa trên những kinh nghiệm thu được từ việc nghiên cứu thiên hà RX J0911.
xxi
TABLE OF CONTENT
1.1 Generalities ... 1
1.1.1 Galaxies in the early universe ... 1
1.1.2 Quasars at high redshifts ... 3
1.1.3 Gravitational lensing ... 7
1.1.4 Radio interferometry ... 12
1.2 RX J0911: early observations ... 15
1.2.1 Quasar first observations ... 15
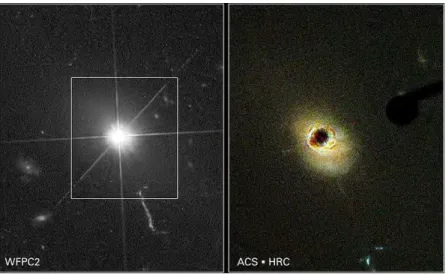
1.2.2 HST images, strong lensing and the cluster lens ... 18
1.2.3 X-ray data and time delay ... 21
1.2.4 CO and other molecular data ... 22
1.3 RX J0911: PdBI observations in CO(7-6) ... 25
1.3.1 Antenna configuration and data taking conditions ... 25
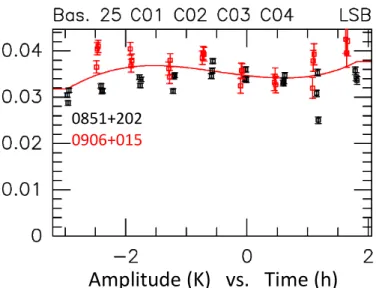
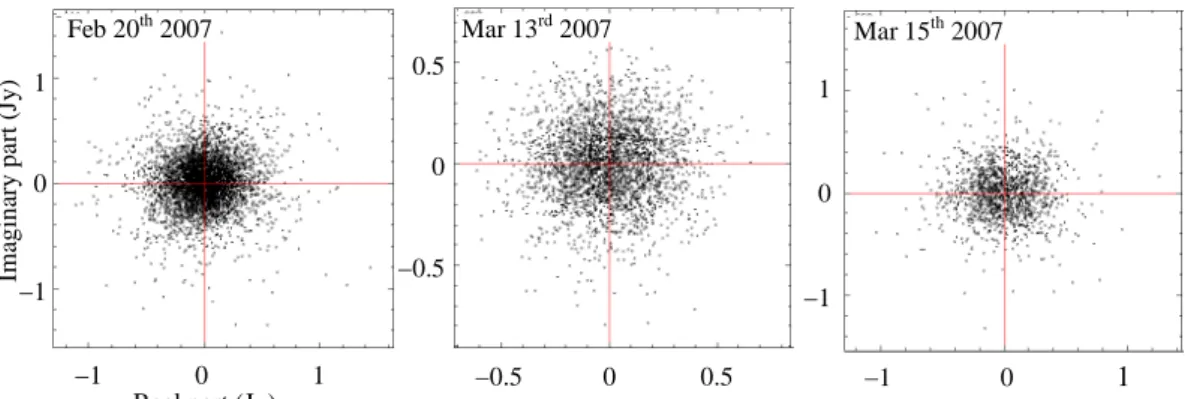
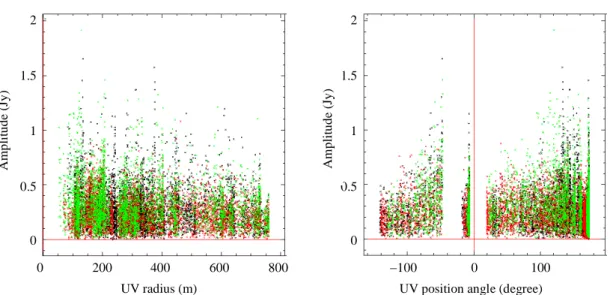
1.3.2 Calibration and noise ... 25
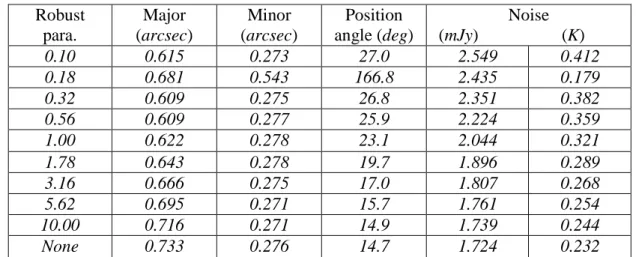
1.3.3 Mapping and deconvolution ... 29
2.1 Introduction ... 34
2.2 Strong lensing: a reminder ... 34
2.2.1 General formalism ... 34
2.2.2 Extended sources ... 35
2.3 Solving the lens equation: a simple example ... 39
2.4 Vicinity of the caustic and critical curve ... 51
2.5 QSO RX J0911: lensing the point source ... 53
2.5.1 Introduction ... 53
2.5.2 Solving the lens equation using potential 1 ... 54
2.5.3 Solving the lens equation using potential 2 ... 58
2.6 QSO RX J0911: lensing the extended source ... 59
2.6.1 Using potential 1 ... 59
2.6.2 Using potential 2 ... 61
2.6.3 Comparing the lensing properties of potentials 1 and 2 ... 64
2.6.4 Comments on the relative merits of potentials 1 and 2 ... 68
2.7 Additional comments ... 69
2.7.1 B/A brightness ratio ... 69
Acknowledgements ... ii
Abstract ... iii
Résumé ... ix
Tóm tắt ... xv
List of Figures ... xxiii
List of Tables ... xxvi
List of Abbreviations ... xxvii
1. Introduction ... 1
xxii 2.7.2 General case of quadruply imaged quasars ... 70 2.7.3 Velocity gradient... 72 2.8 Summary and conclusion ... 73 3.1 Introduction ... 74 3.2 Astrometry ... 74 3.3 Effects contributing to χ2 ... 76 3.4 Source size ... 81 3.5 Source ellipticity ... 84 3.6 B/A brightness ratio ... 89 3.7 Velocity gradient ... 90 3.8 Continuum ... 92 3.9 Fitting the clean map ... 93 3.10 Fitting the dirty map... 96 3.11 Summary and conclusion ... 99 4.1 Galaxy formation and evolution: an introduction ... 100 4.1.1 Generalities ... 100 4.1.2 Recent Far Infrared (FIR) data from distant galaxies ... 105 4.1.3 Recent CO data from distant galaxies ... 108 4.2 RX J0911: line luminosity ... 110 4.3 RX J0911: dust luminosity ... 115 4.4 RX J0911: line width ... 117
A1. Line emission ... 129 A2. Dust emission ... 131 A3. Selection of a candidate for new observations: basic material ... 135 A4. Proposal for observation at ALMA ... 141 3. Modelling the host galaxy of QSO RX J0911 ... 74
4. Interpretation of the results ... 100
5. Summary and perspectives ... 121 References ... 123 Appendices ... 129
xxiii
List of Figures
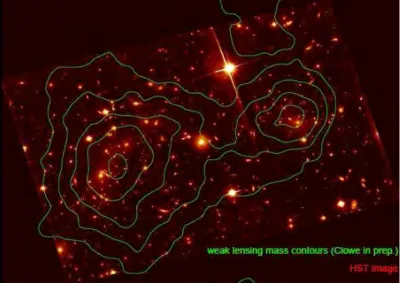
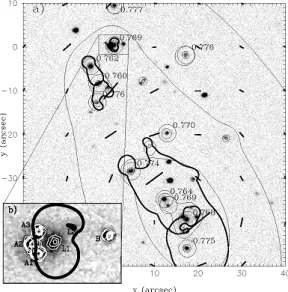
Figure 1.1 A typical low z molecular spectrum ... 2 Figure 1.2. Schematic of an active galactic nucleus & VLA radio image of Cyg A ... 4 Figure 1.3 HST image of the nearby quasar 3C 273... 5 Figure 1.4 X-ray image of PKS 1127-145 & Infrared image of a quasar-starburst pair ... 5 Figure 1.5 Abell 2218 Cluster ... 8 Figure 1.6 Image of the Bullet Cluster from the Hubble Space Telescope. ... 9 Figure 1.7 Einstein rings in several cases & a collection of Einstein rings ... 10 Figure 1.8 Examples of multiple images. ... 10 Figure 1.9 Typical quadruply imaged quasars. ... 11 Figure 1.10 Image configuration in the case of QSO RX J0911. ... 11 Figure 1.11 Plateau de Bure Interferometer ... 12 Figure 1.12 Schematics of the signals on-line treatment from a pair of antennas ... 14 Figure 1.13 High resolution images of RX J0911 ... 16 Figure 1.14 First evidence for the nearby lens cluster given by Burud et al. (1998).. ... 17 Figure 1.15a The RX J0911 lensing cluster as studied by Kneib et al. (2000) ... 19 Figure 1.15b The RX J0911 lensing morphology used by Kneib et al. (2000) ... 19 Figure 1.16 CASTLES consortium HST images of RX J0911 ... 20 Figure 1.17 Time dependence of X-ray fluxes& combined light curve of RX J0911 ... 21 Figure 1.18 RX J0911 image from EVLA & the CO(1-0) line ... 22 Figure 1.19 PdBI map of RX J0911 & 3.6 GHz spectrum of image A ... 23 Figure 1.20 Comparison of the CO(7-6) & CI(2-1) ... 23 Figure 1.21 Modelled SEDs for RX J0911. ... 24 Figure 1.22 (u,v) coverage for the RX J0911 data collection. ... 26 Figure 1.23 Amplitude calibration of one of the 15 baselines ... 27 Figure 1.24 Phase calibration for one of the 15 baselines. ... 27 Figure 1.25 RF passband calibration of one of the 15 baselines ... 28 Figure 1.26 Calibrated visibilities in the complex plane ... 28 Figure 1.27 Visibility amplitude versus (u,v) radius and (u,v) azimuth ... 29 Figure 1.28 Dirty beams . ... 30 Figure 1.29 Dirty maps for three different weightings. ... 31 Figure 1.30 Clean maps and residuals for two different stopping parameters ... 32 Figure 1.31 Clean maps for different weightings and different frequency intervals. ... 33 Figure 2.1 Schematic geometry, coordinates definition & isotropic potential imaging ... 36 Figure 2.2 Dependence of the image positions & morphology on the source position .... 37 Figure 2.3 Image appearances for the same potential & source size as in Figure 2.2 ... 38 Figure 2.4 Critical curve (black) and caustic (red) for γ0=0.25 and r0=1. ... 40
Figure 2.5 Dependence of f (γ0=0.25 & r0=1) & r1, r2, r3, r4 (rs=0.2) on φ ... 42
Figure 2.6 Dependence of f (γ0=0.25 & r0=1) & r1, r2, r3, r4 (rs=0.4) on φ ... 43
Figure 2.7 Same as Figures 2.5 & 2.6 (rs=0.2808), zoomed on the transition region ... 44 Figure 2.8 Dependence on φ of r1, r2, M1, M2 for rs=0.2 ... 45
Figure 2.9 Dependence on φ of r3, r4, M3, M4 for rs=0.2. ... 46
Figure 2.10 Dependence on φ of r1, r2, M1, M2 for rs=0.4. ... 47
xxiv Figure 2.12 Dependence on φ of r1, r2, M1, M2 for rs=0.2808.. ... 49
Figure 2.13 Dependence on φ of r3, r4, M3, M4 for rs=0.2808 ... 50
Figure 2.14 Magnification of images close to the caustic as a function of rs & φ ... 52
Figure 2.15 Source scan of the line φs=15o in steps of 0.0005 r0 starting at 0.25 r0 ... 52
Figure 2.16 Values of gi & gi+1 whenever gi has a different sign from gi+1 ... 55
Figure 2.17 Distributions of |r1−r2| & |r3−r4|. ... 55
Figure 2.18 Distribution of |r1−r2| and of |r3−r4| ... 56
Figure 2.19 Image positions using potential 1 & map of images for point sources ... 57 Figure 2.20 The χ2 distribution of the match between the HST images & potential 1. .... 57 Figure 2.21 Positions of images close to the critical curve... 60 Figure 2.22 Histograms of distances which images move in the cell-splitting process ... 60 Figure 2.23 Histograms of differences in magnifications in the cell-splitting process .... 61 Figure 2.24 Positions of images (using potential 1) close to the critical curve. ... 61 Figure 2.25 Distribution of the number of images produced by LENSTOOL. ... 62 Figure 2.26 Positions of sources (using LENSTOOL) producing either 3 or 5 images ... 62 Figure 2.27 Evolution of images obtained using LENSTOOL for a source scan ... 63 Figure 2.28 Distribution of the positions adopted for the A images. ... 64 Figure 2.29 Source positions which two potentials have a different number of images .. 65 Figure 2.30 Distributions of the mean distance ∆xy and of the image magnifications ∆M 65
Figure 2.31 χ2 distributions to the HST images predicted by potential 1& 2 ... 66 Figure 2.32 Distributions of the image magnifications (disk radius 200 mas). ... 66 Figure 2.33 Image densities for various disk sources ... 67 Figure 2.34 Image brightness distributions in radius & in polar angle ... 67 Figure 2.35 Dependence of the B/A brightness ratio on the source radius... 68 Figure 2.36 Distribution of the magnifications for the three A images & image B ... 70 Figure 2.37 Typical quadruply imaged quasars (Saha & Williams classification)... 71 Figure 2.38 A images of a split source having Rs=0.15” ... 72
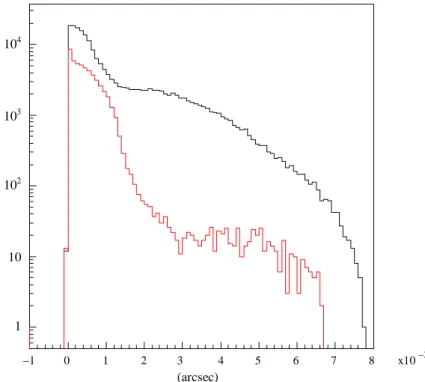
Figure 3.1 Sky map of the χ2 distribution for a uniform disk using potential 1... 75 Figure 3.2 RX J0911 data in term of visibility ... 78 Figure 3.3 Source map of χ2 using a common and constant weight (σ =0.1082).. ... 79 Figure 3.4 Dependence on measurement number of the weights used by GILDAS ... 80 Figure 3.5 Dependence of the GILDAS weight on measurement number.. ... 80 Figure 3.6 Distribution of the GILDAS weights. ... 81 Figure 3.7 χ2 distributions for the line & the continuum as a function of ρ (mas)... 82 Figure 3.8 χ2 map in the (λ,α) parameter space using potential 1 ... 84 Figure 3.9 Dependence of χ2 on λ for various values of α using both potentials ... 85 Figure 3.10 χ2 maps in the (λ,α) parameter space for both potentials ... 86 Figure 3.11 Dependence of the A image appearance on the source ellipticity ... 86 Figure 3.12 Dependence of the best-fit value of ρ as a function of λ at fixed α ... 87 Figure 3.13 Dependence of ρ on λ and α for both potentials. ... 87 Figure 3.14 Dependence of χ2 on λ for fixed α and for both potentials. ... 88 Figure 3.15 Maps of the best-fit sources for both potentials. ... 88 Figure 3.16 Dependence of the B/A ratio on ρ ... 89 Figure 3.17 Results of the best-fit velocity gradient for both potentials. ... 91 Figure 3.18 Sky maps of the two half parts of the line & of the source. ... 92 Figure 3.19 Continuum: dependence of the best-fit χ2 on the source size ρ ... 92
xxv Figure 3.20 Distribution of the difference between original & reconstructed pixels ... 94 Figure 3.21 Sky map of the difference... 94 Figure 3.22 Projections on x (upper panels) and y (lower panels) of the difference ... 95 Figure 3.23 Dependence on ρ of the value of χ2 ... 95 Figure 3.24 Clean maps of the differences: noisy & noise-less models; model & data ... 96 Figure 3.25 Dirty map of the difference: original & reconstructed pixel contents ... 97 Figure 3.26 Projections on x (upper panels) and y (lower panels) of the difference ... 97 Figure 3.27 Dependence on ρ of the value of χ2.. ... 98 Figure 3.28 Dirty maps of the differences: noisy & noise-less models; model & data .... 99 Figure 4.1 A spiral, ESO 510-G13, warped by a collision with another galaxy ... 101 Figure 4.2 M-σ relation ... 101 Figure 4.3 A typical result from a simulation of structure formation ... 102 Figure 4.4 Spectral energy distributions for main sequence & starburst ... 102 Figure 4.5 CO emission ladder ... 103 Figure 4.6 z~10 galaxy discovered by the HST & SMGs recently detected by ALMA . 104 Figure 4.7 Discovery history of z>1 molecular line detections ... 105 Figure 4.8 SFR vs. Mstars & IR8 for z~0... 106
Figure 4.9 RSB vs. IR8, SFR-Mstars & sSFR vs ΣIR relation for z~0. ... 106
Figure 4.10 Stacked HST images of MS & SB galaxies for various z ranges ... 107 Figure 4.11 Dependence of the CO line width on CO luminosity & FIR luminosity .... 108 Figure 4.12 Redshift dependence of the mass fraction of gas to stars. ... 109 Figure 4.13 Dependence of the FIR luminosity on the CO luminosity. ... 110 Figure 4.14 Flux spectrum summed over the A and B images ... 111 Figure 4.15 Flux spectrum over the A images using various weightings ... 112 Figure 4.16 Molecular gas mass vs. CO line FWHM ... 114 Figure 4.17 Wavelength dependence of the measured dust luminosity of RX J0911. ... 115 Figure 4.18 Relation between FIR and CO line luminosities for various galaxies... ... 117 Figure 4.19 Distribution of LFIR /L'CO , as a function of LFIR & redshift ... 118
Figure 4.20 The CO line width vs. CO line luminosity & vs.FIR luminosity ... 118 Figure 4.21 Molecular gas mass vs. CO line & RX J0911. ... 119 Figure 4.22 MBH-σ relation for SMGs (blue circles) in the Bothwell 2013 sample. ... 120
xxvi
List of Tables
Table 1.1 Flux ratios for all four QSO components, relative to A1... 15 Table 1.2 Photometric and astrometric properties of RX J0911 and the lensing galaxy .. 16 Table 1.3 Parameters of the best fit potential ... 18 Table 1.4 Best fit image coordinates and magnifications ... 18 Table 1.5 CASTLES position and flux data ... 20 Table 1.6 Parameters used in the CLEAN algorithm. ... 32 Table 2.1 Case of a sphere+shear potential: useful expressions ... 39 Table 2.2 Potential 1, some useful expressions. ... 54 Table 2.3 Best fit results (r in arcseconds and φ in degrees) ... 56 Table 2.4 Best fit values of the parameters ... 57 Table 2.5 Parameters of the LENSTOOL potentials ... 58 Table 2.6 Positions and magnifications of the point images ... 58 Table 3.1 Astrometry results obtained on the line & continuum using potential 1 ... 76 Table 3.2 Best fit results on the source size ... 82 Table 3.3 Different evaluations of the systematic uncertainty on the source size ρ. ... 83 Table 3.4 Best-fit values of ρ (mas) evaluated with different methods ... 98 Table 4.1 RX J0911 data ... 113 Table 4.2 Measured flux densities of RX J0911.4+0551 ... 115
xxvii
List of Abbreviations
General
AGN Active Galactic Nucleus
BH Black Hole
CASTLE CfA-Arizona Space Telescope LEns Survey
CMA Cold Mode Accretion
CMB Cosmic Microwave Background
CSG Colour Selected Galaxy
DEC Declination
ERO Extremely Red Object
FFT Fast Fourier Transform
FIR Far-Infrared
FWHM Full Width at Half Maximum
GMC Giant Molecular Cloud
HERACLES HERA CO Line Extragalactic Survey
IF Intermediate Frequency
IGM Intergalactic Medium
IR Infrared
ISM Interstellar Medium
ISRF Interstellar Radiation Field
ΛCDM Lambda Cold Dark Matter
LIRG Luminous Infrared Galaxy (LIR>10
11
Lsun)
LBG Lyman-Break Galaxy
MS Main Sequence
PA Position Angle
PSF Point Spread Function
PAH Polycyclic Aromatic Hydrocarbon
QSO Quasi-Stellar Object
RA Right Ascension
RF Radio Frequency
RG Radio Galaxy
RMS Root Mean Square
SB Starburst
SDSS Sloan Digital Sky Survey
SED Spectral Energy Distributions
SFR Star-Formation Rate
SIS Single Isothermal Sphere
SMBH Supermassive Black Hole
SMG Submillimeter Galaxy
![Figure 2.5 Top panel: dependence of f on φ[radians] for γ 0 =0.25 and r 0 =1. The line r s =0.2](https://thumb-eu.123doks.com/thumbv2/123doknet/2141955.8898/70.892.189.672.382.907/figure-panel-dependence-f-f-radians-gh-line.webp)