HAL Id: cea-00826864
https://hal-cea.archives-ouvertes.fr/cea-00826864
Submitted on 15 Oct 2019
HAL is a multi-disciplinary open access
archive for the deposit and dissemination of
sci-entific research documents, whether they are
pub-lished or not. The documents may come from
teaching and research institutions in France or
abroad, or from public or private research centers.
L’archive ouverte pluridisciplinaire HAL, est
destinée au dépôt et à la diffusion de documents
scientifiques de niveau recherche, publiés ou non,
émanant des établissements d’enseignement et de
recherche français ou étrangers, des laboratoires
publics ou privés.
An Observed Link Between Active Galactic Nuclei And
Violent Disk Instabilities In High-Redshift Galaxies
Frédéric Bournaud, Stéphanie Juneau, Emeric Le Floc’H, James Mullaney,
Emanuele Daddi, Avishai Dekel, Pierre-Alain Duc, David Elbaz, Fadia Salmi,
Mark Dickinson
To cite this version:
Frédéric Bournaud, Stéphanie Juneau, Emeric Le Floc’H, James Mullaney, Emanuele Daddi, et al.. An
Observed Link Between Active Galactic Nuclei And Violent Disk Instabilities In High-Redshift
Galax-ies. The Astrophysical Journal, American Astronomical Society, 2012, 757 (1), pp.81.
�10.1088/0004-637X/757/1/81�. �cea-00826864�
arXiv:1111.0987v6 [astro-ph.CO] 26 Jun 2012
AN OBSERVED LINK BETWEEN ACTIVE GALACTIC NUCLEI AND VIOLENT DISK INSTABILITIES IN HIGH-REDSHIFT GALAXIES
Fr´ed´eric Bournaud
CEA, IRFU, SAp, F-91191 Gif-sur-Yvette, France.
St´ephanie Juneau
Steward Observatory, University of Arizona, Tucson, AZ 85721, USA. CEA, IRFU, SAp, F-91191 Gif-sur-Yvette, France.
Emeric Le Floc’h, James Mullaney, Emanuele Daddi
CEA, IRFU, SAp, F-91191 Gif-sur-Yvette, France.
Avishai Dekel
Racah Institute of Physics, The Hebrew University, Jerusalem 91904, Israel.
Pierre-Alain Duc, David Elbaz, Fadia Salmi
CEA, IRFU, SAp, F-91191 Gif-sur-Yvette, France.
and Mark Dickinson
National Optical Astronomy Observatory, 950 North Cherry Avenue, Tucson, AZ 85719, USA. Draft version June 28, 2018
ABSTRACT
We provide evidence for a correlation between the presence of giant clumps and the occurrence of
ac-tive galactic nuclei (AGN) in disk galaxies. Giant clumps of 108−9M
⊙ arise from violent gravitational
instability in gas-rich galaxies, and it has been proposed that this instability could feed supermassive black holes (BH). We use emission line diagnostics to compare a sample of 14 clumpy (unstable) disks and a sample of 13 smoother (stable) disks at redshift z ∼ 0.7. The majority of clumpy disks in our sample have a high probability of containing AGN. Their [Oiii]λ5007 emission line is strongly excited, inconsistent with low-metallicity star formation alone. [Neiii]λ3869 excitation is also higher. Stable disks rarely have such properties. Stacking ultra sensitive Chandra observations (4 Ms) reveals an X-ray excess in clumpy galaxies, which confirms the presence of AGN. The clumpy galaxies in our intermediate-redshift sample have properties typical of gas-rich disk galaxies rather than mergers, being in particular on the Main Sequence of star formation. This suggests that our findings apply to the physically-similar and numerous gas-rich unstable disks at z > 1. Using the observed [Oiii] and X-ray luminosities, we conservatively estimate that AGN hosted by clumpy disks have typical
bolometric luminosities of the order of a few 1043erg s−1, BH growth rates ˙m
BH∼10−2M⊙yr−1, and
that these AGN are substantially obscured in X-rays. This moderate-luminosity mode could provide a large fraction of today’s BH mass with a high duty cycle (>10%), accretion bursts with higher luminosities being possible over shorter phases. Violent instabilities at high redshift (giant clumps) are a much more efficient driver of BH growth than the weak instabilities in nearby spirals (bars), and the evolution of disk instabilities with mass and redshift could explain the simultaneous downsizing of star formation and of BH growth.
Subject headings: galaxies: active — galaxies: nuclei — galaxies: ISM — galaxies: high-redshift — galaxies: formation
1. INTRODUCTION
The formation of Supermassive Black Holes (BH) at the center of galaxies appears to be connected to
their stellar mass assembly history. Not only is
to-day’s BH mass closely related to the stellar mass (Magorrian et al. 1998; Merritt & Ferrarese 2001), but also the BH accretion history appears to follow the cos-mic star formation (SF) history (Barger et al. 2001). The bulk of both SF activity and BH growth has long been attributed to mergers, especially at high
redshift (e.g., Elbaz & Cesarsky 2003; Di Matteo et al. 2005; Hopkins et al. 2006) but there is increasing recog-nition that the SF history is not dominated by merger-induced starbursts, but by continuous SF in gas-rich star forming disks (e.g., Elmegreen et al. 2007; Daddi et al. 2008; Rodighiero et al. 2011). Models indicate that mas-sive galaxies at high redshift obtain a large fraction of their gas from rapid cold accretion, most of which comes as smooth gas streams and very small mergers, not ma-jor mergers: the high rate of continuous gas infall
main-tains high fractions of cold gas in the disk and high star formation rates (Kereˇs et al. 2006; Brooks et al. 2009; Dekel et al. 2009; Bouch´e et al. 2010).
Hence, galaxy mergers likely produce the strongest starbursts (e.g., Tacconi et al. 2008) but they appear not to dominate the cosmic star formation history. Similarly, the most rapidly accreting BHs in bright QSOs are prob-ably fed by mergers (Riechers et al. 2008; Walter et al. 2009), but mergers do not necessarily dominate the global budget of BH growth : moderate AGNs with sub-quasar luminosities at z ≈ 1 − 3 mostly reside in nor-mally star-forming galaxies rather than in starbursting mergers (Mullaney et al. 2012a). While it is observed, at least locally, that mergers and interactions do trig-ger AGN compared to isolated galaxies (Ellison et al. 2011), mergers may not be the dominant feeding pro-cess, due for instance to the scarcity of major
merg-ers compared to the general galaxy population.
In-deed, X-ray AGN host galaxies do not show morpho-logical merger signatures more frequently than inactive galaxies, especially at high redshift and at least for the most frequent moderate-luminosity AGNs (Grogin et al. 2005; Gabor et al. 2009; Cisternas et al. 2011). The X-ray signal of AGNs could be attenuated by obscura-tion in gas-rich mergers (Hopkins et al. 2006), but the most recent studies with increasing X-ray sensitivity confirm the lack of any observable AGN-merger con-nection (Schawinski et al. 2011; Mullaney et al. 2012a;
Kocevski et al. 2011). Non-merging galaxies also
ap-pear to dominate the X-ray luminosity and BH accre-tion density, especially for moderate-luminosity AGN (Georgakakis et al. 2009). All these observations suggest that high-redshift BH growth largely proceeds indepen-dently from major galaxy mergers.
Could internal processes feed BHs and AGNs effi-ciently in high-redshift disk galaxies? Internal, “secu-lar” AGN feeding in nearby spiral galaxies mostly involve bars (and embedded nuclear bars, e.g., Emsellem et al. 2001): this is a slow process, expected to provide only a small fraction of the BH mass (Hopkins & Hernquist 2006). Yet, disk galaxies at high redshift are very differ-ent from nearby spirals. They are very gas-rich, strongly unstable, often dominated by giant clumps of gas and young stars – while local disk galaxies are dominated by bars and spiral arms, with only low-mass star
form-ing complexes inside the spiral arms. The ubiquity
of clump-dominated morphologies in high-redshift star-forming galaxies has been pointed out at various wave-lengths by Cowie et al. (1996); Elmegreen et al. (2004, 2007); F¨orster Schreiber et al. (2006, 2009); Genzel et al.
(2008); Guo et al. (2011). These giant clumps are
not just low-mass patches of star formation: they
have individual masses up to a few 108−9M
⊙ each
(Elmegreen & Elmegreen 2005; Elmegreen et al. 2009a; F¨orster Schreiber et al. 2006, 2011). Most clumps are not incoming satellites, but form in-situ by grav-itational instabilities, as indicated by their photo-metric properties (Elmegreen et al. 2007, 2009a), gas kinematics (Shapiro et al. 2008; Bournaud et al. 2008; van Starkenburg et al. 2008), and estimates of Toomre parameters Q < 1 (Genzel et al. 2011).
Giant clumps are actually the most striking feature
tracing the global, violent1 gravitational instability in
high-redshift disks. This instability results from very high gas fractions of the order of 50% as observed by Daddi et al. (2008, 2010) and Tacconi et al. (2010). The-oretically, the high gas fractions and instability are ex-plained as the natural outcome of the rapid cosmic infall of gas (Dekel et al. 2009 (hereafter DSC09); Agertz et al. 2009; Ceverino et al. 2010), while merger-dominated phases produce stable systems (Bournaud & Elmegreen 2009). The disks become more stable and clumpy struc-tures are replaced by spiral arms and bars at lower red-shift, as the gas fraction decreases (Martig et al. 2012; Kraljic et al. 2012) and the turbulent velocity dispersion of the gas also decreases (Kassin et al., in preparation).
It has been recently proposed that disk instability in such high redshift conditions could efficiently feed BHs. The gaseous and stellar densities in the giant clumps are so high that black holes may start forming by run-away stellar collisions and become the seeds for future su-permassive BHs (Elmegreen et al. 2008a). Furthermore, the observed instability and the associated turbulent en-ergy dissipation trigger a gas inflow throughout the disk towards the nucleus, via intense gravitational torquing (Gammie 2001; Dekel et al. 2009; Krumholz & Burkert 2010; Elmegreen & Burkert 2010). The central inflow rate could feed a BH at a realistic growth rate over a
few 108−9 yr, along with bulge growth (Bournaud et al.
2011, hereafter B11). This gas inflow toward a central BH can be triggered even when giant clumps are present in the outer disk, regardless of the clumps being long-lived against stellar feedback and able to migrate radi-ally (Krumholz & Dekel 2010, B11). The cold gas infall maintaining the instability may persist even with power-ful AGN feedback (Di Matteo et al. 2011; Dubois et al. 2012).
This mechanism could hardly be directly tested in z ≈ 2 clumpy disk galaxies using current facilities, though. The associated AGNs should most of the time have modest intrinsic X-ray luminosities, and would be strongly ob-scured by the interstellar medium in these high-redshift disks, which are gas-rich and geometrically thick (B11), in addition to potential obscuration by the AGN torus itself. Instead, narrow emission lines from gas surround-ing the AGN could be a better tracer of moderate BH activity in gas-rich galaxies: the associated emission re-gion is more extended spatially, and the existence of un-obscured sight lines is more likely – the use of narrow line diagnostics to probe moderate AGNs was illustrated, for instance, by Wright et al. (2010). However, the ap-plication of these diagnostics to primordial galaxies at z ∼ 2 remains uncertain (e.g., Shapley et al. 2005), and the main emission lines are redshifted in the near-infrared where available data are limited to few systems with low signal-to-noise spectra. The SINS near-infrared survey gathered near-infrared spectra with high signal-to-noise ratios for a sample of z ∼ 2 star-forming galaxies, but it is mostly targeted toward galaxies that are thought to
1 We call “violent” the ring, clump, and axisymmetric insta-bilities in high-redshift disks, in contrast to the weaker, non-axisymmetric modes (bars and spiral arms) that dominate low-redshift disks. In the violent high-low-redshift instability, gravitational torques are considerably stronger and the radial gas inflow is much faster (B11).
be free from AGN, on purpose (F¨orster Schreiber et al. 2009) – although it does contain at least one example of AGN in a rotating clumpy disk (e.g., Genzel et al. 2006). To get around these problems, we study in this pa-per the presence of AGNs in clumpy disk galaxies in the intermediate redshift range 0.4 < z < 1.0. An advan-tage of this intermediate redshift range is that emission line diagnostics can be used with higher confidence than at z ∼ 2, because the mass-metallicity relation evolves at a lower rate at z < 1 than at higher redshifts (e.g., Savaglio et al. 2005). Another advantage is that in this redshift range, stable disks more similar to nearby spirals are also common, making it possible to directly compare violently unstable, clumpy disks to smoother, more sta-ble systems. Clumpy galaxies in this redshift range are fully representative for the global process of violent disk instability at high redshift (as further demonstrated with our own sample in Section 2). Hence, focusing on inter-mediate redshifts enables us to use reliable AGN diag-nostics, apply them to samples of clumpy unstable disks galaxies, and compare to more stable spiral-like galaxies at similar redshifts.
In Section 2, we build a sample of Clumpy galaxies and
a reference sample of Stable disks in the GOODS2-South
field. The clumpiness is measured both visually and by computer; the samples are about mass- and redshift-matched. In Section 3, we use narrow emission line di-agnostics, in particular the Mass-Excitation (MEx) diag-nostic introduced by Juneau et al. (2011, hereafter J11), which is useable with optical spectra up to redshift one, statistically calibrated, and robustly tested against X-ray AGN selections up to z ≈ 1 in J11. In Section 4, we perform X-ray stacking using the deepest 4 Ms Chandra data. The inferred AGN luminosities and BH accretion rates are discussed in Section 5.
Throughout the paper, we assume Ωm = 0.3, ΩΛ =
0.7, H0 = 70 km s−1. [Oiii] denotes [Oiii]λ5007, [Neiii]
denotes [Neiii]λ3869, and [Oii] denotes [Oii]λλ3726,3729, the [Oii] flux being the total flux of the doublet. Line ratios such as [Oiii]/Hβ denotes a flux ratio, except for [Oii]/Hβ which is an equivalent width ratio.
2. CLUMPY DISKS AND STABLE DISKS: SAMPLE
SELECTION, CLASSIFICATION, AND ANALYSIS
Violent instabilities and giant clumps are most fre-quent above redshift one. Here we select intermediate-redshift clumpy systems at z ∼ 0.7, in order to uti-lize robust diagnostics that can distinguish the signatures of AGNs from SF, and compare to a control sample of more stable disks that are absent from z ≥ 1 datasets. In studies covering a large redshift range, the morpho-logical and photometric properties of clumps in galaxies at intermediate redshift are not found to be very differ-ent from those of z ∼ 2 clumpy disks (Elmegreen et al. 2007, 2009a). The only difference is that violent insta-bilities persist at lower redshift only in moderate-mass galaxies. At redshift 2, clumpy disks are observed even
in systems with stellar masses of several 1011M
⊙(e.g.,
Genzel et al. 2006; F¨orster Schreiber et al. 2009). Be-low redshift one, clumpy galaxies typically have baryonic
masses of the order of a few 1010 M⊙(e.g., Elmegreen
2The Great Observatories Origins Deep Survey
et al. 2009a, Puech 2010). The fact that clumpy mor-phologies persist down to lower redshift for lower mass galaxies is consistent with the theoretical framework in which violent disk instabilities arise in gas-rich disks fed by cold streams. The persistence of the instability pri-marily requires the preservation of a high gas fraction in the disk (Bournaud & Elmegreen 2009, DSC09). Cold accretion should persist down to lower redshift for lower-mass systems (Dekel & Birnboim 2006). More lower-massive galaxies form their stars and consume their gas earlier (e.g. Juneau et al. 2005), indeed their gas fractions are lower (Kannappan 2004) and are unlikely to support vi-olent instabilities. More massive galaxies also build a stellar spheroid more rapidly, which also stabilizes the disk (DSC09, Martig et al. 2009,Cacciato et al. 2012).
Hence, the fact that clumpy galaxies at intermediate
redshift are mostly moderate-mass systems (a few 1010
M⊙) while such morphologies are also found in more
mas-sive galaxies at z ∼ 2, does not indicate a different ori-gin or a different dynamical evolution. This is actually a natural property of the global process of violent disk instabilities in gas-rich galaxies fed by cold gas flows. As lower-redshift systems tend to have lower gas fractions and become more stable, an external tidal field in distant interactions may sometimes be needed to trigger the in-stability (Di Matteo et al. 2008; Puech 2010), but even so the dynamical process remains a violent instability in a gas-rich disk. We will show in the following that our sample of z ∼ 0.7 clumpy galaxies are gas-rich systems on the Main Sequence of star formation, as expected for clumpy disks at higher redshift.
2.1. Strategy and Datasets
We aimed at obtaining a sample of Clumpy unstable galaxies at z ∼ 0.4−1, and a comparison sample of Stable disk galaxies with only weak non-axisymmetric instabil-ities (bars and spiral arms). Having two such categories allows us to directly compare their average SF activity, AGN probabilities, and perform X-ray stacking. Beyond this binary classification, we will also use quantitative es-timates of the Clumpiness, so as to distinguish the most clumpy galaxies from more moderate cases.
The parent sample was selected in the GOODS-South field, with deep HST/ACS imaging from Giavalisco et al. (2004). This is the most suitable field combining deep-enough imaging for substructure identification (clumps), a large coverage of moderate-mass galaxies in optical spectroscopic surveys, with large-enough statistics.
The main AGN identification tool used in this study is the MEx diagnostic. This narrow emission line diag-nostic is less affected by nuclear obscuration than X-ray selections, and was indeed shown to complement X-ray AGN selection with the identification of X-ray weak AGN (J11) – X-ray stacking (Section 5) will confirm that most of the MEx-identified AGN in our sample are too faint to be individually detected in X-rays but are detected in stacked data. As opposed to the BPT technique (Bald-win, Phillips & Terlevich, 1981), the MEx diagnostic diagram remains useable beyond z = 0.4 with optical spectra, and its robustness was tested up to z ≈ 1 in J11. A key requirement for our sample selection is then the availability of a reliable [Oiii]/Hβ flux ratio
mea-surement. The Blue diagram ([Oii]λ3727/HβEW versus
TABLE 1
Properties of the galaxies in our Clumpy and Stable disk samples.
Object Mass and redshift Clumpiness
Type ID α (J2000) δ(J2000) zspec log(M∗/M⊙) visual automated
S1 03:32:11.38 -27:42:06.5 0.733 10.1 1.4 1.6 S2 03:32:17.63 -27:48:11.8 0.735 10.7 1.1 2.6 S3 03:32:19.68 -27:50:23.6 0.559 10.9 2.1 – S4 03:32:23.17 -27:55:41.2 0.733 10.2 2.3 2.4 S5 03:32:23.40 -27:43:16.6 0.616 11.1 1.6 2.1 S6 03:32:27.83 -27:43:37.5 0.548 9.8 1.2 1.6 Stable disks S7 03:32:54.51 -27:47:03.5 0.533 10.7 1.2 – S8 03:32:08.14 -27:47:12.3 0.578 9.7 1.6 – S9 03:32:20.69 -27:51:42.1 0.679 10.9 2.4 1.6 S10 03:32:30.43 -27:51:40.3 0.760 10.4 1.1 2.7 S11 03:32:29.17 -27:48:33.1 0.432 10.1 1.9 1.4 S12 03:32:18.69 -27:51:49.3 0.457 10.2 1.4 1.9 S13 03:32:19.78 -27:54:09.1 0.735 10.4 1.8 3.1 C1 03:32:28.18 -27:40:51.6 0.426 9.9 4.3 – C2 03:32:17.47 -27:48:38.4 0.737 9.8 4.1 4.5 C3 03:32:19.61 -27:48:31.0 0.671 10.3 4.2 – C4 03:32:36.68 -27:39:54.6 0.455 10.2 3.5 3.1 C5 03:32:27.11 -27:49:22.0 0.559 9.7 4.6 – C6 03:32:33.01 -27:48:29.4 0.664 9.6 4.8 – Clumpy disks C7 03:32:34.04 -27:50:09.7 0.703 10.2 5.0 – C8 03:32:51.52 -27:47:58.1 0.737 11.0 3.4 4.7 C9 03:32:23.66 -27:49:38.0 0.578 10.7 4.4 4.2 C10 03:32:15.79 -27:53:24.7 0.676 10.7 4.7 3.8 C11 03:32:29.52 -27:55:27.2 0.663 9.7 4.2 – C12 03:32:14.59 -27:49:13.4 0.562 9.6 4.6 2.8 C13 03:32:15.35 -27:45:07.0 0.861 10.5 3.8 2.7 C14 03:32:25.19 -27:51:00.0 0.841 10.4 4.0 3.8 TABLE 2
AGN probabilities for our Clumpy and Stable disk samples, for various AGN categories, using the MEx and Blue diagnostics separately.
PMEx PBlue
Type ID SF comp LINER Sy2 SF comp LINER Sy2
S1 0.49 0.27 0.23 0.01 0.17 0.82 0.00 0.01 S2 0.07 0.49 0.44 0.00 0.29 0.71 0.00 0.00 S3 0.23 0.74 0.03 0.00 0.71 0.29 0.00 0.00 S4 0.86 0.14 0.00 0.00 0.80 0.20 0.00 0.00 S5 0.78 0.22 0.00 0.00 0.93 0.07 0.00 0.00 S6 0.92 0.05 0.03 0.00 0.44 0.26 0.27 0.02 Stable disks S7 0.15 0.71 0.14 0.00 0.68 0.31 0.01 0.00 S8 0.93 0.02 0.02 0.03 0.58 0.12 0.02 0.29 S9 0.03 0.40 0.57 0.01 0.30 0.34 0.34 0.01 S10 0.12 0.40 0.47 0.01 0.50 0.49 0.01 0.00 S11 0.43 0.31 0.26 0.00 0.23 0.31 0.44 0.02 S12 0.47 0.34 0.19 0.00 0.68 0.29 0.02 0.00 S13 0.89 0.11 0.00 0.00 0.91 0.09 0.00 0.00 C1 0.04 0.01 0.16 0.80 0.07 0.01 0.00 0.91 C2 0.80 0.03 0.06 0.11 0.57 0.09 0.01 0.32 C3 0.03 0.10 0.53 0.34 0.43 0.17 0.00 0.40 C4 0.11 0.12 0.47 0.30 — — — — C5 0.85 0.02 0.03 0.09 0.43 0.03 0.01 0.53 C6 0.96 0.01 0.01 0.02 — — — — Clumpy disks C7 0.02 0.05 0.48 0.45 — — — — C8 0.00 0.00 0.21 0.79 0.00 0.00 0.04 0.95 C9 0.11 0.69 0.20 0.00 0.68 0.30 0.02 0.00 C10 0.00 0.04 0.70 0.26 0.47 0.14 0.01 0.38 C11 0.43 0.04 0.11 0.42 0.13 0.00 0.00 0.87 C12 0.40 0.08 0.04 0.48 0.01 0.00 0.00 0.99 C13 0.09 0.44 0.46 0.00 0.32 0.67 0.00 0.00 C14 0.00 0.00 0.16 0.84 0.00 0.00 0.04 0.96
the ([Oii]/Hβ)EWratio can also be accurately measured,
and the results from both AGN diagnostics will be com-pared.
We thus select galaxies with optical spectra covering at least the Hβ and [Oiii] lines. We restrict this selection to the two largest optical spectroscopic surveys in
GOODS-South, namely GOODS/FORS2 (Vanzella et al.
2008) and GOODS/VIMOS (Popesso et al. 2009;
Balestra et al. 2010). For the latter, only spectra
obtained with a medium-resolution VIMOS setup were considered because low-resolution setups would not yield accurate-enough flux measurements and in most cases cover too short wavelengths. The spectra used in this work hence all have a spectral resolution R ≥ 720. We did not include other smaller spectroscopic dataset
available in GOODS-South, which were examined3 but
would add only 2 objects each to a sample of 27 galaxies while reducing the uniformity of the spectral coverage and offering lower signal-to-noise ratio spectra.
2.2. Sample selection
Among all objects covered in the GOODS/FORS2 and GOODS/VIMOS surveys, we considered only those com-plying with the following criteria:
1. availability of a robust spectroscopic redshift zspec
with the highest quality flags in the published databases (Vanzella et al. 2008; Popesso et al. 2009; Balestra et al. 2010).
2. redshift in the 0.4 < zspec < 1.0 range. The
up-per limit is imposed by the availability of an [Oiii] detection, and also ensures that ACS imaging cov-ers optical rest-frame emission. The lower limit aims at obtaining two samples of clumpy and sta-ble galaxies that are about redshift-matched, con-sidering that clumpy galaxies are almost absent at z < 0.4.
3. spectral range covering both the [Oiii] and Hβ emission lines without being hampered by sky lines, a detection of both lines with a signal-to-noise ratio greater than four.
4. stellar mass in the 9.6 < log(M∗/M⊙) < 11.2 range:
this arbitrary choice gives the largest possible sam-ple without introducing a strong mass bias between clumpy and smoother disks – we noted that in the studied redshift range, systems below our lower-mass limit are mostly clumpy, systems above our higher-mass limit are rarely clumpy. The technique employed for stellar mass estimates is described in Appendix A.
From this initial selection of 48 objects, we remove systems that cannot be obviously classified as Clumpy galaxies or Stable disks, namely:
1. compact systems with major axis smaller than ≤ 0.8” in ACS i band, as no substructure could be distinguished (6 objects).
3 This was done using the entire ESO
CDFS spectroscopic compilation available at
http://archive.eso.org/wdb/wdb/vo/goods CDFS master.
2. interacting pairs and mergers with long tidal tails and/or double nuclei (4 objects).
3. systems with major dust lanes hampering morpho-logical classification in optical bands (3 objects). 4. spheroid-dominated systems, selected as having an
axis ratio lower than 3 in ACS z and i bands with-out having clumps or spiral arms tracing a face-on disk (4 objects).
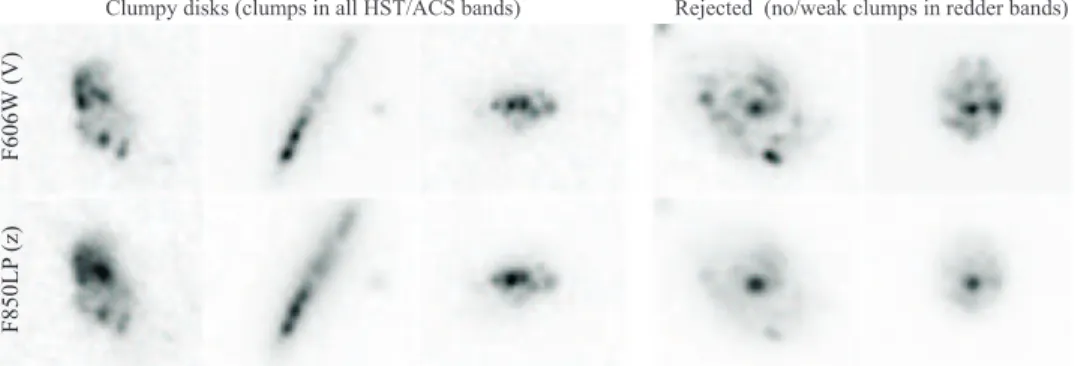
5. systems harboring weak and/or elongated clumps, or clumps smaller than the ACS PSF, making the distinction between real clumps and short “floc-culent” spiral arms uncertain (4 objects). These weak clumps have a high contrast only in the bluest ACS bands (ultraviolet rest-frame), and merely vis-ible in the z band (optical rest-frame), which con-firms that they not similar to the massive clumps of Clumpy galaxies that are clearly visible in all ACS bands (see Fig 6).
Hence, 29% of the initial selection is rejected as these systems do not correspond to disk galaxies (compact ob-jects, spheroids, major mergers), and 14% of the sys-tems are rejected because they could not be classified as Clumpy or Stable disks (6%: major dust lanes, 8%:am-biguous or unresolved substructures). Representative ex-amples of rejected systems in each of the previous cat-egory are shown in Figure 5. This resulted in a parent sample of 27 systems with resolved morphology not cor-responding to major mergers, spheroids, and for which clumps/spiral arms are large/long enough to be distin-guished. We then classified these galaxies using the clas-sification criteria and clumpiness estimates detailed here-after, so as to build our final “Clumpy” and “Stable” disk samples (they are displayed on Figs. 3 and 4 after the classification is performed).
Selecting galaxies with Hβ and [Oiii] detections can bias the sample toward AGN host galaxies. This would not hinder the comparison of Stable disks and Clumpy disks, but the absolute fractions of AGN in each sam-ple could be increased by this selection. However, the selection is mostly biased against passive galaxies. We aim at selecting star-forming disks, which should be on the Main Sequence of star formation, and the spectro-scopic surveys employed do typically detect these emis-sion lines in such galaxies and in the mass and redshift range that we consider, without requiring AGN. Indeed, even the objects with the lowest AGN probabilities in our sample, which re mostl likely star-forming galaxies, have [Oiii] and Hβ detected above our 4-σ threshold (and often above 5-σ), suggesting that similar star-forming galaxies would in general be selected.
2.3. Morphological Classification and Clumpiness
Measurements
In order to build two samples of “Clumpy” and “Sta-ble” disk galaxies, we performed clumpiness estimate us-ing an eyeball classification for the whole sample, and an automated measurement for about two thirds of our galaxies that have a robust disk/bulge luminosity model available from the morphological study of GOODS-South by Salmi et al. (2012).
Visual classification — Examining the color images from the GOODS-HST/ACS images (Giavalisco et al. 2004), each of the authors independantly attributed a grade to each galaxy in the sample, between 1 and 5, using the following description of the grades:
• 1.0: for robust smooth/stable disk, the stability
being defined against bright clumps (spiral arms and bars, which are weaker instabilities typical for z = 0 disks, are not taken into account),
• 2.0: for likely smooth/stable disk (some moderate
clumps but spiral-dominated),
• 3.0: for unsure systems, mix of stable and unstable
regions, or potential low bulge/disk ratio,
• 4.0: likely clumpy unstable disk (dominated by
bright clumps but significant spirals),
• 5.0: robust clumpy/unstable disk.
In the following, we present results using the mean grade for each galaxy – median results were also exam-ined, and the mean grades were found to be slightly more conservative with respect to our final conclusions. We hereafter refer to the average grade for each galaxy as its visual clumpiness.
Automated clumpiness measurement — A quantitative clumpiness measurement, based on bulge+disk axisym-metric luminosity model built with the Galfit software, is available for a mass selected sample in GOODS-South from Salmi et al. (2012). Two thirds of our sample are covered by Salmi et al. – objects with a too low K-band luminosity or insufficient Galfit convergence are not covered. We then use these axisymmetric luminosity models, when available, to perform a clumpiness mea-surement which is slightly different from the one used initially by Salmi et al., in order to better distinguish clumps and spiral arms in the mass and redshift ranges that we are considering.
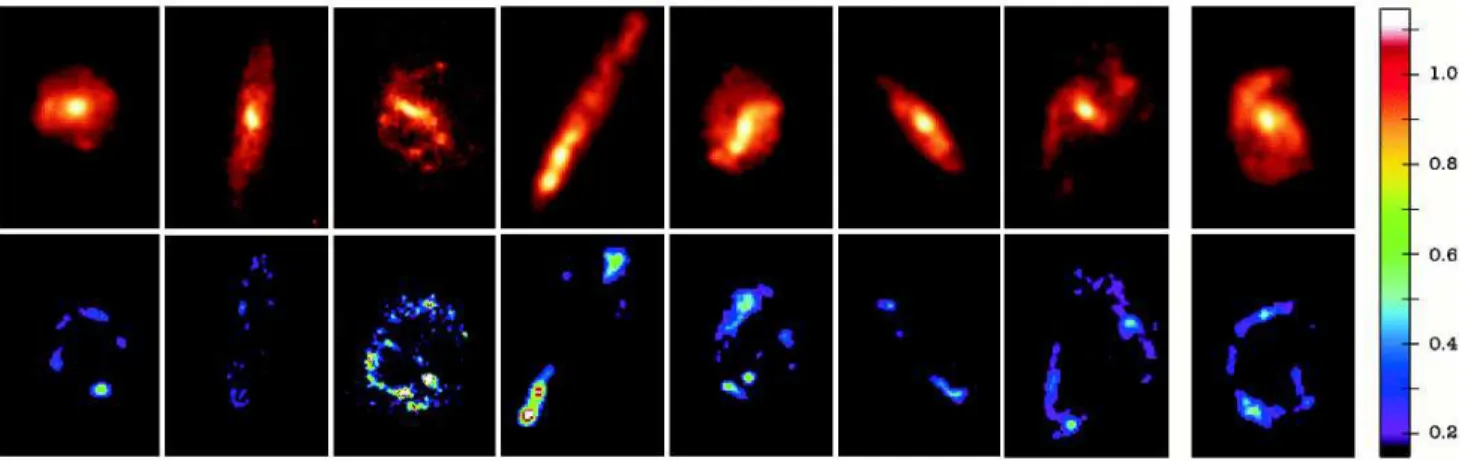
For each galaxy, the Salmi et al. (2012) model was built on the z-band ACS image within a segmentation map. The residual map is computed as the difference be-tween the image and model, and we divide the residual map by the model map to obtain the relative residuals. Negative residuals, which cannot correspond to bright clumps, but rather to inter-arm regions, badly subtracted bulges, or extended outer disks, are filtered out. We also filter out all relative residuals lower than 20%, be-cause they typically correspond to faint extended struc-tures: spiral arms or extended outer disks, not bright clumps. Such filtering was not applied in the Salmi et al. study. Here the 20% threshold value was found to give the best selection of “clumps” with respect to smoother structures, in particular spiral arms, as illustrated by the residual maps displayed in Figure 1.
The automated clumpiness is defined by the sum of the residuals within the segmentation map divided by the number of pixels and multiplied by 1.8. We use the log-arithm of this value, so as to obtain values more directly comparable to visual estimates. The arbitrary multi-plication by 1.8 simply aims at obtaining similar scales from about 1.0 to 5.0 for both the visual and automated measurements. The correlations between clumpiness and
AGN probability presented in the following Sections hold also without the use of a logarithmic scale.
Selection of Clumpy disk and Stable disk samples — The au-tomated clumpiness measurements, when available, are tightly correlated with visual estimates (Fig. 2). One single object shows a substantial difference (hereafter la-beled S13), caused by a strong spiral arm that was too
strong to be filtered out from the relative residual map4:
the visual estimate appears more relevant for this specific case.
In order to obtain the largest possible samples of “Clumpy” and “Stable” galaxies, our main selection re-lies on the visual clumpiness estimates, the reliability of which was confirmed by the comparison with
au-tomated measurements. We will nevertheless present
results based on the automated measurement in Sec-tion 3.6.
Here we classify the galaxies with visual clumpiness larger (respectively smaller) than 3.0 as “Clumpy” and “Stable” objects, which results in:
• a sample of fourteen Clumpy disks displayed in
Figure 3 and numbered C1 to C14: their optical morphology is dominated by bright clumps, with or without spiral arms, similar to higher-redshift clumpy systems and suggesting a similar process of gravitational instability in a gas-rich disk.
• a sample of thirteen Stable disks displayed in
Fig-ure 4 and numbered from S1 to S13: their opti-cal morphology is dominated by the usual struc-tures found in nearby disk galaxies, mostly bars
and spiral arms. Star-forming clumps can be
present, in particular along the arms, but are low-luminosity ones that do not dominate compared to the arm/inter-arm contrast, as in nearby late-type spirals. The presence of clumps only along spiral arms indeed indicates that such disks are overall
stable, with Q <
∼ 1 instability reached only locally once the gas is compressed in the arms, as opposed to the very clumpy disks that are globally unstable
with Q<
∼ 1 instability not restricted to compressed spiral arm regions.
We note that for objects with an automated clumpi-ness measurement, if we separate them using the median value of these measurements, they do not change cate-gory (see Fig. 2). The only exception is galaxy S13: as already discussed, this specific case is dominated by a strong spiral arm and using its visual estimate is more relevant.
Objects C6 and C7 were independently classified by Elmegreen et al. (2009a), in agreement with our present classification. These authors also noted that the last ob-ject in our Figure 5 (reob-jected from the sample) does not show typical clumps, but rather low-mass structures that could be a combination of short flocculent spiral arms and dust absorption patches. Object S3 was classified as a regular spiral disk galaxy by Neichel et al. (2008), consistent with our classification.
4 unless a higher filtering threshold is employed, but this would eliminate clumps in several other objects.
Fig. 1.— Representative examples of ACS z-band images and associated relative residuals maps, using the Salmi et al. (2012) luminosity profile models, after filtering of the relative residuals lower than 20%, showing that spiral arms, bars and bulges are mostly removed by this 20% threshold, while bright clumps are kept, independent of being isolated clumps or clumps along spiral arms. The last object, labeled S13 in the following sections, is the only clear case of contamination by a spiral arm that was too strong to be filtered out. The galaxies shown here are labelled C13, S11, C2, C9, C4, S10, S4 and S13, respectively, in the following sections and figures.
Fig. 2.— Correlation between the visual and automated clumpi-ness measurements. The same samples of Clumpy and Stable disks are obtained by using the median value of either measurement – one single object (hereafter S13) has a somewhat higher automated clumpiness value, known to be caused by a badly subtracted spiral arm, and is considered as a Stable disk.
Some galaxies in the Stable disk sample have bright patches or moderate clumps along their spiral arms, such as S3 or S9 (as is also the case for many nearby spi-rals in near-UV or blue bands). When we use a binary Clumpy/Stable classification, such objects belong to the Stable disk sample, based on their clumpiness measure-ments. At some point we will also compare the presence of AGN with the individual clumpiness value for each galaxy, which will fully reflect the fact that some for galaxies of the “Stable” sample do have some moderate clumps.
2.4. Main properties of the Clumpy disk and Stable disk
samples
Mass and redshift distribution — The Clumpy disk sample contains 14 galaxies, at a median spectroscopic redshift of 0.66 (quartiles: 0.56 and 0.74) and with a median
stellar mass log(M∗) = 10.2 (quartiles: 9.8 and 10.6).
The Stable disk sample contains 13 galaxies, at a median spectroscopic redshift of 0.62 (quartiles: 0.54 and 0.73)
and with a median log(M∗) = 10.42 (quartiles: 10.1 and
10.8). Thus the two samples are relatively mass-matched and redshift-matched. Our samples consist of moderate-mass galaxies, although they also contain galaxies more massive than today’s Milky Way. As previously detailed in Section 2, this is the expected redshift evolution of the violent instability process in galaxies fed by rapid gas inflow.
Star formation rates — Clumpy disk galaxies generally have relatively high star formation rate per unit stellar mass (sSFR, specific star formation rate), higher than stable disks and spheroid-dominated systems, but gener-ally not as high as starbursting systems for which sSFR
>> 1 Gyr−1 – they lie within the “Main Sequence”
of star formation defined by Elbaz et al. (2011, see
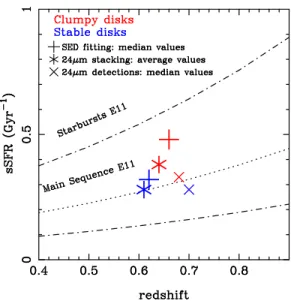
also Nordon et al. 2011) that dominates the budget of star formation (Rodighiero et al. 2011). Relatively high but not starbursting sSFRs were previously observed for z ∼ 2 clumpy disks (F¨orster Schreiber et al. 2011), and our intermediate-redshift sample has the same property, as shown on Figure 7.
Individual detections in the 16 and/or 24 µm Spitzer data from Teplitz et al. (2011) and Dickinson et al. (2004), converted into sSFR using the Chary & Elbaz (2001) relations, indicate higher sSFR in Clumpy types, but only about two thirds of our targets are individu-ally detected, with large uncertainties. To obtain a more representative estimate of the average sSFR in each sam-ple, we stacked the 16 and 24 µm data, using the same stacking methodology as for X-ray stacking, detailed in Section 5. None of our targets lies within the Spitzer PSF of another identified infrared source. To avoid contami-nation by nearby sources, we measured fluxes within the FWHM of the PSF before correcting for the full aperture. Using these near-infrared estimates, we obtain an
av-erage sSFR in our Clumpy disk sample of ≈ 0.38 Gyr−1,
somewhat higher than in our Stable disk sample (sSFR
≈0.26 Gyr−1). Such moderately-high sSFRs in Clumpy
disks compared to Stable disks are also supported by SED fitting results (see Appendix) and by the [Oii] equiv-alent widths and Hβ fluxes for Clumpy and Stable disks
Fig. 3.— Sample of z ∼ 0.7 Clumpy disks. Images are 6×6 arcsec, from HST/ACS B, V and i bands. Spiral arms may be present but as not as contrasted as the main clumps.
Fig. 4.— Same as Fig. 3, for our sample of Stable disks. Disk morphologies are dominated by spiral arms and bars, with weak clumps forming only in the spiral arms, indicating global stability with only local instabilities in the arms, as opposed to the “Clumpy disk” sample.
Fig. 5.— Examples of rejected systems in our classification, because of (1) major axis smaller than 0.8 arcsec, (2) evidence for merger (double nuclei and/or tidal tails), (3) major dust absorption, (4) low axis ratio without spiral arms, suggesting spheroid-dominated nature, (5) substructures of unclear or unresolved type with weak and/or elongated clumps (two examples shown): in the first example, dust lanes seem to cut across spiral arms, resulting in apparent structures that could be either elongated clumps or short arms, in the second case the substructures are not resolved by the ACS PSF, making their nature (clump vs. short arms) unclear. In such rejected cases, the putative clumps are weak and visible only in the bluest ACS bands (i.e., ultraviolet rest-frame, see Fig. 6).
Fig. 6.— Comparison of systems classified as “Clumpy disks” and rejected cases in two HST/ACS bands: the V band (F606W, top) corresponding to near-UV emission for our targets, and the z band (F850LP, bottom) corresponding to optical emission around the V band rest-frame. Systems classified as “Clumpy disks” have major clumps in the optical rest-frame, even if slightly less contrasted than in the UV rest-frame. Rejected systems have weak elongated clumps that are strong in the UV rest-frame but merely visible in the optical emission. All images use the same logarithmic grey scale.
Fig. 7.— Average or median position of our two samples in the redshift-sSFR plane, for various estimates of the star forma-tion rate: SED fitting (median values for objects with SED fit-ting, see appendix), 24 µm detections converted into SFR using Chary & Elbaz (2001) (median values for about two third of each sample), and mean values from 24 µm stacking (average values for the whole samples). The dash-dotted lines show the limits of the “Main Sequence” of star formation, as defined in Elbaz et al. (2011), the dotted line shows the average Main Sequence. Clumpy galaxies have higher sSFR then Stable disks, but remain within the Main Sequence, not in the “starburst” mode, as expected for gas-rich, gravitationally unstable disks. Note that only 24 µm stacking cover the entire samples, while 24 µm detections and SED fitting are available for parts of the samples, hence lying at somewhat different average/median redshifts.
(after estimating and subtracting the AGN component, see Section 3.7) . We show in Figure 7 the position of our two samples in the redshift–sSFR plane for these various measurement techniques. This confirms that we have selected a sample of gas-rich disks with sSFRs within the upper part of the “Main Sequence” of star formation at z ∼ 0.7 and not at the level of starbursting mergers (Elbaz et al. 2011), and a comparison sample of more stable disks with lower sSFR, in the lower part of the “Main Sequence”.
The average star formation rate surface density of our Clumpy disks corresponds to a gas to total baryonic mass fraction of 35% (using the optical major axis size for the disk diameter, and inverting the star formation - gas sur-face density relation for disks from Daddi et al. 2010b) . Similar estimates yield a typical gas fraction 23% for the Stable disk sample. Applying the stability calcu-lations presented in Bournaud & Elmegreen (2009), we determine that violent disk instability (i.e., a Toomre pa-rameter for gas and stars Q ≤ 1 over most of the disk)
requires a gas fraction >
∼ 30%, for the average stellar mass and optical size of our sample galaxies, and assum-ing a bulge fraction of 20%. The gas fractions estimated above are consistent with this instability threshold. This confirms again that we have successfully selected a sam-ple of gas-richer, violently unstable disks (presumably representative of z ∼ 2 clumpy galaxies), and a sample of stable disks with lower gas fractions (more representative of low-redshift spiral galaxies).
3. EMISSION LINE DIAGNOSTICS
In this section we use AGN diagnostics based on stel-lar mass and/or emission line ratios. The methods used for stellar mass and emission line ratio measurements are detailed in the Appendix. We first study the AGN prob-ability from the MEx diagnostic and Blue diagram, using our binary classification in Clumpy/Stable sample. We will next study the correlation between AGN probabil-ity and Clumpiness measurement for individual objects (§4.5).
3.1. Optical spectra
While we will use AGN diagnostics based on the indi-vidual spectra of each galaxy, we first show stacked opti-cal spectra for the samples of Clumpy Disks and Stable Disks, so as to highlight the general properties of these two samples. We kept only galaxies for which the spec-tral coverage encompasses [Oii] as well as [Oiii] and Hβ , and which do not have the [Oiii]λ4959 line affected by a strong sky line. This led to rejecting Clumpy systems C2, C4 and C7, as well as Stable disks S4 and S7: 78% of the sources are included in the stacked spectra, and the ex-cluded systems do not have extreme values of line ratios and AGN probabilities for their morphological class (see Table 2). Each individual spectrum was re-normalized to
the same average continuum level in the 3800–4800˚A
rest-frame spectral range. Stacked spectra were normalized to the same number of sources per sample. The stacked
spectra, smoothed with a Gaussian kernel of FWHM 5˚A ,
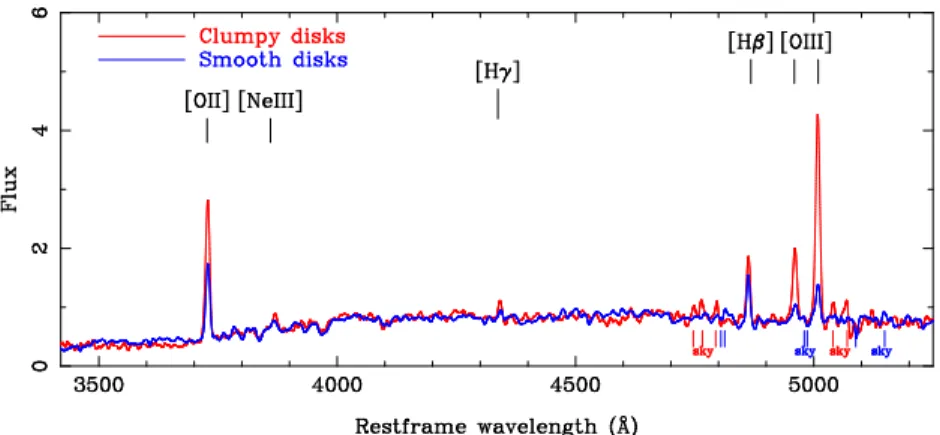
are shown on Figure 8.
The stacked spectra show that the Hβ emission, normalized to the same average continuum level, is marginally (≈20%) stronger in clumpy galaxies than in stable disks (consistent with a somewhat higher sSFR). The underlying absorption is weak in both cases, slightly higher in stable disks (as confirmed by Hγ and Hδ lines). The [Oii] emission is stronger by a factor 1.8 in the stacked clumpy disk spectra, while the [Oiii] emission in clumpy types is a factor 5.2 stronger in clumpy disks, and the [Oiii]/Hβ emission flux ratio higher by a factor 3.8. The continuum shape is quite similar in both cases. In the following sections, we use the MEx diagram and other diagnostics to show that the strong [Oiii] excitation by clumpy galaxies is a likely AGN signature, and cannot be explained simply by a low gas metallicity effect.
3.2. MEx diagnostic
Figure 9 shows our clumpy disk and stable disk
sam-ples on the MEx diagram ([Oiii]/Hβ versus M∗, J11).
The [Oiii] excitation is clearly higher in clumpy disks, and these mostly lie above the empirical dividing line for AGN host galaxies, defined in J11. Stable disk galaxies have lower [Oiii] excitations and are mostly identified as non-AGN galaxies on the MEx diagram; only a few high-mass cases lie in the MEx-intermediate or MEx-AGN re-gions (respectively between and above the dividing lines on Figure 9).
In addition to the empirical dividing lines on Fig. 9, the MEx diagnostic was calibrated using the BPT
clas-sification of >105 SDSS galaxies in order to quantify the
probability to observe an AGN host system as a function
of [Oiii]/Hβ and M∗ (see J11). The SDSS calibration
galaxies lie at low redshift (z < 0.1) and were first classi-fied using standard BPT diagrams into the following cat-egories: star-forming (SF), composite (comp), LINER, or
Fig. 8.— Stacked optical spectra for our samples of “Clumpy” and “Stable” disks, normalized to the same continuum level in the 3800– 4800˚A spectral range and to the same number of galaxies per sample, and smoothed with a Gaussian kernel of FWHM 5˚A. Wavelengths at which significant sky lines contaminate a single spectrum, and thus potentially the stacked spectrum, are indicated: the main emission lines are left unaffected.
Fig. 9.— Clumpy and Stable disk samples on the MEx diagram. The position of the stacked spectra from Figure 8 is also shown (stars). The dividing lines separate the MEx-SF, MEx-AGN, and MEx-intermediate regions defined in Juneau et al. (2011). The gray-scaled background colors indicate the AGN probability, cali-brated using the BPT diagnostic on z ∼ 0.1 SDSS galaxies. The evolution of the mass-metallicity relation out to z ≈ 1 in the stud-ied mass range should not affect line ratios by more than 0.1 dex (see text Section 4.4).
Seyfert 2 (Sy2). The likelihood of a certain spectral class is defined as the relative fraction of SDSS galaxies of that particular class within the 1σ uncertainties on the MEx diagram. The four spectral classes listed above are mutu-ally exclusive so their sum is, by definition, equal to unity (P (SF)+P (comp)+P (LINER)+P (Sy2)=1). Individual AGN probabilities on the MEx diagnostic are indicated in Table 1. As discussed later in Section 3.4, the proba-bilities should not be strongly affected by the metallicity evolution between z < 0.1 (the redshift range calibration sample from J11) and z ∼ 0.7 (the typical redshift of our samples), especially in the mass range studied here.
Stable disks have a median PMEx(SF ) of 47% and,
except for 2-3 AGN candidates, their AGN probabili-ties are low. In particular, the probability of hosting a
Seyfert 2, PMEx(Sy2) is always below 3%, showing that
systems that may not be pure star-forming galaxies show only weak signs of BH activity, with either composite-like properties or LINER-type excitation.
The MEx probabilities for Clumpy disks are quite
dif-Fig. 10.— Blue diagram with the dividing lines defined in (Lamareille 2010) four our galaxy samples. The background prob-abilities are defined and coded as on Figure 9. The [Oii]/Hβ ratio is here an equivalent width ratio, while [Oii]/Hβ is a flux ratio.
ferent. Except for three systems where PMEx(AGN ) is
low, the probability for the measured [Oiii] excitation to result purely from star formation is always below 50%, and often close to 0. Half of the clumpy galaxies have a
PMEx(Sy2) comparable to or higher than the probability
of composite properties or LINER-type excitation.
3.3. Blue diagram
We use the Blue diagram (Lamareille 2010) to perform a second classification of our samples. In some cases, the Blue diagram may be less efficient than the MEx diag-nostic in separating star-forming and AGN host galaxies because of an overlap region gathering galaxies identified as star-forming and as Sy2 on the BPT diagnostic. On the other hand, the Blue diagram may more clearly sep-arate LINER excitation (with high [Oii] excitation) from Sy2 activity (with the highest excitation in [Oiii] ).
Our two samples are shown on the Blue diagram on Figure 10, and Table 1 gives the associated probabilities (calibrated on SDSS galaxies, as already explained for the MEx diagnostic). This confirms that a large fraction of clumpy disks likely host an AGN, unlike the control sample of stable disks. Furthermore, the figure shows that the driving difference is the [Oiii] excitation, and
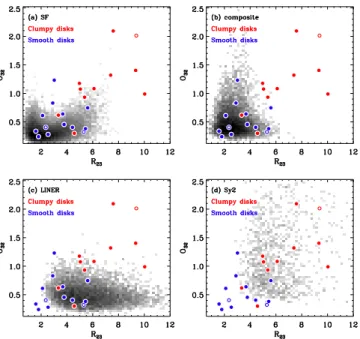
Fig. 11.— (R23;O32) diagram (see text for definitions), showing the position of our two samples compared to the distribution of SDSS galaxies in four spectral classes: star-forming, composite, LINER and Seyfert 2, respectively, based on the BPT diagnostic applied to SDSS galaxies as in J11. We did not apply any dust correction to our samples and to SDSS galaxies, as we estimate the correction to O32to be lower than 0.1 dex.
that clumpy disks are characterized by Sy2 or SF+Sy2 activity, rather than LINER excitation. This feature is also apparent on the individual classification
probabili-ties listed in Table 1, where the values of PBlue(LINER)
are all very small.
3.4. A metallicity effect?
Our Clumpy galaxy sample shows, for most sources, the expected properties of AGN host systems (together with with star formation) on both the MEx and the Blue diagnostics. However, an alternative explanation for high [Oiii]/Hβ flux could be a low gas phase metallicity (e.g., McGaugh 1991). Theoretically, the disk instability as-sociated to clumpy morphologies is interpreted as being linked to the infall of fresh, low-metallicity gas (see in-troduction, DSC09 and Bournaud & Elmegreen 2009), so these systems could a priori be metal-defficient. Nev-ertheless, simulations indicate that the gas is rapidly en-riched in the dense star-forming clumps. Analysis of cos-mological simulations from Ceverino et al. (2010) gener-ally reveals solar metallicity in the clumps and margingener-ally lower metallicities only in the inter-clump gas, typically one-third to half solar. Also, observations of clumpy galaxies at z ∼ 2 do not find them to be metal-deficient (e.g., Genzel et al. 2008; Bournaud et al. 2008).
As for our own sample of galaxies, the MEx diagnos-tic (Table 1) indicates that the probability to have the strong [Oiii] excitation caused by a low metallicity ef-fect is, in general, quite lower than the AGN probabil-ity. These probabilities are calibrated on SDSS galaxies at z < 0.1 (J11), however the redshift evolution of the mass-metallicity relation up to z ∼ 0.7 is not sufficient to explain the high [Oiii]/Hβ ratio that we observe in Clumpy disks. For the mass range that we consider here, the typical variation of 12 + log(O/H) from z < 0.1 to
z ∼ 0.7 is at most 0.1-0.2 dex, as shown by the Gemini Deep Deep Survey at 0.4 < z < 1.0 by Savaglio et al. (2005). These authors found a slow evolution of the mass-metallicity relation with redshift at z < 1, ex-cept for lower-mass galaxies (see also Cresci et al. 2012 on the limited evolution of the mass-metallicity below
redshift one). The corresponding variation of R23 =
([Oiii]λλ4959, 5007+[Oii]λλ3726, 3729 / Hβis not larger
than 0.1 dex (using for instance the R23-metallicity
re-lations from McGaugh (1991) at fixed ionization param-eter). This possible redshift evolution is insufficient to strongly affect the position of our samples on the MEx diagram, nor the computed AGN probablities, and is ac-tually well within the assumed uncertainties. The com-parison to the Stable disk sample at similar redshift con-firms that the high [Oiii]/Hβ ratios do not result from redshift evolution in the mass-metallicity relation in the studied mass range, as such an effect would affect both samples.
Furthermore, Clumpy galaxies are different from purely star-forming galaxies of any metallicity in the
SDSS. This is shown by the (R23;O32) diagrams (Fig. 11),
where R23=([Oiii]λλ4959, 5007+[Oii] λλ3726, 3729)/Hβ,
and O32=[Oiii]/[Oii]. The position of our Clumpy and
Stable disk samples is compared to SDSS galaxies iden-tified as star-forming, composite, LINER and Seyfert 2 on the BPT diagnostic (following the analysis performed
in J11). The high R23 values for Clumpy galaxies come
along high O32 ratios. Note that high values of R23 do
not trace low gas-phase metallicities in case of AGN exci-tation. Most Clumpy disks occupy the region of the pa-rameter space best represented by Seyfert 2’s, and do not have the properties expected for star-forming galaxies of any metallicity, or for LINER excitation. Here again, the redshift evolution of the mass-metallicity relation in the studied mass range cannot explain this effect. Purely star-forming galaxies in our mass and redshift range lie
almost exclusively in the R23<5 and O32<1 area of the
(R23;O32) diagram, whatever their metallicity (as also
shown by Savaglio et al. 2005). The majority of Clumpy
disks have higher R23 and O32ratios, and are hence
dif-ferent from purely star-forming galaxies of any metallic-ity.
3.5. [NeIII]λ3869 excitation
A few other AGN diagnostics based on optical lines have been proposed in the literature (e.g. Yan et al.
2011). A particularly useful one to complement the
MEx diagnostic, given the spectral coverage available for our sample, is the recently proposed TBT diagnos-tic (Trouille et al. 2011) that compares the [Neiii] λ3869 /[Oii] excitation to the (g − z) rest-frame color. This diagnostic typically requires to probe [Neiii] /[Oii] ratio of the order of 0.1 or greater: the spectral data available for our sample are not sensitive enough for this in indi-vidual targets, but the [Neiii] line is robustly detected in stacked spectral data.
The TBT diagram for our Stable Disk and Clumpy Disk samples is shown on Figure 13: we find that Sta-ble Disks are dominated by purely star-forming systems, while a larger fraction of Clumpy Disks (but not necessar-ily all of them) should contain AGN, resulting in average properties on the AGN side of the AGN/SF limit defined by Trouille et al. (2011). It is expected from the MEx
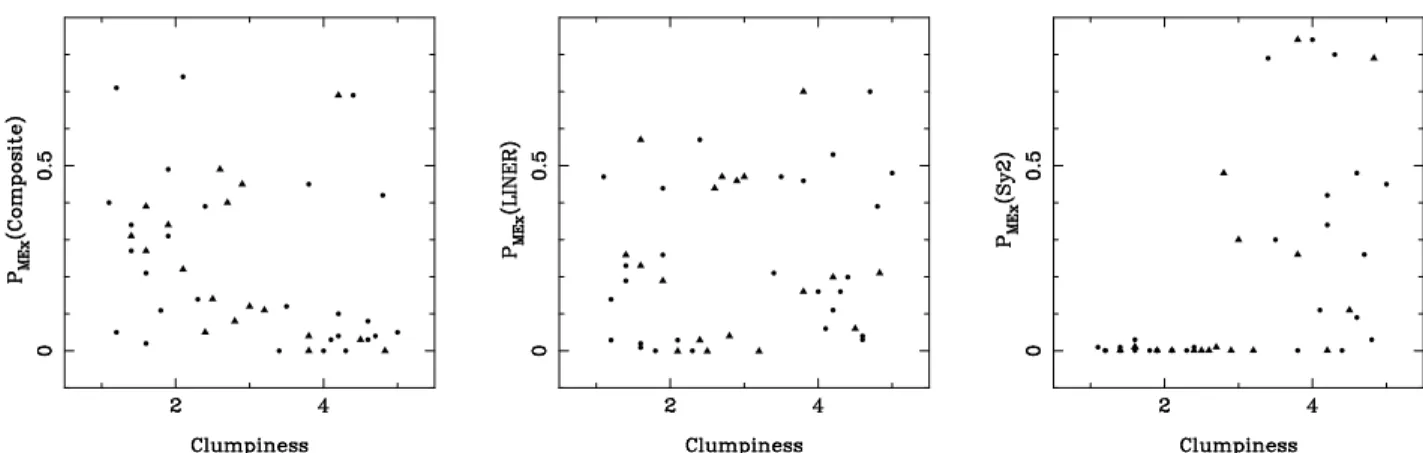
di-Fig. 12.— AGN probability versus Clumpiness value for Composite types (left), LINER types (middle), and Seyfert 2 types (right), using visual clumpiness values (circles) and automated clumpiness measurements (triangles). AGN probabilities in this figure are based on the MEx diagnostic. We indicate the corresponding linear correlation coefficients, and those based on the Blue diagram, in Table 3.
Fig. 13.— TBT diagram for Clumpy and Stable disk samples (mean stacking) and for similar sub-samples weighted by the MEx-based probability to host AGN (for Clumpy disks) or to be purely star-forming (for Stable disks).
agnostic that not all Clumpy disks have optical line exci-tation dominated by AGN, and hence that their average properties are intermediate between purely star-forming galaxies and AGN-dominated ones, as found here on the TBT diagram.
To further confirm the presence of AGN in many Clumpy galaxies, we have studied the stacked data for the Clumpy Disk sample with statistical weights
pro-portional to PMEx(AGN ), the MEx-based probability of
containing AGN, for each object. The idea is equiva-lent to selecting only the objects most likely to contain AGN among the Clumpy sample, improved by the use of statistical weights. The results are shown on the TBT diagram (Fig. 13), and the weighted data are clearly in the TBT-AGN region. Hence, while the whole sample of Clumpy Disks has intermediate properties suggesting a mix of star-forming and active galaxies, the Clumpy disks identified as likely AGN hosts by the MEx diagram are confirmed to be dominated by AGN with the TBT di-agram. Conversely, the stacked data for the Stable Disk
sample weighted by PMEx(SF ) = 1 − PMEx(AGN ), i.e. a
weighted selection of Stable Disks supposed to be likely purely star-forming according to the MEx, lie clearly in the TBT-SF region on Figure 13.
3.6. Quantitative correlation between AGN probability
and Clumpiness
We now consider the quantitative correlation between AGN probability and Clumpiness for all individual ob-jects, independent of the classification in two sub-samples of Clumpy and Stable disks used previously.
We compare on Figure 12 the AGN probabilities of our objects to their visual and automated Clumpiness esti-mates. This is done for the three considered AGN types separately (Composite, LINER and Seyfert 2). This ex-periment was also performed for combinations of AGN types (such as LINER+Seyfert 2, etc), considering either the MEx diagnostic or the Blue diagram, and either the visual or the automated clumpiness estimates. In each case we determined the linear correlation coefficients a, b and r for:
P (AGN) = a × C + b ± r (1)
where P (AGN) is the AGN probability for the consid-ered AGN type, C is the clumpiness value, and r is the Pearson correlation coefficient. Results are given in Ta-ble 3.
The global correlation between AGN probability and clumpiness is dominated by Seyfert 2-type activity: the Seyfert 2 probability vs. clumpiness correlation is the tightest one and drives the global AGN probability vs. clumpiness correlation, much more than LINER and composite types. This result is independent of the diag-nostic used (MEx or Blue diagram) and preferred
clumpi-ness measurement (visual or automated). The most
clumpy objects have spectral properties that are weakly more typical of Composite galaxies compared to the less clumpy ones, and not more typical (or even less typical) of LINER galaxies, but they clearly have spectral prop-erties that are more typical of Seyfert 2-like activity.
These results confirm the previous conclusions, inde-pendent of the chosen clumpiness threshold used to sep-arate the Clumpy and Stable sub-samples, and of the reliability of visual clumpiness estimates. Furthermore, the fact that the strongest correlation is obtained when Seyfert 2-type activity alone is considered, and the ab-sence of a significant correlation between LINER activ-ity and clumpiness, confirms that the observed activactiv-ity in clumpy galaxies corresponds to BH accretion, rather than shock-induced excitation or low-metallicity star for-mation that might have resulted in LINER-like spectral properties – which was unlikely, as supported by the pre-vious discussion on the evolution of the mass-metallicity
TABLE 3
Linear correlation coefficients between visual/automated clumpiness values and AGN probability, for various combinations of AGN types.
AGN type(s) MEx Blue
a b r a b r
Using visual clumpiness:
Composite + LINER + Seyfert 2 5.64 45.3 0.05 8.31 33.6 0.16
Composite + Seyfert 2 3.46 29.6 0.04 10.4 22.6 0.37
LINER + Seyfert 2 13.0 1.90 0.26 16.8 -14.4 0.39
LINER 2.16 15.8 0.02 -2.07 11.0 0.06
Seyfert 2 10.81 -13.9 0.31 18.9 -25.4 0.47 Using automated clumpiness:
Composite + LINER + Seyfert 2 8.21 54.9 0.55 2.19 46.8 0.07
Composite + Seyfert 2 9.35 11.8 0.17 8.30 26.3 0.28
LINER + Seyfert 2 14.49 -0.9 0.18 14.20 -11.9 0.39
LINER -1.13 28.2 0.01 -6.11 24.5 0.45
Seyfert 2 15.63 -29.07 0.57 15.49 -29.4 0.57
relation.
It appears on Figure 12 that low-clumpiness galaxies have Composite-like properties rather than Seyfert 2-like properties, suggesting that if they contain AGN, these are lower-luminosity ones that do not dominate the [Oiii]/Hβ ratio compared to star formation, as op-posed to Clumpy disks where the [Oiii]/Hβ ratio can be AGN-dominated, leading to high Seyfert 2-like inte-grated probabilities.
3.7. Summary: optical line properties of Clumpy AGN
candidates
Clumpy galaxies show a much higher [Oiii] excitation than Stable disk galaxies in the same mass and redshift range. Comparisons with the properties of [Oii] and [Neiii] indicate that this trend is unlikely to be caused by metallicity effects in purely star-forming galaxies, and that the AGN fraction should be higher in Clumpy galax-ies instead. Using the MEx diagnostic, not all Clumpy galaxies need to contain AGN, but many of them have a high AGN probability and the AGN probability corre-lated with both visual and quantitative estimates of the clumpiness. Similarly, some Stable disks may contain AGN, but the estimated fraction is significantly lower.
We list the average [Oiii], [Oii] and Hβ luminosities for both samples in Table 4. Overall, Clumpy disks have an Hβ luminosity higher by about 20% than Stable disks, but their [Oiii] luminosity is higher by a factor five. This is not directly representative for the properties of the hosted AGN because some objects in the Clumpy sam-ple are unlikely to host AGN, and vice versa. To better probe the properties of active clumpy disks, we have de-fined a “Clumpy AGN” sample, for which average prop-erties are measured over our Clumpy disk sample with
statistical weights equal to PMex(AGN ), i.e. we give the
highest weights to the systems that are the most likely to contain AGN. Conversely, we defined a “Stable SF disk” sample, which corresponds to the Stable disk sample with statistical weights proportional to the MEx probability of being purely star-forming. This allows a more relevant estimate of the properties of AGN hosted by Clumpy disks (see Table 4). In particular, the typical [Oiii]
lumi-nosity of Clumpy AGNs is 2.1 ± 0.2 × 1041erg s−1. This
is ten times larger than in Stable SF disks, a result con-sistent with the more general properties of AGN hosts and star-forming galaxies in the SDSS (kauffmann et al.
2003), and suggesting that ∼ 90% of the [Oiii] luminosity in Clumpy AGN comes from the AGN itself.
Hence, the average AGN luminosity in the clumpy
AGN candidates is L[Oiii],AGN≈1.9 ± 0.2 × 1041erg s−1
– corrected for the minor contamination by star forma-tion, but not corrected for dust extinction. This
sug-gests an average bolometric AGN luminosity Lbol,AGN≈
2 × 1043 erg s−1(e.g. Netzer 2009) for the Clumpy disks
with high AGN probabilities.
The average Hβ luminosity is slightly higher in the Clumpy AGN sample compared to the Stable SF one, by about 25%. Given that Clumpy disks have slightly lower SFRs (Section 2.4), this indicates that about one third of the Hβ luminosity in Clumpy AGN systems is powered by the AGN. The powering of the Hβ luminosity by star formation is thus about similar in Clumpy and Stable disks, with an extra contribution to the Hβ flux in Clumpy AGNs.
4. X-RAY STACKING
4.1. X-ray properties of individual sources and stacking
AGN candidates in unstable disk galaxies are expected to have modest X-ray luminosities and significant obscu-ration by the high ISM column densities. They could thus be generally to faint to be individually detected even in deep Chadra surveys, especially in the hard band (B11). Indeed, only one object in our sample, C10, is a known hard X-ray selected AGN (Alexander et al. 2003; Xue et al. 2011). Several other sources are detected in the soft X-ray band of Chandra data (0.5-2keV), but in general with a signal-to-noise ratio that is too low to firmly distinguish between emission from an AGN or SF, both the soft X-ray luminosity and the star formation rate being relatively uncertain in these individual objects – object C1 has a robust soft X-ray excess compared to its SFR, according to the Ranalli et al. (2003) relation, though.
To confirm the high AGN frequency in clumpy galax-ies, we performed mean X-ray stacking as in, e.g., Worsley et al. (2005) and Daddi et al. (2007). All of our targets lie within 8’ from the Chandra aim point in the CDFS, 80% of the sources being within 6.5’, and the me-dian distance from the aim point being 4.3’, where the sensitivity is relatively homogeneous (relative variations below 25%). No target lies within the Chandra PSF of a close (in projection) X-ray source. For each source, the
TABLE 4
Optical line, X-ray and infrared luminosities for various sub-samples. We indicate mean values or values from mean stacking. Optical lines luminosities are uncorrected for dust extinction. Luminosities are in erg s−1, except L
IRin L⊙. Mean luminosities Stable SF disksa All Stable disksb All Clumpy disksc Clumpy AGN disksd
L[OIII] 2.1 ± 0.5 × 1040 2.9 ± 0.4 × 1040 1.5 ± 0.1 × 1041 2.1 ± 0.2 × 1041 L[Hβ] 3.3 ± 0.4 × 1040 3.5 ± 0.4 × 1040 4.3 ± 0.6 × 1040 4.1 ± 0.5 × 1040 L[OII] 3.2 ± 0.8 × 1040 3.8 ± 1.1 × 1040 6.9 ± 1.2 × 1040 7.3 ± 1.1 × 1040 LX, 0.5−8keV rest. 1.0 ± 0.3 × 1041 1.2 ± 0.3 × 1041 4.2 ± 0.4 × 1041 5.1 ± 0.6 × 1041 LX, 2−10keV rest. 0.6 ± 0.4 × 1041 0.7 ± 0.4 × 1041 2.6 ± 0.8 × 1041 3.0 ± 0.8 × 1041 LIR 5.0 ± 0.5 × 10¹⁰ 5.2 ± 0.4 × 10¹⁰ 4.5 ± 0.6 × 10¹⁰ 4.8 ± 0.7 × 10¹⁰ aStable disk sample with (1 − P
MEx(AGN )) weights applied to each object to compute average values and to stack X-ray and infrared data, hence statistically selecting objects that have the highest probabilities to be purely star-forming.
bEntire Stable disk sample with equal weights for each object – including the few with high AGN probabilities. cEntire Clumpy disk sample with equal weights for each object – including the few with low AGN probabilities. dClumpy disk sample with P
MEx(AGN ) weights applied to each object to compute average values and to stack X-ray and infrared data, hence statistically selecting objects that have the highest probabilities to be clumpy AGN hosts.
X-ray data were multiplied by a factor proportional to the square of the luminosity distance – stacked results without this correction factor were also examined and yield similar results. The stacked data, presented in Fig-ure 14, were also normalized to the number of sources per sample.
4.2. Stacked X-ray detections
In the soft X-ray band (0.5–2 keV), X-ray stacking
yields a 4.5-σ detection5for the Stable disks sample, and
a 3.7 ± 0.2 times larger signal for the sample of Clumpy galaxies. The stacked signal is not dominated by the few most luminous systems in soft X-rays: the results are similar if we select randomly only half of the galaxies in each sample. Hence the factor of ≈ 4 soft X-ray excess is a general property of our whole Clumpy galaxy sam-ple, not just of a few outliers within this sample. In the hard band (2–8 keV), there is no detection for Stable disks, and only a marginal detection for Clumpy disks. The stacked data show a 3.5-σ detection but a single ob-ject (C10, which is the individually detected source) con-tributes 35% of stacked the signal and rest of the sample gives only a 2.4-σ signal.
There is thus a higher X-ray luminosity in Clumpy galaxies than in Stable disks. The hard/soft count ratio for Clumpy disks is H/S ∼ 6.5 if the stacked signal in the hard band is robust – conservatively, this is rather an upper limit. In the following we assume a spectral slope Γ = 1.2 ± 0.5 for luminosity conversions, consis-tent with this (uncertain) H/S count ratio and typical for AGN that are relatively obscured but not Compton Thick (e.g., Alexander et al. 2003, J11). The comparison of [Oiii] and X-ray luminosities in our sample is indeed consistent with such substantial obscuration (see Sec-tion 5.4). The stacking results indicate an average X-ray
luminosity LX(2−10keV rest.)= 2.6 ± 0.8 × 1041erg s−1 for
Clumpy galaxies, versus 0.7 ± 0.4 × 1041erg s−1for Stable
disks, both values being uncorrected for absoprtion (see Tabel 4).
4.3. Star formation rate and X-ray excess
The X-ray luminosity of Clumpy galaxies is almost four times higher than that of Stable disks, but their star for-mation rates are not higher. They have somewhat higher
5σ being measured from the background pixel-per-pixel fluctu-ations
sSFRs, but lower stellar masses too, and their absolute SFR was found to be slightly lower than that of Stable disks (from SED fitting and 24 µm fluxes, Section 3.4, also consistent with Hβ luminosities once corrected for AGN contribution, Section 3.7).
SFR estimates from individual detections at 16 and/or
24 µm are on average 7.5M⊙yr−1for Stable disks,
corre-sponding to LX/SF R ≃ 9 × 1039erg s−1/M⊙ yr−1,
sug-gesting X-rays in these systems trace mostly star for-mation (Ranalli et al. 2003; Grimm et al. 2003). In
de-tail, this LX/SF R ratio is somewhat above the main
trend defined by Ranalli et al. 2003, suggesting that there might be weak AGN in some of the Stable disks,
consistent with the MEx results. The average SFR
estimate in Clumpy disks, at 6.1M⊙ yr−1, results in
LX/SF R ≃ 4 × 1040erg s−1/M⊙ yr−1, indicating an
X-ray excess in these systems, by a factor > 5 compared to the X-ray luminosity expected from their star formation activity using the Ranalli et al. relation.
However, not all targets are individually detected at 16 or 24 µm. Therefore we stacked the 16 and 24 µm Spitzer data for our two samples of galaxies. Here we ap-plied the same weighting with luminosity distance as for the X-ray stacking, but also checking that un-weighted stacking gives similar results, and normalizing stacked data to the same number of object per sample. The re-sults are shown on Figure 14: note that some infrared sources relatively close to our targets do appear on the stacked images, especially at 24 µm, but none of our tar-gets lies within the Spitzer PSF of another identified in-frared source, and flux ratios between our two samples were measured within the FWHM of the PSF to avoid contamination.
The results clearly show that there is no 24 or 16 µm excess in Clumpy galaxies. Instead, their stacked signal is 32±4% lower at 16 µm and 23±3% lower at 24 µm than that of Stable disk galaxies. 24 µm are not proportional to star formation rates in a redshift-independent way. Here the main bias between the two samples would result from the highest-redshift objects being Clumpy ones at z ≃ 0.85, where PAH lines are redshifted in the Spitzer 24 µm band and increase the observed flux at fixed SFR. This may explain why the Clumpy-to-Stable flux ratio is somewhat higher (smaller than unity but closer to unity) at 24 µm than at 16 µm – a small effect that could only strengthen our conclusion.