HAL Id: hal-01847608
https://hal.archives-ouvertes.fr/hal-01847608
Submitted on 8 Nov 2019
HAL is a multi-disciplinary open access
archive for the deposit and dissemination of
sci-entific research documents, whether they are
pub-lished or not. The documents may come from
teaching and research institutions in France or
abroad, or from public or private research centers.
L’archive ouverte pluridisciplinaire HAL, est
destinée au dépôt et à la diffusion de documents
scientifiques de niveau recherche, publiés ou non,
émanant des établissements d’enseignement et de
recherche français ou étrangers, des laboratoires
publics ou privés.
Controlling powdered fuel combustion at low
temperature in a new entrained flow reactor
Laurent van de Steene, Sylvain Salvador, Georges Charnay
To cite this version:
Laurent van de Steene, Sylvain Salvador, Georges Charnay. Controlling powdered fuel combustion
at low temperature in a new entrained flow reactor. Combustion Science and Technology, Taylor &
Francis, 2000, 159, p. 255-279. �10.1080/00102200008935786�. �hal-01847608�
Controlling Powdered Fuel Combustion
at Low Temperature in a New Entrained
Flow Reactor
L. VAN DE STEENEa, S. SALVADORb' and G. CHARNAVC
BTechnip,63 - 65Avenue Tony Gamier - 69366 Lyon Cedex 07 - France, bEcole des Mines d'Albi- Carmaux, Centre Energetique et Environnement, Cam-pus Jar/ard, Route de Teillet, 81013 Albi Cedex 09 - France and "tnstitut de Mecanique des Fluides de Toulouse, CNRS.INPTIUPS, Avenue de Professeur Camille Soula, 31400Toulouse - France
If low temperatures of 800-IOOO·C are used for the combustion of powdered solid fuels (coal or waste) energy canbeproduced while at the same time emissions of atmospheric pollutants are mini-mised. We have developed and precisely characterised an apparatus to determine the kinetic parame-ters of the potentially lintiting reactions (devolatilisation and solid residue oxidation) involved during high heating-rate combustion. The gas phase chemical composition, and structural changes in parti-des accompanying the combustion can alsobefollowed. Calculation of characteristic time constants and simulation by Computational Fluid Dynamics were necessary to establish heat and mass transfer conditions in which intrinsic kinetic parameters can be assessed with a maximum accuracy. An experimental parametric study of a bituminous coal combustion then demonstrates the accuracy that could be reached. The individual effects of devolatilisation temperature, of atmosphere oxygen con-tent and of particles diameter on the combustion progress are quantitatively characterised.
INTRODUCTION
The standard method of reducing NOx emissions from industrial furnaces is to adopt staged combustion. Fuel staging or air staging produce better stoichiomet-ric conditions and average combustion temperatures of between 800 and lOOO°C. The combustion time of fuel particles is consequently greatly increased, to reach several seconds. This is the case with modem cement plant precalciners. These furnaces, that typically bum several tonnes per hour of solid or liquid pulverised fuels, use air staging to reduce their NOx emissions by 40%. Modelling this
bustion situation with Computational Fluid Dynamics packages (CFD) requires specific kinetic data. The heating conditions and the final temperature largely interact on the chemical nature as well as the yields of volatiles during devolatil-isation, and the nature of the solid residue. Thermogravimetric analyses (TGA) and differential thermal analyses (DTA) fail to experimentally reproduce the thermal history and heat/mass transfer conditions around each particle in pow-dered fuel furnace conditions. This led numerous authors to study the "in flow" combustion of solid particles dispersed in a gas phase. Various specific equip-ment, usually termed "entrained flow reactor" or "drop tube" have been devel-oped (Beck, Hayhurst, 1990; Costa and ai, 1991; Helble and ai, 1996; Kramlich and ai, 1988; Lester and al, 1993; Liu and al, 1997; Seeker and al, 1981; Thers-sen and ai, 1995; Ten Brink and al, 1996; Gadiou, 1990).
Using full two phase flow modelling, we have designed, built and improved an experimental apparatus to study pulverised solid fuel combustion at low temper-ature (up to 1050°C), with long residence times (up to several seconds) and in an atmosphere where O2concentration is precisely controlled.
We describe the final design of the apparatus and give detailed considerations of how to calculate, technologically realise, and experimentally verify accurate control of independently adjustable combustion parameters: oxygen availability around each particle, thermal history, particles residence time and particles diam-eter.
We show that particular attention has to be paid to the apparatus conception, so that both particles residence time and heat/mass transfer from the carrying gas (atmosphere) to each individual particle can be controlled with acceptable accu-racy. We experimentally checked that a cloud effect was not present. These pre-cautions were found to be necessary for repeatable and reliable kinetic parameters to be derived.
DESCRIPTION OF A NEW ENTRAINED FLOW REACTOR
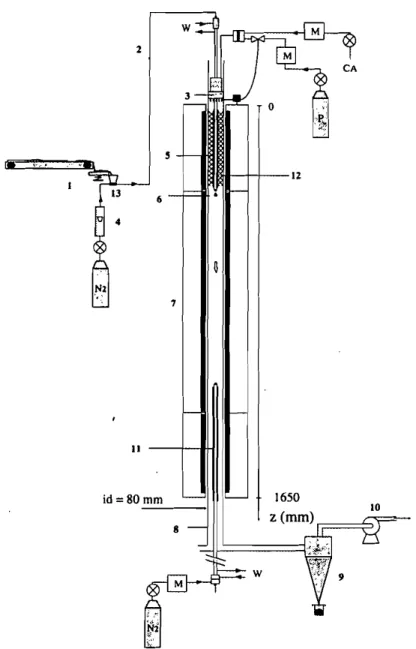
A preheated downward flow of 021N2 mix traverses a 2 m long, 80 mm i.d, quartz tube reactor. The flow temperature is kept constant with a three-zone elec-trically heated furnace. A continuous flow of particles is fed and dispersed at the top of the reactor, and is carried by the gas mix sweeping the reactor at a control-led velocity. Figure I gives a diagrammatic representation of the facility.
The apparatus (Figure 2) is fitted with two alternative generators to supply pre-heated gas. As suggested by Beck and Hayhurst, 1990, Therssen and al, 1995, Vantelon and ai, 1986, we have installed a multi-flame burner (Van de steene and al, 1998 (a), 1998 (bj), Each flame is stabilised on one of the 150 l-mm diameter
: Atmosphere, Velocity and
Temperature control
I I
. .
•
•
•
•
•
•
•
.
.
•
•
•
•
• •
•
•
•
•
•
•
•
•
•
•
•
Isothermal and laminar 2-phase flow
Solid fyel injection:
- Regular low mass flow rate
- Good dispersion
- - - - + - - - (
- Mono disperse particle
Rapjd yp of particles
. - Isokinetism - Quenching
.... Residence time control
FIGURE 1 Diagrammatic representation of the facility
holes of a 78-mm diameter ceramic plate. Each flame is approximately one cen-timeter long. An air/propane mixture is mixed and supplied to the reactor section through two successive perforated discs and the ceramic plate. The oxygen con-centration in the gas is adjusted by mean of the air and propane flow rates to the burner. The atmosphere generated is similar in composition to combustion cham-bers gases in terms of H20 and CO2concentrations. The disadvantage of this technique is that the oxygen concentration in the gas was limited to values between 4 and 8%.Additionally, water vapor condensation on water-cooled sur-faces resulted in feeding probe plugging and in sampling difficulties.
6
7
II
id
=
80 mm - - - - IFIGURE 2 Schematic diagram of the apparatus. (I) Conveyor belt/vibrating channel/ejector; (2) Pneumatic transport; (3) Propane/air burner; (4) Flow meter; (5) Water cooled feeding probe; (6) Dispersion cone; (7) Three-zone electrical furnace; (8) Quartz tube reactor; (9) Cyclone collector; (10) Exhaust fan; (II) Isokinetic water cooled nitrogen quenched sampling probe; (12) Stainless steel wool forOzlNzmix healing (no burner configuration); (13) Ejector. M-Mass flow meter/controller; P-Propane; Nz-Nitrogen; CA-Compressed Air; W-Water (probes cooling)
In a second configuration, the burner is not lit but just feeds an air/nitrogen mix. A simple and efficient technique to preheat this mix has been developed: the entire volume of the reactor along the first furnace zone is filled with stainless steel wool. The carrier gas is forced through this medium, which is heated effi-ciently through the quartz tube by radiation from the heated elements outside the reactor. The temperature of the carrier gas is controlled by the first furnace zone. Whatever the atmosphere generator used, the two mass flow meters/controllers were set to give a precise control of oxygen concentration in the atmosphere gas. The gas flow sweeping the quartz tube is maintained isothermal by an external power supplied by an electrically heated furnace to the three independently con-trolled heated zones. Control thermocouples are located outside the quartz tube, positioned half way up each heated element.
Narrow size ranged particles (30-50 11m /80-100 11m 1160-200 11m diameters) are injected in the isothermal flow through a water-cooled feeding probe at a transport velocity close to reactor flow. A reactor flow velocity not exceeding 1.5 m1s (hot flow) allows the establishment of a laminar flow, which is essential to residence time calculation, as discussed later.
Davies (1985) gives a synthesis of available technologies to generate a contin-uous regular particle concentration. A vibrating membrane (loudspeaker) can also be used to fluidise a powder (Therssen and ai, 1995). We successfully used a simple proportioning device consisting of a low velocity conveyor belt (1.66 mmls) to ensure a low fuel mass flow rate(I g/rnin feeding). The belt is fed from a separately prepared V-shaped rail along which a precisely weighed quan-tity of fuel is regularly spread using a calibrated wedge. The conveyor belt tends to deliver packs (when using sticky powders); the flow is perfectly smooth after it has crossed a vibrating channel (25 ern long in our case). The powder is then driven through a funnel into an ejector, and carried to the reactor by pneumatic transport in a 4-mrn i.d. tube using 2 l/rnin of N2. The funnel, the ejector and pneumatic transport tube are integrated with the vibrating, which efficiently sup-presses any deposition of the powder between the vibrating corridor and the feeding probe.
As discussed later, particle dispersion in the reactor section is a key to non-interaction; for this purpose we used a 10 mm-diameter stainless-steel cone located a few rnillimetres below the injection point (see figure 1). The fresh gas sweeping this dispersion device maintains its temperature low enough to avoid fuel sticking.
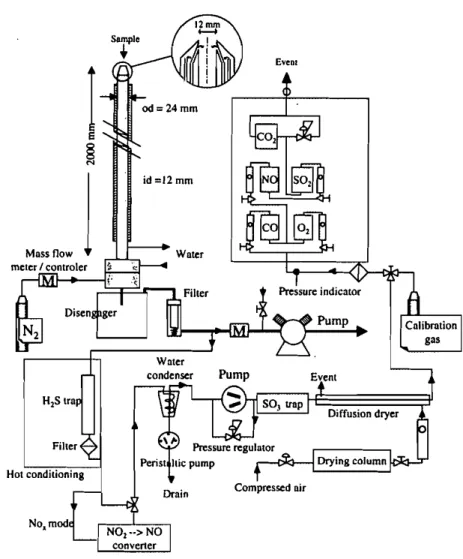
The termination of particle thermal history is achieved by collecting particles inside a two-meter long water-cooled nitrogen-quenched 14-mrn i.d. sampling probe. The sampling system is sketched in figure 3. Cooling water was brought to the probe top by four 1 mm-inside diameter stainless steel tubes. Nitrogen
1
id =12 mm Drain E'VeOI Compressed air Diffusion dryerFIGURE 3 Schematic diagram or gas/particles sampling system and continuous gas analysis
dilution is ensured by the injection of four micro jets 10 mm downstream the top of the sampling probe.
Gases sampled at different heights in the reactor were continuously analysed in terms of 02' CO, CO2, NO, N02 and S02' Two analysers were used. The first (Servomex) is equipped with infrared absorption cells for CO, CO2, NO, S02 concentration measurements and a paramagnetic cell for 02' Alternatively, a 400°C furnace was used to convert N02 to NO. Measurements were compared
with those obtained from a Testotherm analyser, which uses the principle of elec-trochemical cells.
Water in the sampling probe or in downstream ducts and equipment can dilute part of the N02 or S02 of the sample, and lead to erroneous quantification. Nitrogen dilution of the sample as soon as it enters the sampling probe avoids water condensation by decreasing the dew point temperature. Only part of the sample gases + dilution nitrogen is analysed. Water vapor is removed down-stream (before analysing) by a condenser and an additional diffusion dryer (sam-ple conditioner). The nitrogen flow and nitrogen + sam(sam-ple flows are separately measured by two mass flow meters / controllers. This allows isokinetic sampling together with precise correction of the chemical species concentrations in order to calculate concentrations before N2 dilution. A 120°C-heated line is used as a connection between the sampling probe and the sample conditioner. Condensa-tion water is recovered, which makes it possible to determine the sulphur and nitrogen contents. The S02 or NOx measurements in the gases are then corrected. The following sections describe considerations of how to control the combus-tion parameters and to derive intrinsic kinetic parameters.
CONTROL OF THE ATMOSPHERE COMPOSITION AROUND EACH FUEL PARTICLE
Precise knowledge of the oxygen concentration surrounding each fuel particle is essential. This value is not constant along the reactor due to oxygen consumption by sample combustion. The assumption of constant concentration (equalling to the average between injection and sampling points) is acceptable only if oxygen depletion is not significant. As shown in figure 16, we have measured a fall in oxygen concentration of several%when injecting 1 g/rnin of coal in our appara-tus, for a 900°C reaction temperature. This fuel mass flow rate was adopted as the upper limit in order to satisfy the need for constant concentration of oxygen.
Intrinsic solid oxidation kinetic parameters can be derived only in a situation where oxygen diffusion to the particle surface is not a limiting step. A burning time scale, assuming oxygen diffusion from the atmosphere to the surface to be limiting, can be calculated from (see Rudinger, 1974 and Huang, 1992):
(1) TSh
=
8.D.Sh.Po, .Meo
where D is the mass diffusivity of 02 in N2, Sh=2 (for diffusion mass transfer), and Meo is the molar mass of CO.'Shis the time for the particle's diameter to become zero, assuming that its density is constant, and that it loses mass (as its
diameter decreases) producing two moles of CO when one mole of 02 reaches the surface, following the mass balance:
Here km = and C02Sis the oxygen concentration at the particle's sur-face, fixed at 0 in the case where oxygen diffusion is a limiting step.
Even for low 02 partial pressure (P02=
=
5%) at 900 ·C, the burning time scale remains in the order of 0.03 seconds for a 40 11m particle diameter with typ-ical properties given in the nomenclature, which is one or two orders of magni-tude shorter than observed combustion duration, showing that the diffusion limited assumption is invalid. This is not the case for a temperature above IOOO·C whose reaction time scale is comparable to diffusion limited time scale.Considering now the particle population in the flow raises the problem of potential interaction between neighbour particles. A synthesis of this considera-tion is given by Annamalai and Ryan (1993), who state that only low particle concentrations in the flow enable non depletion of oxygen around a particle by a neighbouring particle. They define a group number G that classifies combustion type versus solid particle density. This classification ranges from isolated particle combustion (G < 0.0 I) to sheath combustion (G> 100) through four different operating conditions. This criterion is particularly important as we are seeking an isolated particle situation. In practice, the calculation of G at various locations along the reactor remains difficult (Stanmore, 1998). Our method of investigat-ing this point was to carry out a set of experiments, varyinvestigat-ing the solid fuel flow rate between 0.05 and I g/min and characterising its influence on combustion weight loss of a coal (figure 4). In the experimental conditions adopted (8 %
°
2, 0.5 m1s flow velocity, 40 and 80 11m particle diameter), we observed negligible influence of particle concentration on the global progress of the reaction, thus confirming an isolated particle situation in which heat or mass transfer between particles is not significant. For a I g/min fuel mass flow rate, the particle loading is 7 g/m3;this can also be expressed as a ratio of the mean distance between two particles to the particles radius of 55.In addition to homogeneous dispersion, the feeding system should ensure an excellent proportioning regularity. This regularity is also a key to stabilising the concentration of gas chemical species during analysis of gases resulting from fuel combustion. As shown in figure 5, we obtained stable species concentration versus time, which validates our proportioning device.
I
I I , I ; -6-80 m I I I I I ! I, """*-40 m I Ii
i , I II
i I :I
! I I r II
, I : I I I , ,i , , I , i I-
I i I,
I
I i r Ii
I I 11 ,:
100 90 80 70 60 SO 40 30 20 10o
0,01 0,1 1CollI8_nde(almln)
10
FIGURE 4 Weight loss during coal combustion versus coat mass flow rate injected for two particle diameters ... ppmNO - - % 0 2 (x10) --ppm SO: --ppmCO 2000 1000 1500 140 '120 100 O2 80 80 40 20
o
__
o
500FIGURE5 Exampleof gaseous species molar fractionregistration versusexperimenttime(s) When using nitrogen as the transport gas, the funnel was kept slightly pressu-rised with nitrogen to avoid air being sucked by the ejector, which would disturb the reactor atmosphere. In any case, experiments have shown that when nitrogen is used instead of air as transport gas, it didn't affect reaction rates during com-bustion in 8 % 02 concentration atmosphere. Using N2 transport gas was never-theless sometimes necessary to stop the formation of a volatile flame stabilised downstream the dispersion cone at the exit of the feeding probe.
1100
T(OC)
1000
900
800
700
0
200
400
600
800
1000 1200 1400 1600
z (mm)
(3)FIGURE 6 Axial temperature profile in the reactor for three furnace operating temperatures (no car-rying gas)
FUEL PARTICLE THERMAL HISTORY
As far as thermal characterisation is concerned, axial and radial temperature pro-files were carried out with a two meter-long stainless steel rod, supporting nine K thermocouples (0.5 mm wire) uniformly distributed throughout the reactor. Figure 6 gives a longitudinal temperature profile along the reactor, while figure 7 represents radial profiles for sections at different heights. Inconclusion, gas tem-perature is constant with an accuracy of±10°C along a I-meter long zone when no carrying gas and no solid fuel is fed.
Cold particles injected into a hot environment are heated by conduction/con-vection and wall radiation. A heat balance of an isothermal body gives the famil-iar result:
Tp - Tpi (
t)
='"--::::3--'-
=
1 - exp-Too - Tpi TNu
The time constantTNufor conduction/convection heating of a solid particle by an isothermal surrounding gas (the time needed to achieve 63.2 %of the gas tem-perature) can be expressed, using the Nusselt number, as:
(4) TNu=
6.Nu.Agas where the Nusselt correlation can be:
-tr-z=8O()
om
_Zf=lSOOnm
850
T(OC)
800
ta8
)I
!
2
•
::h
I!Jti
•
750
700
650
·1
-0,50
0,5
1
(7)AGURE 7 Measured temperatures on different cross sections of the reactor (furnace temperature:
800 'C, no carrying gas)
If we neglect the velocity induced by devolatilisation, the slip velocity (or termi-nal settling velocity) Vgin Reynolds number can be calculated using Stokes law:
V - - pg) (6)
g - 18ttg
For a 40 I.Im particle diameter, and taking 2 as the Nusselt number gives a time constant of 0.0032s (heating rate in the order of 2.5x 10⁵Kls). Should radiation
supply the energy to heat the particle, a characteristic time scale'trcan be defined
Tp - Too __ 0 2
as the time needed for the particle temperature to verify: T o o " It can be calculated by solving the energy balance:
d
)
(d
p)2 4 4
dt(m.Cpj..T»
=
c.4.n."2
.ao.(Too - Tp )In a 900°C furnace, this'time constant is 0.09 s, which is higher (in a ratio of about thirty) than the time constant for pure conduction heating. Radiation is therefore a secondary heat transfer mechanism,
Nevertheless, in the entrained flow reactor, particles are injected with cold transport gas. In order to estimate the actual heating rate resulting from this com-plex situation (mixing of cold transport air with main hot flow under furnace wall
radiation), we used a simple CFD model of the injection zone. The commercial code FLUENT was used; details of simulation conditions are given in the appen-dix. A 900°C hot main air flow is injected in a 900°C wall temperature reactor. The cold feeding probe is insulated with 5 mm-thick refractory wool. We give in figure 8 the temperature history of four inert 40 urn diameter particles injected at different radial positions inside the 4 mm i.d. feeding probe. Particles reach 850°C within 0.3 s, giving an average heating rate of 2800 Kls. This model
shows that the heating rate for small diameter particles is controlled by mixing (of the cold feed air with the main hot atmosphere air) rather than particle heating time scale. For ego 0.0032s yield 250 000 Kls while mixing indicates only 2800 Kls. The classical assumption of sudden atmosphere temperature change at
t=O is not valid. It is probable that classical heating rates in the range 104 to 106K1s adopted in the literature for drop tube and entrained flow experiments were overestimated.Itis experimentally difficult to decrease the rate of cold feed airflow below 2 l/rnin and still maintain an efficient pneumatic transport and par-ticle dispersion. 1.170+03 .j 1.070+03 9.730+02 8.730+02 7.730+02 6.730+02 5.730+02 4.730+02 3.730+02 2.730+02 b)
fceding insulation dlspenion fumau wall
.<OJ
I
dj'
I
.._._._.
nis 0.041 0.21 O.lSl 0.331
- - - _
..FIGURE 8 CFD simulated gas temperature (K) field (a) and particle traces coloured by particle
tem-perature(b)in a half longitudinal section of the particle injection zone and top of the reactor.
Resi-dence time of particles has been reported (See Color Plate I at the back of this issue)
The simulation predicts that a single particle will remain located close to the reactor axis, where the surrounding gas temperatures are lower than in the rest of the reactor. Pyrolysis experiments with N2as the atmosphere gas showed a dif-ferent situation, with more dispersed particle patterns.
Experiments with02+N2atmosphere showed "agitated" particles occupying the whole volume of the reactor. Collisions between particles and particle struc-tural changes during heating, inducing rapid devolatilisation, can partly explain the difference between the model and experiments. It should be noted that a small gas re-circulation zone is formed downstream of the cone, according to the numerical modelling. Simulating particles tracks nevertheless indicated that no particle is entering this zone.
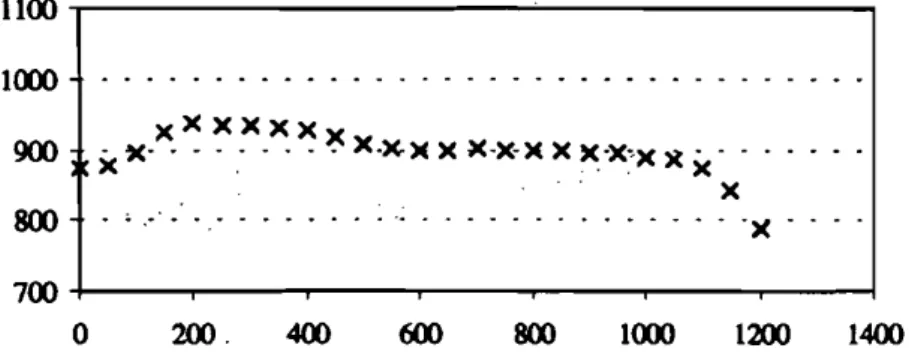
The fuel mass flow rate should not be too high, so that heat release from parti-cle combustion does not increase the average flow temperature significantly dur-ing the constant temperature step of the thermal history. We measured a 50°C overheat in gas temperature when feeding I g1min of coal, as shown in figure 9. This fuel mass flow rate (equivalent to a fuel/air mass ratio of circa 2.2x10⁻³)is again adopted as a maximum value. This temperature field disturbance was effective only in the upper part of the reactor, and the flow temperature then decreased down to the controlled temperature. Itis easy to reduce the overheat by feeding a smaller fuel flow rate; pollutant concentrations in the gas will never-theless be lower and more difficult to analyse continuously. Using an N2/sample volume dilution ratio between I and 2 makes sure that the sampled flow temper-ature falls to values at which reactions stop. The terminal cooling of gases and particle is guaranteed by transportation inside the water-cooled probe.
1000 -900 800 -XXXXXXX - - - - -. - - . . . . . x . .. X X
.... - . . . ..
. .- - -
. .. . . - - .
-
.)( 1400 1200 1000 800 600 400 200 . 700-1---..,,....--...---r---..---...
---.---lo
FIGURE 9 Axial temperature profiles in the reactor when injecting I glmin of coal in a 900'C flnw
Heat transfer between the water-cooled sampling probe and the hot reactor flow is very efficient despite the refractory wool insulation present. Controlling the furnace with a temperature set point is thus not possible when the sampling probe approaches the control thermocouple. We operated a constant electrical power mode in these configurations.
RESIDENCE TIME OF PARTICLES
The flow is laminar along the reactor (reactor Reynolds number <1200).This is confirmed by the shape of a velocity profile at the bottom exit of the reactor using a Hot Wire Anemometer in a cold situation (figure lO(a)). This profile remains simi-lar in a hot gas flow (700 °C) as shown by the Laser Doppler Velocimetry measure-ments presented in figure 1O(b). These measuremeasure-ments also showed a maximum turbulence rate of0.5%(from HWA measurements when no fuel is injected). This flow operating condition is essential for establishing the residence time.
rlR 0,5
o
-0,5
-1 0,0- - - + - - - + - - - - + - - - -....
0,20,4
0,6
0,8
1,0x
v*
0 0 0o
o
X
oX. 0 • • • • • 0 . 0 . 0 0 0 • • • • ·X . . OX OX Ox X • X.. - . - .. 'fl.
lEI· . -Xco
0FIGURE 10v·
= ....:!...-
profiles on a cross section at 2.=1500 mm. (a) Hot wire anemometer meas-Vllmxurements at 20 'C; (b) Laser Doppler Anemometry measurements at 700 "C
The particle dispersion device at the injection point introduces uncertainty about their initial velocity. The time for a particle to reach its terminal slip
veloc-Pg 10-3
ity when -
<
is given by [Bachalo, 1994]:Pp
(8)
Tv
=
-18vg p g
For a particle with a diameter of less than 80 urn, this time is shorter than10-2
Sampling on a small central surface enables a reliable calculation of the resi-dence time to be made from the velocity at the axis. This small surface axial sam-pling also prevents samsam-pling gases that are produced from the combustion of particles being deposited on the reactor walls. It is actually very difficult to cer-tify that no particle has been fixed on the walls, especially when long residence times are aimed at, and with particles whose density can decrease to very low values.
For large diameter particles (diameter> 80 urn), the slip velocity of particles relative to the gas was taken into account (Stokes equation) when calculating the residence time between injection and sampling. It is noteworthy that only where the particle slip velocity is negligible can particles be sampled with the gaseous atmosphere they have generated. When particles slip relative to the gas, there is a time shift between gas and particles residence time at a given location in the reactor. Moreover, taking this slip velocity into account to calculate the particle residence time in the reactor becomes ambiguous when variations in particle structure are considered. Swelling during devolatilisation, the particle diameter can indeed double, as shown in figure II (for the french bituminous coal used in experiments), which also decreases the particles density by a factor of eight. The slip velocity calculated from original particle properties is then erroneous.
The first pyrolysis experiments showed it was particularly difficult to separate, during sampling, tars and solid residue. Filtering particles at the sampling probe exit mixed particles and tars together, leading to largely erroneous determina-tions of devolatilisation reaction progresses. Tars would indeed condense at vari-ous locations, from the sampling probe tip down to the mass flow meters/controllers. We used a disengaging box (see figure 3) in which particles would settle and that non-condensed tar would cross, to condense in downstream filters and pipes.
PARTICLE DIAMETER
We present in figure 12 a typical particle size distribution for an industrial pow-dered fuel. It is of interest to see that small and large particles will show com-pletely different hydrodynamics and thermal situations inside an entrained flow reactor. We have plotted in figure 13 the time constants 'Nu'
'P
'Sh and 'v described previously. The maximum and minimum residence times that can be operated on the apparatus are also represented, together with the slip velocity of particles relative to the gas.For low particles diameters
«
40 urn), the heating time by diffusion'Nuand the time to reach the terminal velocity 'v are more than two decades shorter thanVolume
(%) 108
6
4
2
0
0,11
10100
d
p(1JlIl)
1000
RGUREt2 Typical particle size distribution for an industrial powdered fuel. Particle size rangesfor prepared samples have been masked
the reaction time, leading to an ideal situation in terms of temperature history control. When the diameter approaches 200 11m or higher,'tvbecomes compara-ble with the residence time. The calculation of the actual residence time should then integrate a transient particle acceleration phase at the beginning of the his-tory. Additionally, when the slip velocity becomes significant, and there are potentially large variations with particle property changes (diameter, apparent density) as discussed above, there is a very large uncertainty in the calculation of the residence time for these particles.
Even for particles with diameter as small as 40 urn, oxygen mass transfer is not limiting only if long duration(>Is) experiments are aimed at.
Radiation that has been shown to be a secondary heat transfer mechanism between the furnace walls and small diameter particles becomes nearly as effi-cient as conduction for particles with a diameter of Imm. Increases in Nu or Sh numbers due to the slip velocity of large diameters particles were not taken into account here. They nevertheless do not change 'tNuand'tShvalues significantly. From a practical point of view, samples with particle diameters varying of 20 urn can be prepared with reasonable effort. A pin mill was used to grind solid fuel to 90%<200 urn, and narrow particle-size ranged samples were prepared by pneu-matic sieving: 30-50 11m, S0-100 urn and 160-200 urn as shown in figure 14. These particle sizes cover only part of the total distribution for a typical
indus-Characteristic time (s) or (m1s)
IE+2
IE+I
IE+OIE-I
IE-2
IE-3
IE-4
IE-5
dp(1Hll) 10000 1000 100 10IE-6
... ... ...,o
FIGURE 13 Comparison of heating times, oxygen diffusion time and particles residence time in the reactor for different particle diameters.TNu:Conduction time constant;'tr: Radiation time constant
tSh:Burning time;tv:Time for a particle to reach its terminal slip velocityVg:Slip velocity lmaxand
(min:maximumandminimum residence time inthe reactor
trial fuel; we were not able to process particles smaller than 30 urn that could not be fed and dispersed regularly in the reactor due to sticking phenomena. The homogeneity of the sample and the absence of very small particles that could remain adhering to larger particles were checked by SEM observation as shown in figure 14.
EXPERIMENTS
All experiments were carried on with a bituminous coal. Its characteristics are given in the appendix. Samples with narrow particles size ranges, 30-50!-lm and 160-200!-lm. were prepared by grinding, drying and pneumatic sieving. The weight loss of particles has been determined using the ash tracer method.
A first set of experiments has been carried on with nitrogen as the atmosphere gas. This configuration is the more simple one, where only particle heating and
0.3 0,35 time (8) 0.25 0.2 0.15 0,1 , ,'. 0,05 ... , A,:·,,: -.' .: '.'
:£':--:':-.- ".'_-:':'.-:'.-:'.'
.'
.' ... - - ... 70 60 50...,
j
40..
l
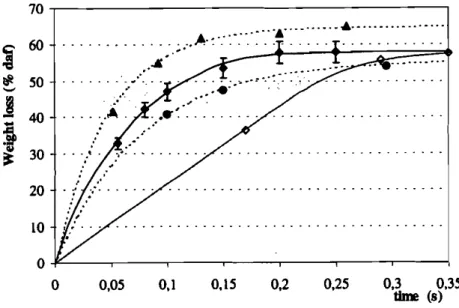
30 20 10 0 0FIGURE 15 Weight loss during devolatilisation versus time in nitrogen atmosphere: 'for 30-50 11m particle diameter at800 'C (_). 900'C (_) and 1000 'C (A) gas temperature - for 160-200 11m par-ticle diameter at900'C (0) gas temperature
diameter ones, This delay is in good agreement with the time constant for parti-cle heating (by convection) calculated above,
In a second set of experiments, an oxidising atmosphere has been used, bring-ing into play the reactions of volatiles oxidation and char residue oxidation, The plots of experimental results in figure 16 show that after the devolatilisation duration, 0.2s, the weight loss evolution shows a new lower slope, that can be attributed to char oxidation, In this sense, mass losses resulting from the devola-tilisation are significantly higher than in the case of nitrogen atmosphere experi-ments,
The oxygen content of the atmosphere has a strong effect on burning veloci-ties; with 5% oxygen, only 70% of the solid combustion is achieved after 1,3s, The evolution of oxygen content along the reactor shown in the same figure con-firms the possibility to maintain the value within a zone smaller than 3%. The rapid mass loss of the solid at the beginning of the experiment appears to be linked with a rapid oxygen content decrease: the volatiles oxidation has conse-quently been rapid,
.---.--- 6 4
- - - _ . _ - - - +
---_._---_.-+
F - - - .-0,15 0,30 0,45 0,75 1.04
FIGURE 16 Weight loss (full symbols) of 30-50 11m particle diameter and oxygen content in gas (empty symbols) during combustion in an oxidising atmosphere. Gas temperature: 900 'C, and initial oxygen content: 5%(',').10% (_'D)and 20% (A.!»
CONCLUSION
The experimental investigation of intrinsic reaction kinetic parameters for com-bustion of solid particles remains a delicate task. Accurate control of the thermal history of the particles' environment seems possible, despite the fact that the par-ticle heating rate at injection, which is known to be a determining factor, was not controlled in our apparatus. It was estimated from CFD modelling, which showed that heating rates in the range 104_106Kls (or higher), usually expected from drop tube or entrained flow experiments, are over-estimated. The average oxygen concentration in the flow could be controlled within +/- 1.5 % vol. together with burning sufficient fuel quantities (Ig1min) in order to continuously analyse gas from the I.R. analysers. Residence time as high as 3s could be oper-ated without particle deposition on the walls. Very small particles
«
30 urn) could not be processed for handling reasons. A time constants comparison for particles with different diameters shows that for drop tubes and entrained flow reactors, an ideal situation in terms of thermal history control and of no externalheat and oxygen transfer limitation can be reached only by processing small par-ticles
«
50 urn) and long duration experiments (>0.5 s). For larger particles (100 to 200 urn diameter), the residence time is determined with a large uncertaincy; heat and oxygen transfer from the surroundings to the particle become limiting phenomena: a model is necessary to derive intrinsic kinetic parameters of chemi-cal reactions. Results from tests on a bituminous coal show that a high accuracy has been reached as far as following the particles weight loss and gas evolution is concerned. The atmosphere temperature has been shown to have an important effect on the global yield of volatiles, and on the devolatilisation kinetics. The oxygen content of the atmosphere significantly affects both the volatiles yield, and the weight loss kinetics during solid residue oxidation.Ongoing research seeks to determine intrinsic kinetic parameters for each chemical reaction, and to investigate from numerical simulations how the differ-ent steps (devolatilisation, volatile and char oxidation) are coupled in terms of temperature and of oxygen availability at the particles' surface.
Appendix
Fluent Y.5 was used with an unstructured mesh. The feeding and sampling probes temperature was fixed at 20°C. The reactor wall temperature was 900 °C, and main airflow initial velocity was 0.5m1s (at 900°C). The feeding probe air-flow average velocity was 2 mls. ThePI radiation model was utilised. Gravita-tion and air properties dependence on temperature were taken into account. Particle tracks are calculated from previous computation of the gas velocity, tem-perature and pressure field.
Coal properties were the following:
Sample 160-200J.Un
Proximate analysis (mass % dry)
Fixedcarbon 57.5 53,9
Volatilematters 23,4 23,1
Ash 19,1 23,0
Ultimate analysis (mass% dry)
C 68,8 65,21
H 4,14 3.96
N 1,35 1,53
S 0,91 0,5
0 5,7 5,8
Solid density (He pycnometer, kg.m-3) 1558 1561
NOMENCLATURE
CO2 oxygen concentration (mole.m")
CPp
specific heat of particle (J.kg-1.K-1)d
p
Particle diameter (m)D diffusivity (m2.s- l )
G Cloud combustion number
km diffusion coefficient (m.s")
M
co
CO
molar mass (0.028 kg.rnol")Nu Nusselt number
P02 oxygen partial pressure (atm)
Pr Prandtl number
R universal gas constant (=0.0831
atm.m-3mol-IK-I) Re Reynolds number Sh Sherwood number T temperature (OK)
Vg
slip velocity (m.s-I ) Greek Symbols E emissivity'Sh oxygen diffusion time constant (s) 'Nu conduction-convection heating time (s)
constant
'v
acceleration time constant (s)"
radiation heating time constant (s)Ag
gas thermal conductivity (w.m-I.K- I)J.lg
dynamic viscosity (N.s.m-2)v
g
cinematic viscosity (m2.s- 1)Pg
gas density (kg.m-3)Pp
particle density (1200 kg.m-3)ao
Stephen-Boltzman constant (5.67xlO-8 W.m2K4)Subscripts
p s 00 initial (t=O) particle particle surface
bulk gas (infinite) or furnace wall
Acknowledgements
The authors would like to thank R. Gadiou (Laboratoire de Gestion des Risques - Environnement, Universite de Haute Alsace - ENSCL, Mulhouse, France) and B. Stanmare (Department of chemical engineering, University of Queensland, Brisbone, Australia) for lending their support to this work.
References
Annamalai, K.• Ryan. W. (1993). Interactive processes in gasification and combustion - II. Isolated carbon, coal and porous particles. Prog. Energy Combustion Science. 19,383.
Bachalo, W.D. (1994). Experimental methods in multiphase flow. International Journalof multiphase flow, vol. 20, suppl., pp261-295.
Beck, N.C., Hayhurst, A.N. (1990). The early stages of the combustion of pulverised coal at high
temperatureII:Measurement of the size andcomposition of the resulting char.Combustionand
flame. 80, 170.
Costa, A. Moo Costen, P., Lockwood, F.C. (1991). Pulverised-coal and heavy-fuel-oil flames: large-scale experimental studies at Imperial College, London. Journal of the institute of Energy, 64.
Davies, T.W. (1985). The production of concentrated powder suspensions at low flow rates. Powder
technology.42, 249.
Gadiou, R. (1990). Etude experirnentale et modelisation de la combustion d'un grain de charbon.
Thesede I'Universite de Haute-Alsace,
Gurgel Veras, C.A., Saastamoinen, J., Carvalho JR., J.A., Abo, M. (1999). Overlapping of the
devol-utilization and char combustion stages in the burning of coal particles.Combution and flame.
116,567.
Helble, J.1., Mojtahedi, W., Lyyranen, J., Jokiniemi, J., Kauppinen, E (1996). Trace element partition-ing durpartition-ing coal gasification. Fuel. 75, 8.
Huang, G., Scaroni, A.W. (1992). Prediction and measurement of the combustion time of single coal particle. Fuel. 7 I.
Kramlich,J.e.,Seeker, W.Roo Sarnuelsen, G.S. (1987). Observations of chemical effects accompany-ing pulverisedcoal thermal decomposition. Fuel.67.
Lester,E,Cloke, M., Miles, N.J. (1993). The effect of operating on char produced in a drop-tube fur-nace. Fuel processing tech. 36. 101.
Liu,H;Harnpartsoumiam, E., Gibbs, B.M. (1997). Evaluation of the optimal fuel characteristics for efficient NO reduction by coal rebumiog. Fuel. 67, I I.
Rudioger, G. (1974). Effect of velocity slip on the burning rate of fuel particles. Fluid mechanics of combustion. Conference May 1974, Montreal, pp 35-46.
Seeker, W. Roo Samuelsen, G. S., Heap, M.P., Trolinger, J.D. (1981). The thermal decomposition of pulverized coal particles. 18th Symposium (international) on combustion.1213.
Stanmore, B.R., Choi, Y-Coo Gadiou, R., Charon, 0., Gilot, P. (1999) .. Submitted to Combustion Sci-ence and Technology, April 1999.
Ten Brink, H. M., Eenkhoom, S., Hamburg, G. (1996). A mechanistic study of the formation of slags from iron-rich coals. Fuel. 75, 8.
Therssen, E., Gourichon, L., Delfosse, L. (1995). Devolatilization of coal particles in a flat f1arne -Experimental and modelling study. Combustion and flame. 103, 115.
Vantelon, J.P., Pagni, P.J., Dunsky, C.M. (1986). Cellular l1ame structures on a cooled porous burner.
Dynamics of explosions and reactive systems. 10thInl.Conf.
Van de steene, L., Chamay, G.• Salvador, S. (1998 (a». Combustion propre de particules solides: caracterisation experimentaled'un reacteur modele. SFTThennique et Environnement, Congres
5-7 Mai 1998. Marseille, France, Elsevier. 275, 279.
Van de steene, L., Chamay, G" Salvador, S. (1998 (bj), Combustion of powdered solid fuels in a drop tube furnace: parametric study. British-French flame days. 29-30th October 1998, Guernsey,