Comparison between the charring rate model and the conductive model of
Eurocode 5
Paulo B. Cachim1 and Jean-Marc Franssen2 1
Department of Civil Engineering/LABEST, University of Aveiro, 3810-193 Aveiro, Portugal
2Department of Structural Engineering, University of Liege, 1 Chemin des Chevreuils, B-4000 Liege, Belgium
SUMMARY
Eurocode 5, Part 1-2, presents several models for the calculation of fire resistance of timber structures. These models are based on the hypothesis that for temperatures above 300° C, wood is no longer able to sustain any stress, which makes the determination of the location of the 300° C isotherm decisive for the result provided by the models. In this paper, the charring rate model and the conductive model presented in Eurocode 5, Part 1-2 are compared regarding the determination of the location of the 300°C isotherm. The main wood parameters investigated are density, moisture content and anisotropy. The almost complete independence of the charring rate model from these parameters leads to some inconsistencies between the models. To reduce these inconsistencies some proposals to improve the conductive and the charring rate models are presented.
KEY WORDS: charring rate; wood; fire resistance; orthotropy; moisture content
1. INTRODUCTION
The fire resistance of wood members is critically influenced by the charring in the material. Design methods should thus be capable of predicting, after a certain period of time, the amount of charred wood. The char front is defined as the transition between the char layer, a zone of cracked charcoal that has no relevant strength or stiffness properties, and the pyrolysis layer, the zone where thermal degradation of wood and char formation are actually occurring. This transition is usually considered to be located at the 300°C isotherm, named the char-line. Charring depth is the distance between the outer surface of the original member and the position of the char-line. The speed at which charring depth advances in the material is called the charring rate and is an essential parameter for fire resistance of wooden structures because it allows the determination of the size of the residual section of wood.
Charring rate of wood is dependent on numerous factors, such as wood species, density, permeability, composition, moisture content or direction of burning (along or perpendicular to the grain). For practical applications, however, only some of these factors can be actually considered.
The evolution of charring depth with time is non-linear but in practice, due to its limited non-linearity, it can be considered as linear. Most codes of practice, such as Eurocode 5 Part 1-2 [1], named in this paper as EC5, consider the charring rate in simplified design methods as being constant. The strength model is based on the reduction of the cross-section of the member caused by the wood being charred and its consequent loss of strength. Structural Eurocodes also allow the use of more sophisticated analysis and design procedures that supposedly lead to more accurate predictions of the fire behaviour of structures. For wood, EC5 allows the use of a conductive model based on thermal properties of wood that uses heat transfer equations for the determination of distribution of temperature within structural sections; this thermal calculation is then normally followed by a structural calculation taking into account the progressive degradation of mechanical properties from 20 to 300°C for the evaluation of the behaviour of the structure. More accurate models for wood at elevated temperatures would include mass transfer of water and water vapour through the wood (see, for instance, [2]), but due to their complexity they are not used for design purposes and will not be analysed here.
The aim of the present paper is to compare the results obtained by the charring rate and the conductive models of EC5. Some recommendations to improve the consistency between the different models of EC5 are also presented.
2. EUROCODE 5 MODELS FOR CHARRING RATE AND THERMAL ANALYSIS
2.1. Charring rate models
Charring rate models use the charring rate concept to calculate the residual section of a wooden cross-section after a certain exposure to fire.
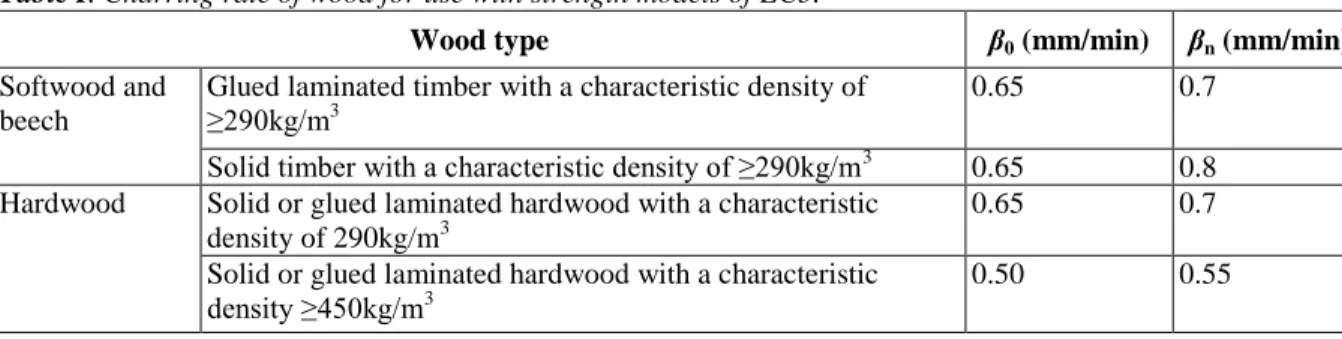
EC5 allows the use of two different charring rates: the one-dimensional design charring rate under standard fire exposure, β0, and the notional charring rate, βn. When using the one-dimensional charring rate, calculation of cross-sectional properties should be based on the actual charring depth and the corner roundings. The notional charring rate is an equivalent charring rate that allows the use of an equivalent rectangular residual cross-section. The charring rate values given in EC5 for softwoods and are presented in Table I. According to EC5, the charring rate is independent of density for softwoods with densities above 290kg/m3 and for hardwoods with densities above 450kg/m3. For hardwoods the charring rate varies linearly for densities between 290 and 450kg/m3. In the current paper the one-dimensional charring, β0, rate will be considered and compared with the conductive model because this eliminates unnecessary complications linked to geometrical considerations and allows concentrating purely on the char depth or charring rate.
When the charring depth has been determined, two different strength models are presented in EC5 for performing subsequent mechanical analysis: (i) the reduced properties method that accounts for the reduction of the mechanical properties within the residual cross-section and (ii) the reduced cross-section method that reduces the residual section, further by eliminating also the pyrolysis layer but maintaining the mechanical properties of wood intact. The mechanical analysis is not considered in this paper.
Table I. Charring rate of wood for use with strength models of EC5.
Wood type β0 (mm/min) βn (mm/min)
Softwood and beech
Glued laminated timber with a characteristic density of ≥290kg/m3
0.65 0.7
Solid timber with a characteristic density of ≥290kg/m3
0.65 0.8
Hardwood Solid or glued laminated hardwood with a characteristic density of 290kg/m3
0.65 0.7
Solid or glued laminated hardwood with a characteristic density ≥450kg/m3
0.50 0.55
Table II. Density ratio, conductivity and specific heat capacity as a function of temperature for use with
conductive model of EC5.
Temperature (°C) Density ratio, G Conductivity, % (W/mK) Specific heat capacity, c (J/kgK)
20 1 + w 0.120 1530 99 1 + w 0.133 1770 99 1 + w 0.133 13600 120 1.00 0.136 13580 120 1.00 0.136 2120 200 1.00 0.150 2000 250 0.93 0.123 1620 300 0.76 0.097 710 350 0.52 0.070 850 400 0.38 0.077 1000 500 0.33 0.090 1200 600 0.28 0.176 1400 800 0.26 0.350 1650 1200 0.00 1.500 1650
2.2. Conductive model
The conductive model presented in EC5 is based on two- or three-dimesional, transient, heat transfer differential equation, incorporating thermal properties that vary with temperature. Effects such as mass transfer within the structure, reaction energy released inside the wood due to pyrolysis or degradation of material, cracking of charcoal, which increases the heat transfer in the char layer, are not modelled explicitly. Thus, EC5 proposes thermal properties that are equivalent properties taking these effects into account implicitly.
The equivalent conductivity, specific heat capacity and density ratio (the ratio between density at a specific temperature and density of dry wood) as defined in EC5 are presented in Table II. It is clearly indicated in EC5 that the values of conductivity of the char layer are apparent values in order to take into account increased heat transfer due to shrinkage cracks above about 500°C that increase heat transfer due to convection and radiation. Specific heat capacity values also include the energy necessary to evaporate the water, which explains the presence of the higher values between 99 and 120°C. The values defined for thermal properties in EC5 were defined for softwoods and for service class 1, which means wood with approximately 12% of water content. The study was developed performing all numerical finite element calculations using the finite element code SAFIR [3], which is a special purpose finite element code, developed at the University of Liege for studying structures subjected to fire. SAFIR is capable of performing thermal and mechanical analysis. However, in this paper only thermal calculations were carried out.
3. INFLUENCE OF DENSITY
Charring depth using the charring rate models is directly obtained by multiplying the charring rate presented in Table I by time. When using the conductive model, charring depth was considered as the distance from the exposed surface to the 300° C isoline.
For calculations of charring depth using the conductive model, the coefficient of heat transfer by convection was considered as 9 W/m2 K on unexposed surfaces and 25W/m2 K on surfaces heated with the standard time-temperature curve, according to Eurocode 1, Part 1-2 [4]. The surface emissivity of wood was taken as 0.8. Thermal conductivity, specific heat capacity and density ratio were used with values defined in EC5 (see Table II). Moisture content of wood, w, was considered equal to 0.12.
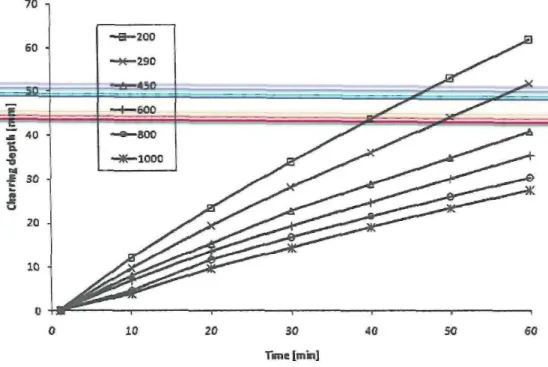
The use of the conductive model, which considers the heat stored in the material, will automatically produce different results for different wood densities. In this study, densities with 12% moisture content of 200, 290, 450, 600, 800 and l000kg/m3 were investigated. The evolution of charring depth with time for the different densities is shown in Figure 1, where it is apparent that significant differences exist for different densities. These curves present a slight convexity. The charring rate is the first derivative of the curves. Because of the nearly linear character of the curves average charring rates were calculated for 30 and 60 min (taken as the secant value from the origin) and summarized in Table III.
From here, the secant charring rate used for comparison purposes is the secant charring rate at 60 min.
The fact that the charring rate really changes with wood density has been demonstrated by several authors from several countries [5-8]. The conductive model is thus consistent with this observation. However, this dependence is only marginally considered in the charring rate models of EC5. The Australian Standard AS 1720.4 [9] explicitly considers the effect of density on the charring rate and is consequently used here for comparison purposes. The dependence of charring rate with density is given in the Australian Standard by:
Figure 2 allows comparing the influence of the density on the charring rate in the models mentioned here. It represents the results of the conductive model, the EC5 charring rate model for softwoods (EC5-SW) and hardwoods (EC5-HW), as well as with the Australian Standard, As.
Figure 1. Evolution of charring depth for different densities given by the conductive model.
Table III. Charring rates calculated with the EC5 conductive model after 30 and 60 min as a function of wood
density at 12% moisture content (mm/min).
Time of fire exposure (min)
Density at 12% moisture content (kg/m3)
200 290 450 600 800 1000
30 1.13 0.94 0.76 0.64 0.56 0.48
60 1.03 0.86 0.68 0.60 0.51 0.46
Comparisons of the different models show that for densities above 700kg/m3, typical of hardwoods, the Australian Standard, the EC5-HW and the conductive model give very similar results. Below 600kg/m3, the models show significant differences, with the AS model being the one with highest charring rates. EC5-SW and conductive models show good agreement for 450kg/m3.
The potential regression curve that fits to the results of the conductive model reads as follows:
with a coefficient r2 = 0.998. In fact, the theory of heat transfer in materials with constant thermal properties
states that the thermal propagation speed is proportional to the square root of thermal diffusivity:
The numerical calculations, made here with temperature-dependent properties, show nearly the same dependency for ρ.
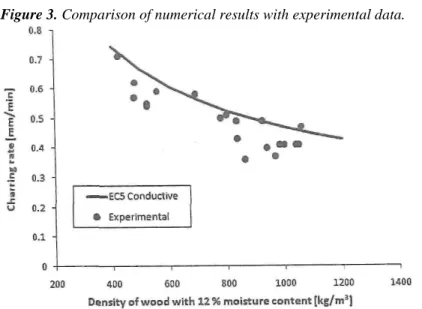
The results obtained numerically were further compared with experimental measurements performed previously at the University of Liege for tropical hardwoods and for some softwoods [10]. Comparison of the conductive model with experimental data is presented in Figure 3. It can be observed that numerical results form an upper envelope of the experimental values.
Figure 3. Comparison of numerical results with experimental data.
4. INFLUENCE OF MOISTURE CONTENT
The water content of wood has an influence on the thermal behaviour of timber. Thermal conductivity of solid wood depends on the moisture content as reported by several authors [11-14]. The effects of changes in conductivity of wood below 300° C on the charring rate are not significant. The evaporation of water consumes energy, changing the apparent specific heat curve of the composite wood-water material. Temperature at any point in wood will remain approximately constant at about 100°C until the water has been evaporated. Also density of wood is affectecd by the moisture content. Finally, the charring rate of wood is proven to be dependent on the moisture content as was demonstrated, for example, by [5, 6, 15, 16].
4.1. Influence of moisture content in the EC5 conductive model
EC5 specific heat and density ratio curves were defined for service class 1, which means water content around 0.12. However, density ratio is defined in EC5 as a function of the water content (see Table II), indicating that
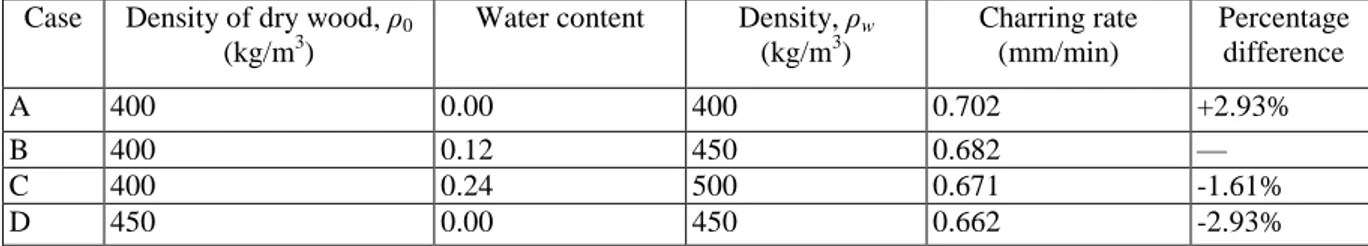
this curve could be used also for water contents different from 0.12. Using this last assumption, calculation of the charring rate was performed for wood with different moisture contents, leaving specific heat and thermal conductivity curves unchanged. The wood density with 12% moisture content was 450kg/m3. Thus, density of dry wood, ρ0, is 400kg/m3. Water contents equal to 0.0, 0.12 and 0.24 were utilized, leading to wood densities of 400, 450 and 500kg/m3, respectively (Table IV, cases A-C). In addition, in order to compare two situations with the same density but with two different moisture contents, dry wood with ρ=450kg/m3 was also considered (see Table IV, case D). The calculated average charring rates after 60 min are presented in Table IV. There is no significant difference between the results (differences in charring rates are less than 3%). The conductive model proposed in EC5 is thus not really able to model the variations of the charring rates with the moisture content that have been reported in the literature. Values of 0 and 24% moisture content were chosen to be the extreme values that probably will not be reached and thus, to be the boundaries of what can occur. All possible cases that may occur in practice will fall in the analysed range.
Table IV. Density, moisture content and charring rate in numerical tests with the conductive model.
Case Density of dry wood, ρ0 (kg/m3)
Water content Density, ρw (kg/m3) Charring rate (mm/min) Percentage difference A 400 0.00 400 0.702 +2.93% B 400 0.12 450 0.682 — C 400 0.24 500 0.671 -1.61% D 450 0.00 450 0.662 -2.93% 4.2. Possible improvement
In order to take into account more efficiently the effect of the moisture content when using the conductive model, a modified heat capacity curve is proposed. In the proposed modified conductive model (MCO), the proposed values for specific heat capacity are based on the assumption that the heat capacity of wood with a water content w, cw, is given by Equation (4), presented in [17], in which the effect due to wood-water bond was neglected, and the liquid water specific heat capacity is 4190J/kgK
Considering that specific heat values proposed by EC5 (see column 3 in Table V) include 12% water, Equation (4) was used to calculate the heat capacity of dry wood (see column 4 in Table V). Equation (4) can then be used to give the new expression for the moisture content-dependent specific heat (see column 5 in Table ), with the followig considerations:
• From 20 to 90°C,Equation (4) is used as such, with the appropriate value for the dry wood c0. • From 120°C and beyond, it is assumed that the heat capacity given by EC5 is for dry wood.
• From 99 to 120° C, the term that multiplies w was adapted in order to make the contribution finked to evaporation proportional to the water content. The factor that multiplies the water content in column 5 of Table V, for temperatures between 99 and 120°C, can be approximately obtained by summing, on one hand, the specific heat capacity of liquid water with, on the other hand, the energy consumed in water evaporation (2250kJ/kg) divided by the temperature interval (21°C).
For temperatures between those presented in table, wood properties should be linearly interpolated.
The influence of the water content on the charring rate of wood was recalculated using the conductive model with these new properties. The analysed base densities of wood at 12% moisture content were 290, 450 and 600kg/m3 (see Table VI). The water contents used were 0.0, 0.12 and 0.24. As in Section 4.1, dry wood with a density ρ=450kg/m3 was also considered. The relation between the charring rate and the moisture content for all cases is given in Table VI.
The differences between the different charring rates are now much bigger: 12% reduction of the charring rate is observed when the moisture content changes from 12 to 24% and 24% increase of the charring rate is observed if the moisture content changes from 12 to 0%. It can also be observed that the change of the water content (from case 400-0 to 400-12) produces a bigger variation of the charring rate than the corresponding change in density
(from case 400-0 to 450-0).
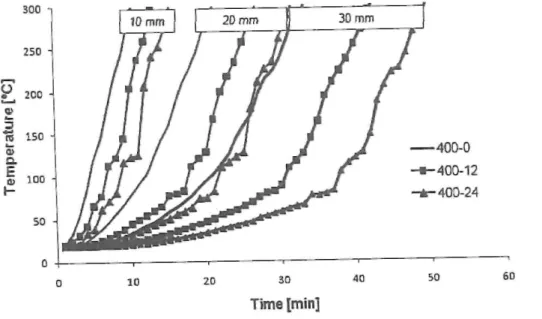
The evolution of temperature at 10, 20 and 30 mm from the exposed face of wood is plotted in Figure 4. The influence of the water evaporation can be clearly observed (for example, at 20 mm from the exposed face of wood, the time delay to reach 140°C is 12min when water changes from 0 to 24%).
Table V. New proposal for specific heat capacity of wood with water.
1 2 3 4 5
Temperature (°C) Density ratio, G Specific heat capacity of wood
(EC5) (J/kgK)
Specific heat capacity of dry wood, c0(J/kgK)
New proposal for specific heat capacity of wood with water,
cw(J/kgK) 20 l + w 1530 1210 99 1+w 1770 1480 99 1 + w 13600 1480 120 1.00 13580 2120 120 1.00 2120 2120 2120/G 200 1.00 2000 2000 2000/G
The moisture content normalized charring rate (see Table VI), kz,w, is defined here as the ratio between the charring rate at a specific water content and the charring rate at w=0.12, for the same density of dry wood. The relation between the moisture content normalized charring rate and the water, content was obtained by regression analysis of the values of column 8 in Table VI, as being
With the moisture content normalized charring rate, it is possible to obtain the charring rate at any water content, in the range 0-0.24, from the charring rate of wood with w =0.12, independent of wood density. This concept, obtained here from results of the modified conductive model, could easily be used in the charring rate model of EC5. This would ensure that the effect of moisture content reported in the literature is taken into account in a manner that is consistent between both models.
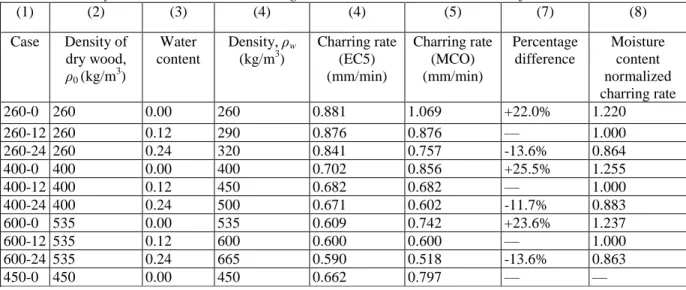
Table VI. Density,moisture content and charring rate in numerical tests with the modified conductive model.
(1) (2) (3) (4) (4) (5) (7) (8) Case Density of dry wood, ρ0 (kg/m3) Water content Density, ρw (kg/m3) Charring rate (EC5) (mm/min) Charring rate (MCO) (mm/min) Percentage difference Moisture content normalized charring rate 260-0 260 0.00 260 0.881 1.069 +22.0% 1.220 260-12 260 0.12 290 0.876 0.876 — 1.000 260-24 260 0.24 320 0.841 0.757 -13.6% 0.864 400-0 400 0.00 400 0.702 0.856 +25.5% 1.255 400-12 400 0.12 450 0.682 0.682 — 1.000 400-24 400 0.24 500 0.671 0.602 -11.7% 0.883 600-0 535 0.00 535 0.609 0.742 +23.6% 1.237 600-12 535 0.12 600 0.600 0.600 — 1.000 600-24 535 0.24 665 0.590 0.518 -13.6% 0.863 450-0 450 0.00 450 0.662 0.797 — —
Figure 4. Evolution of temperature at 10, 20 and 30 mm from the exposed face of wood.
5. MODELLING ORTHOTROPY
Wood is an anisotropic material with several properties substantially different when considered along the grain or perpendicular to the grain. However, since the majority of the thermal calculations performed to evaluate the fire resistance of linear members are related to the transversal directions, little information regarding the longitudinal thermal properties of wood is available. When the behaviour of connections, for example, has to be modelled, three-dimensional simulations must usually be performed and the thermal properties along the grain are thus required.
In [17], it is indicated that conductivity of wood along the grain ranges from 1.5 to 2.8 times conductivity perpendicular to the grain, with an average of 1.8. Spearpoint and Quintiere [18], after a literature review, report the ratio of longitudinal to transversal conductivity as ranging from 1.75 to 2.8 with an average of 2.1.
According to [17] the charring rate of wood along the grain is twice as much as that perpendicular to the grain. Maciulaitis et al. [19] carried out a test program where a ratio of 1.3:1.4 between along and perpendicular to the grain charring rates was observed.
A difficulty to be solved in order to model orthotropic behaviour of wood from the properties of EC5 is to change the proposed conductivity law to achieve a prescribed along the grain charring rate. It should be kept in mind that the properties of the char layer are mainly controlling the evolution of the charring rate, more than the properties of intact wood located ahead of the charring front. To modify the conductivity laws, two approaches were tested: first, multiplication of the conductivity of the char layer above 500°C by a constant factor k1, tand second, multiplication of the whole conductivity curve by a constant factor k2, thus affecting the conductivity of wood and of the char layer. When referring to both parameters, the term k parameter is used. The use of the k parameter allows the use of conductivity perpendicular to the grain proposed by EC5 to be modified to obtain a specific charring rate along the grain.
In order to study the effect of the multiplication of the char layer conductivity of wood by k1 and of the whole conductivity of wood by k2, wood with 450kg/m
3
and 0.12 moisture content was considered. The evolution of the average 60min charring rate with k parameters is plotted in Figure 5.
Conductivity normalized charring rate, kz,i, was defined in this study as the ratio between the charring rate at a specific k and the charring rate obtained with EC5 conductivity (k=1). The conductivity normalized charring rate is the ratio between along and perpendicular to the grain charring rate. The conductivity normalized charring rate values are given in Table VII.
Figure 5. Relation between the charring rate and parameters k1 and k2.
Table VΠ. Conductivity normalized charring rate for different values of k1 and k2. Multiplied values k1 or k2
0.5 1.0 2.0 3.0 4.0 5.0
Char, k1 0.797 1.000 1.319 1.551 1.725 1.899
Wood and char, k2 0.725 1.000 1.420 1.710 1.957 2.188
According to Equation (3), the charring rate values obtained by multiplication of the whole curve would be proportional to and consequently to
An exponential curve was fitted to the results, and the relation between kz,i and k1 can be expressed by the regression equation:
of approximately 6.
The rate of variation of the charring rate with k2 is more pronounced than with k1. The results are nevertheless relatively close, which shows that, as expected, conductivity of wood (below 300°C) has little influence for the determination of the charring rate.
The relation between k2 and calculated kz,i is given by the regression equation:
As expected the exponent is close to 0.5, meaning that to obtain a double charring rate along the grain, the conductivity curve must be multiplied by approximately 4.
6. DISCUSSION
Several comments can be made regarding the EC5 proposal for charring rate values of the charring rate model. First, the values proposed by EC5 charring rate model are smaller than the computed values with the conductive model for densities below approximately 450kg/m3 in the case of softwoods and for densities below 820kg/m3 in the case of hardwoods. However, it should be noted that values presented in EC5 for thermal properties to be
used with the conductive model are for softwoods. The use of the conductive model with those properties for hardwoods is thus questionable. For softwoods, the charring rate proposed in EC5 is independent of density, while the conductive model gives a strong dependence on density (charring rate proportional to the inverse of the square root of density). Therefore, there is some inconsistency between the results of the charring rate model and that of the conductive model. These two models yield similar results for density around 50°4C for which the conductive model has been calibrated on the basis of experimental results.
Two different approaches can be used to reduce the differences between the charring rate and the conductive models of EC5, regarding wood density: either modify the conductive model properties or, assuming that the conductive model gives better results, modify the charring rate model.
For the first approach the conductive model conductivity values should be multiplied by a suitable k factor that can be determined using Equation (6) or (7). However, this approach means that the more sophisticated model will be modified to fit the results of the simple model, which does not seem to be appropriate.
The alternative approach is to modify the charring rate values of the charring rate model to account for the effect of density and moisture content. Trying to improve consistency between charring rate and conductive models of EC5, a charring rate that is dependent on the wood density and moisture content is proposed.
This approach seems preferable because available data from [8] indicate that the conductive model properties are in good agreement with experimental data obtained for wood with densities around 480kg/m3. It was thus assumed that the charring rate for wood with 450kg/m3 is correct. In addition to the results of [8], data plotted in Figure 3 also indicate a good correlation between the conductive model and charring rate values of hardwoods and softwoods.
For a wood with density at 12% moisture content, ρ12, and moisture content id, the charring rate of the modified charring rate (MCR) model, βρ,w, could be obtained from the charring rate at 0.12 moisture content and a density of 450kg/m3, β450,12, as follows:
β ρ ,w= k ρ ,w β 450,12 (8) with
and
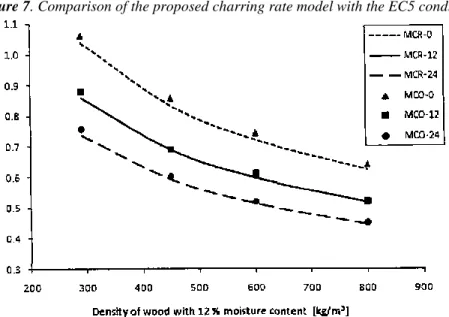
A graphical representation of the model is presented in Figure 6 where the relation of charring rate with density and moisture content can be seen. The results obtained with this model are in good agreement with the values of charring rate calculated with the modified conductive model. In Figure 7, the evolution of the charring rate with, wood density is ρlotted for water contents of 0% (MCR-0), 12% (MCR-12) and 24% (MCR-24). It must be noted that the density correction term already exists in ÉC5 for panels and a similar expression also existed in the standard version of EC5 for softwood densities below 290kg/m3. Additionally, modified curves for the conductive model are proposed, which allow a wider range of situations to be modelled, namely wood with moisture content different from 0.12 and with orthotropic thermal behaviour. Values of the charring rate calculated using the modified conductive model are also shown in Figure 7 for water contents of 0% (MCO-0), 12% (MCO-12) and 24% (MCO-24). With this approach more coherent charring rate values are obtained together with increased consistency between conductive and charring rate models.
Figure 6. Relation of the charring rate with moisture content and density in the proposed model.
Figure 7. Comparison of the proposed charring rate model with the EC5 conductive model.
EC5 does not provide any information related to the charring rate or conductivity along the grain. However, if three-dimensional simulations are to be made, this feature should be considered.
Two different scenarios were used: one where the whole conductivity curve was changed and the second where just the char layer conductivity was changed. An equivalent along the grain charring rate can be obtained by depending on the multiplication factor. Because the conductivity of wood at room temperature is also dependent on the grain direction it seems logical to multiply the whole conductivity curve of wood defined in EC5. To model orthotropic behaviour of wood at high temperatures, it is thus proposed to multiply the conductivity perpendicular to the grain by a factor ki, defined by:
A value f ki = 4 is proposed.
7. CONCLUSIONS
EC5 presents two models to calculate fire resistance of structures. Both models have some limitations, but most important, they have some inconsistencies also. This paper presents proposals to overcome some of the inconsistencies as well as to extend the applicability of the models.
Regarding the charring rate model: An expression was proposed to calculate the charring rate as a function of water content of wood and of wood density at 12% moisture content. This expression gives values for the charring rate that are in good agreement with the conductive model.
Regarding the conductive model: A proposal for modification of the specific heat capacity curve suggested in EC5 was made, extending the range of applicability from wood with moisture content of 12% to any moisture content in the range 0-24%.
It has been shown that in order to multiply the charring rate by a factor k, the conductivity must be multiplied by k2. This can, for example, be applied for modelling orthotropic behaviour; in order to have a longitudinal charring rate that is twice the perpendicular to the grain charring rate, the longitudinal conductivity must be four times the perpendicular conductivity.
NOMENCLATURE
c specific heat capacity
c0 specific heat capacity of dry wood
cw specific heat capacity of wood with w moisture content
kρ density modifjcation factor
ki multiplication factor for conductivity perpendicular to the grain
k1 multiplication factor for the conductivity of the char layer above 500°C
k2 multiplication factor for the whole conductivity curve
kw moisture content modification factor
kZ,W normalized moisture content charring rate
kz,i normalized conductivity charring rate
w moisture content
αc coefficient of heat transfer by convection
βn nominal charring rate
β0 one-dimensional charring rate
β|| along the grain charring rate
β┴ perpendicular to the grain charring rate
βp,w charring rate of wood with density p and moisture content w
β450,12 charring rate of wood with density 450kg/m3 and 0.12 moisture content Ρ0 density of dry wood
ρ12, ρ density of wood at 12% moisture content
ρw density of wood at w moisture content
λ thermal conductivity
REFERENCES
1. EN 1995-1-2:2004. Eurocode 5: Design of Timber Structures-Part 1-2: General-Structural Fire Design. CEN, 2004. 2. Fredlund B. Modelling of heat and mass transfer in wood structures during fire. Fire Safety Journal 1993; 20(1): 36-69. DOI: 10.1016/0379-7112(93)90011-E.
3. Franssen J-M. SAFIR. A thermal/structural program modelling structures under fire. Engineering Journal, A.I.S.C. 2005; 42(3): 143-158. 4. EN 1991-1-2:2002. Eurocode 1: Actions on Structures-Part 1-2: General Actions-Actions on Structures Exposed to Fire. CEN, 2002. 5. White RH, Erik V, Nordheim EV. Charring rate of wood for ASTM E 119 fire exposure. Fire Technology 1992; 28(l):5-30. DOI:
10.1007/BF01858049.
6. White RH, Tran HC. Charring rate of wood exposed to a constant heat flux. Wood and Fire Safety-3rd International Scientific
Conference, Zuduen, Slovak Republic, 1996; 175-183.
7. Njankouo JM, Dotreppe J-C, Franssen J-M. Experimental study of the charring rate of tropical hardwoods. Fire and Materials 2004; 28:15-24. DOI: 10.1002/fam.831.
8. König J, Walleij L. One-dimensional charring of timber exposed to standard and parametric fires in initially unprotected and postprotection situations. Rapport I 9908029. Swedish Institute Wood Technology Research, 1999.
9. Australia, Standards. Timber Structures Part 4: Fire Resistance of Structural Timber Members. AS 1720.4. Standards Australia, North Sydney, Australia, 1990.
10. Njankouo JM, Dotreppe J-C, Franssen J-M. Fire resistance of timbers from tropical countries and comparison of experimental charring rates with various models. Construction and Building Materials 2005; 19(5):376-386. DOI: 10.1016/j.conbuildmat.2004.07.009.
11. Gu H, Hunt JF. Two-dimensional finite element heat transfer model of softwood. Part III. Effect of moisture content on thermal conductivity. Society of Wood Science and Technology. Wood and Fiber Science 2007; 39:159-166.
12. Report FPL-9 FPL. Thermal conductive properties of wood, green or dry, from -40° to +100°C: a literature review. Report FPL-9, Forest Products Laboratory, Madison, Wisconsin, U.S.A., 1977.
13. Parker WJ. Development of a model for the heat release rate of wood-a status report. Report NBSIR 85-3163, U.S. Department of Commerce, 1985.
14. Ragland KW, Aerts DJ. Properties of wood for combustion analysis. Bioresource Technology 1991;37:161-168.DOI: 10.1016/0960-8524(91)90205-X.
15. Schaffer EL. Charring rate of selected woods transverse to grain. research paper FPL 69, s.n. Forest Products Laboratory, Madison, Wisconsin, U.S.A., 1967.
16. Hietaniemi J. A probabilistic approach to wood charring rate. VTT Working Papers 31, VTT Information Service, VTT Building and Transport, Finland, 2005.
17. FPL. Wood Handbook. Wood as an Engineered Material. Forest Products Laboratory: Madison, Wisconsin, U.S.A., 1999.
18. Spearpoint MJ, Quintiere JG. Predicting the piloted ignition of wood in the cone calorimeter using an integral model-effect of species, grain orientation and heat flux. Fire Safety Journal 2001; 36:391-415. DOI: 10.1016/S0379-7112(00)00055-2.
19. Maciulaitis R, Lipinskas D, Lukosius K. Singularity and importance of determination of wood charring rate in fire investigation.