A dielectrophoretic, microfluidic device for sorting
lipid-producing organisms used as bio-oil sources
by
Alisha R. Schor
Submitted to the Department of Mechanical Engineering in partial fulfillment of the requirements for the degree of
Doctor of Philosophy in Mechanical Engineering at the
MASSACHUSETTS INSTITUTE OF TECHNOLOGY June 2016
Massachusetts Institute of Technology 2016. All rights reserved.
Author ... ... Certified by ... A ccepted by ... MASSC S IETITUTEn ,JUN
02
20161
LIBRARIES
ignature redacted
Department of Mechanical EngineeringMay 9, 2016
Signature redacted
Cullen R. Buie Associate Professor Thesis SupervisorSignature redacted
...a
...
Rohan Abeyaratne Graduate Officer haiman, Committee on Graduate StudiesA dielectrophoretic, microfluidic device for sorting lipid-producing organisms used as bio-oil sources
by
Alisha R. Schor
Submitted to the Department of Mechanical Engineering on May 9, 2016, in partial fulfillment of the
requirements for the degree of
Doctor of Philosophy in Mechanical Engineering
Abstract
In this thesis, we present a microfluidic screening device for selecting high-lipid-content cells from a heterogeneous population. The device utilizes dielectrophoresis (DEP) to simultaneously sense and sort individual cells based on their internal lipid content. Microorganisms such as yeast, algae, and bacteria produce high fractions of neutral lipids as part of normal metabolism, and are being explored as a hydrocarbon source for products such as biodiesel, nutraceuticals, and more. Thus, there is a global effort to select or genetically engineer microorganisms that produce higher proportions of lipids. Currently, screening is a laborious process and one of the primary bottlenecks to commercialization.
Our cell sorter consists of an array of 105, 25-pim-wide gold microposts that span the height of a 15-pn channel. The electrodes were constructed by a low current electroplating process, allowing for extremely rapid metal deposition. At 100
pA,
electroplating proceeds at 3.38 0.63 pm/min, creating our structures in fewer than 15 minutes. This is an order of magnitude improvement over previous related methods.We are able separate high and low lipid phenotypes of the oleaginous yeast Yarrowia
lipolytica
using a 250 MHz, 2.6 Vp) signal in our device. Purity of the low lipid streams and high lipid streams are 98% and 71%, respectively. The high lipid stream purity can be improvedby adjusting the spacing of the array.
This work provides a method for label-free detection and sorting of cells based on their internal lipid content. This unique protocol for the rapid fabrication of 3D microstructures has enabled the creation of a non-invasive sorting tool for genetically engineered, lipid producing organisms. The ability to screen organisms based on lipid content will alleviate one of the major bottlenecks in conunercialization of microbial biofuels and other bio-oil products.
Thesis Supervisor: Cullen R. Buie Title: Associate Professor
Acknowledgments
This journey would not have been possible without a number of people. The DuPont-MIT Alliance and Martin Energy Fellows Society provided me with the tangible resources to carry out this research, while the unwavering support of colleagues, family and friends provided me with immaterial help.
First and foremost, my adviser, Professor Cullen Buie, was at once encouraging, patient, critical and motivational, all in a carefully crafted balance. His conscientious advising will have a positive impact on many students to come. My labmnates in the LEMI group have been a pleasure to work with. You are each inspiring and bright and have been wonderful people to exchange ideas with and learn from. I'm looking forward to hearing about everyone's many accoimplishmnents down the road. In addition, my thesis coimittee-Professors Rohit Karnik, Scott Manalis, and Joel Voldman-gave invaluable advice regarding both research and greater career decisions.
Of course, I might not have made it to this stage in my eduq'ation and career if not for
my friends and family. As an undergraduate at the 'Tute, I met so many people with so much passion and drive who have become lifelong friends and have inspired me to do good for myself and others. My graduate school cohort of local frisbee players has been equally supportive, although marginally less geeky.
There is no way to thank my aunts, uncles, cousins, and extended family for all that they have done. I will simply say that 1 am extremely proud to be related to so many generous, caring, and accomplished people. And to my parents-you have given me so much. I know that the only way to properly thank you two will be to niake the best possible life for myself, and that is what I will try to do. Thank you for teaching me everything. Finally, this achievement means infinitely more to me thanks to the unequivocal commitment from my partner, Joel. I am so glad to have you by my side in all that comes next.
5
Contents
1 Introduction
1.1 B iodiesel . . . . 1.2 Demand for cell sorting . . . .
1.3 Hypothesis: sorting based on dielectric properties . .
1.4 Contributions of this thesis . . . .
2 Research motivation
2.1 Status of microbial fuels . . . . 2.1.1 Biodiesel from yeast and algae . . . .
2.1.2 Advantages over terrestrial plants . . . . 2.2 Current cell selection techniques . . . .
2.3 Literature review . . . .
3 Biochemistry of lipid-producing microorganisms 3.1 Metabolism. . . . . 3.2 Increasing lipid production ... . . . .
3.2.1 Nutritional stress . . . . 3.2.2 Metabolic engineering . . . . 3.3 Cell culture . . . . 23 . . . 23 . . . 24 . . . 25 . . . 26 27 . . . .. .. 27 . . . 2 7 . . . 28 . . . 30 . . . 31 4 Dielectrophoresis (DEP)
4.1 Origin of dielectrophoretic force . . . . 4.2 Electrostatics . . . . 4.2.1 The interaction of fields with point charges . . . .
4.2.2 Polarization and force on a dipole . . . . 4.3 Dielectric matter in fields . . . .
4.3.1 Laplace's equation for lossless and lossy spheres . . . .
4.3.2 Relationship between cell properties and polarization: shelled 4.4 Sorting principles . . . .
4.4.1 C
oncept
. . . . . . . . 4.4.2 Inplenentation of DEP sorters (literature) . . . .niodel
5 Modeling and simulation
5.1 Analytical approximation of crossover frequency . . . . 5.2 Planar electrodes in a capped channel: Fourier solution . . . .
5.3 Numerical siniulation and particle tracing . . . .
33 33 34 34 34 35 39 39 40 41 41 42 43 47 49 49 50 53 53 59 62 I
6 Microfabrication techniques
6.1 Background on methods employed . . . .
6.2 Soft lithography . . . ..
6.2.1 Channel sealing and alignment . . . .
6.3 Thin metal deposition . . . . 6.4 Thick metal deposition . . . . 6.4.1 Electroplating . . . . 6.4.2 Thick photoresist . . . .
6.5 Troubleshooting recoiniendations . . . .
6.5.1 Soft lithography . . . . 6.5.2 Metal evaporation . . . . 6.5.3 Thick resist mask . . . . 6.5.4 Electroplating . . . .
7 Crossover frequency measurements
7.1 Device geometry and fabrication . . . .
7.2 Measurement protocol . . . . 7.3
Image
processing . . . .7.3.1 Detecting cells and assigning response . .
7.3.2 Identification of zero DEP response . . . . 8 Microfluidic, dielectrophoretic sorting
8.1 Sorting criteria . . . .. 8.2 Early devices . . . . 8.3 Current device . . . . 8.4 Sorting experimirent . ... . . . . 8.5 Image processing . . . . 9 Experimental results
9.1 Crossover frequency measurements . . . .
9.2 Cell sorting . . . .
9.3 Additional comments on sorting device 10 Conclusions and future work
A Recommendations for future work
89 . . . 8 9 . . . .. . . . . 9 0 . . . 9 2 . . . .. . . . 9 6 . . . 9 6 B Derivations B .1 Critical D EP force . . . .
B.2
Fourier Series for planar electrodes, capped channel . . . .C MATLAB Scripts
C .1 Hardware control . . . . C.1.1 Control of sourcemeter during electroplating . . . .
C.1.2 Control of microscope camera, function generator, and oscilloscope .
C .2 Im age processing . . . . . . . . C.2.1 Identification of DEP response in crossover frequency experiment . . C.2.2 Perform SIFT coimparison on two images . . . .. . . . C.2.3
Batch
script for crossover frequency ID . . . .99 99 102 105 109 113 115 115 116 121 121 121 123 126 126 131 132 8 65 65 66 67 67 68 68 72 73 73 74 74 76 81 81 83 83 83 87
C.2.4 Scripts to process sorting time series (fluorescence)
D Experimental protocols
D. 1 Liftoff mask for electrode deposition . . . .
D.2 AZ4620 Thick photoresist . . . .
D.3 Electroplating . . . . D.4 Mold fabrication using SU-8 3010 . . . .
D.5 PDMS device fabrication . . . .
D.6 Crossover frequency experiments . . . . D.7 Sorting experiments . . . ..
D.8 Cell staining - BODIPY . . . .
D.9 Cell staining - Nile Red . . . . D.10 Extraction of spherical Y. Lipolytica . . . .
E Development of fabrication process E. 1 AZ4620 protocol developmnent ...
E.1.1 Trial 1: AZ 4620 coating, exposure,
E.1.2 Trial 1: Results & Conclusion . . . E.1.3 Trial 2: AZ 4620 coating, exposure,
E.1.4 Trial 2: Results & Conclusion . . . E.2 Electroplating process . . . . E.2.1 Plating rate benclmarking . . . . .
E.2.2 Bath composition . . . .
E.2.3 Electron dispersive spectroscopy
and development. . and development. . . . . . . . . . . . . . . . . . . . . . 9 . . . 133 145 145 147 148 149 150 152 153 154 . 154 155 157 157 . 157 158 158 163 170 170 170 . 171
List of Figures
1.1 Schematic of the metabolic processes that lead to biofuel production in single-celled algae. Notably, the fatty acids present are triacylglycerides (TAGs), which are readily converted to biodiesel. Figure from [1]. . . . 24 1.2 The ability to sort live cells from a heterogenous culture would greatly increase
the throughput of metabolic engineering research and wild type strain screening. 25
1.3 An induced dipole in a non-uniform electric field will experience a net force that drives it either toward or away from regions of high electric field. This behavior is called dielectrophoresis (DEP), and the direction of the force depends on the dipole orientation. . . . 26
2.1 The National Algal Biofuels Roadmnap from the U.S. Department of energy recognizes the need for strain selection techniques as a major technological priority in the renewable energy sector [2]. . . . 28 2.2 Triacylglycerides (TAGs) are made of up a glycerol backbone (left) and three
fatty acid chains. Figure from Public domain, by Wolfgang Schaefer. . . . 28
2.3 The land requirements for producing algal biodiesel are orders of magnitude lower than those of terrestrial plants. It is estimated that algae could satistfy
50% of domestic, transportation fuel demand while covering only 2.5% of the
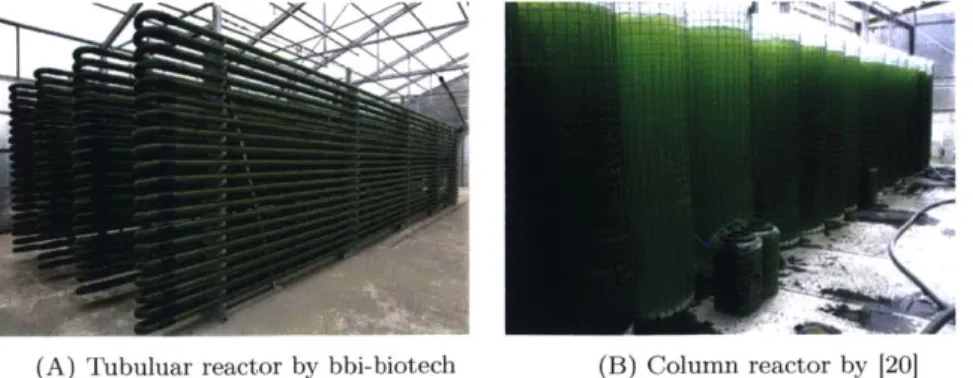
currently farmable land area [3].. . . . 29 2.4 In addition to having lower overall land requirements, reactors for
microorganism cultivation can be designed to take up a reduced footprint. . . 29
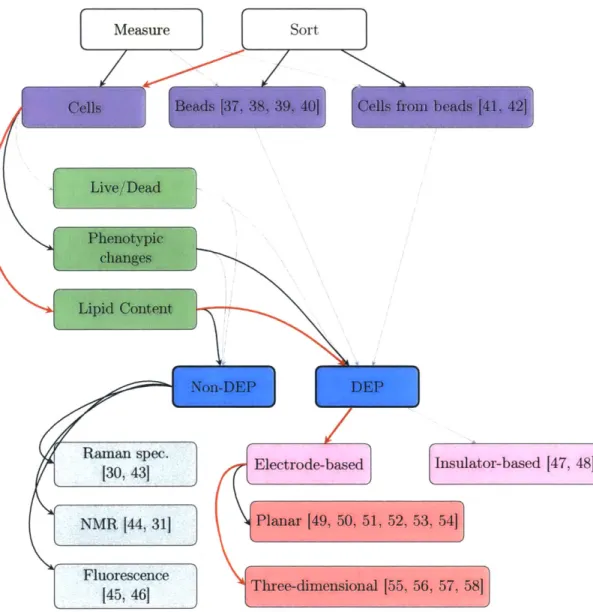
2.5 Searching for an organism with both high lipid production and high growth rate has been compared to finding a large marathon runner. Craig Mottram, of Australia, is 6'2", standing nearly a head above most of his competitors. . . 30 2.6 This flowchart categorizes the published literature most related to our work.
Bold traces indicate technologies with the strongest relationships to our device, and red traces describe this work specifically. DEP-based sorters in particular, shown in the lower right of the figure, are discussed in more detail in Section 4.4.2 . . . 32 3.1 Microscope images from the publications discussed in Table 3.2. At top, lipid
bodies in the algae C. reinhardtti are stained with Nile Red. This appears yellow in (A) and green in (B). The red is the chlorophyll autofluorescence. The yeast Y. lipolytica are shown in the bottom row, also fluorescently stained. Both images show, wild type cells at left, compared to the engineered cells, right. Image (D) also shows a transmission electron microscope (TEM) image. 36
3.2 Algae can be grown on a benchtop with proper aeration. Here, nitrogen deplete and
nitrogen
replete cultures are being grown in 250 iL erlenmueyer flasks. A mix of air and 5% CO2 are puniped through the flask. The outletcontains a 0.2 pm filter to keep the culture free of contamination. . . . 37
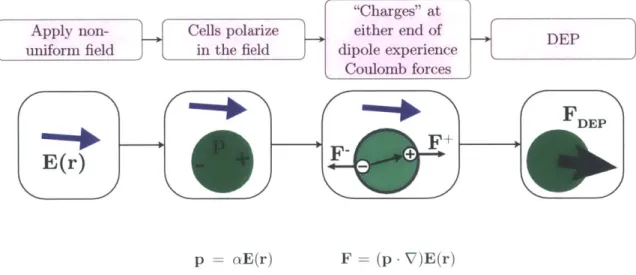
3.3 Emissions from the flow cytometry analysis. (A): Forward scattering vs. side scattering shows two distinct populations. (B) and (C): Histograms of the Nile Red intensity for each subpopulation. Both cell types show some amount of red emission due to chlorophyll autofluorescence, but the nitrogen-deprived cells show a much stronger signal due to the accumulated lipids. . . . 38 4.1 Electrostatics view of the origin of the dielectrophoretic force . . . 39 4.2 We hypothesize that due to the fact that lipids have vastly different dielectric
properties than cell cytoplasm, they will respond in distinguishable manners to a non-uniform electric field. . . . 40 4.3 An ideal, finite dipole consists of two point charges of opposite sign. The
vector distance between the two charges is d. An observer is located at a point (r,
0),
relative to dipole at the origin, where r >Idl. . . . .. . . 414.4 The dipole moment of a sphere with radius, r, and permittivity, F2, is
determined by solving the Laplace Equation in spherical coordinates. The boundary at the interface is that the displacement field be continuous. . . . . 44
4.5 The real part of the Clausius-Mossotti factor for homogeneous spheres, both
(A) insulating and (B) conducting. Medium parameters: 1 = 5 x 10- S/in,
Ei = 78.5. . . . 46
4.6 The real part of the Clausius-Mossotti factor for a hoinogenous sphere that has both o1 > 02 and El > E2. Parameters: ui = 5 x 10⁻³ S/In, C1 = 78.5,0'2 = 10-5 S/in, 2 = 30. As in Figure 4.5A, the Clausius-Mossotti
factor increases at fe..,Mw. However, since the C1 > C2, the entire spectra has a real part less than zero. . . . 47 4.7 Schematic for the double shelled dielectric model. The real permittivity and
conductivity for each layer are incorporated into a total, complex permittivity, shown in Equations 4.26-4.29. The frequency dependence has been omitted for clarity but is implied in all complex values. The subscripts 1, 2, 3 and 4 refer to properties of the medium, cell membrane, cytoplasm and interior lipid bodies, respectively. The radius of each component, i, is represented by
ai.
Lipid accumulation is modeled by increasing the radius of the lipid body,a3. . ... .. .. ... .. . . . ... ...
48
4.8 The polarizability of a cell is described by the frequency-dependentClausius-Mossotti factor. Examples of the Real part of the Clausius-Clausius-Mossotti factor
spectra, Re[K(W)], for two cell types with differing lipid contents, modeled by
changing
a3.
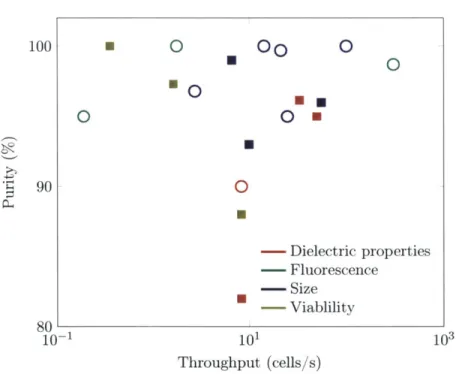
The red dots indicate the high crossover frequency for each cell type. Between these two frequencies, indicated by the grey band, we can sort cells using D EP . . . 494.9 Reported results for either cell or particle sorting related to dielectrophoresis. The throughput, in cells/s, is calculated from reported volume or linear flow
rates, assuming a sample concentration of 106 cells/ml (a common FACS concentration.) The colors describe the sorting mechanism, since many DEP sorters actually select on criteria other than dielectric properties. Symbol shapes denote the test particles. Open circles: Sorting of artificial particles or particles from cells. Filled squares: Cell sorting. . . . 52
5.1 Prediction of the high crossover frequency as a function of lipid volume fraction, using the expression given in Equations 5.14-5.16a. The medium properties were held constant at the values given on the graph, with the common parameters fixed as given in Table 5.1. The crossover frequency drops with lipid volume fraction, although the change is quite subtle up to 40% lipid content. This behavior is solely dependent on volume fraction and not overall cell size. . . . . 56 5.2 Prediction of the high crossover frequency with changing cytoplasm
conductivity, using the expression given in Equations 5.14-5.16a. The medium permittivity and cell volume fraction were held constant at the values given on the graph, with the common parameters fixed as given in Table 5.1. The cytoplasm conductivity has a strong effect as the cytoplasm properties become more similar to the medium properties, until the crossover frequency disappears entirely. . . . . 58 5.3 Prediction of the high crossover frequency with changing cytoplasm
permittivity, using the expression given in Equations 5.14-5.16a. The medium conductivity and cell volume fraction were held constant at the values given on the graph, with the conmnon parameters fixed as given in Table 5.1. The crossover frequency actually changes very little with cytoplasm permittivity. Instead, the permittivity mostly effects the maximum value of Re[n(w)], rather than when the behavior transitions. . . . 59
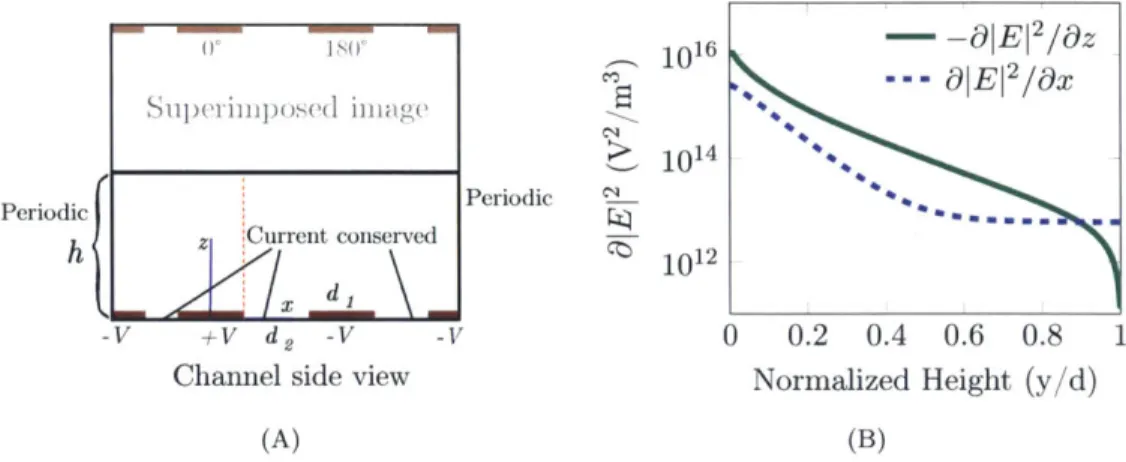
5.4 (A) The potential in a channel with planar -electrodes and an insulating top
wall can be obtained by summing two mirror image Fourier solutions for a channel of infinite height. (B) The electric field gradient in the vertical direction ( ) is decreases quickly through the height of the channel. It is also significantly stronger than the gradient in the direction of flow (i). Under nDEP conditions, then, a particle will be repelled from the region of strongest force.. ... ... ... ... ... ... ..61 5.5 For a pair of planar electrodes, the ratio of &z to the Ox is dependent on
the ratio of the gap width, dl to the electrode width, d2. We see that in all
cases, the z-direction gradient is stronger than the gradient in the x-direction. Therefore, when using planar electrodes to effect nDEP, it is important to consider out-of-plane effects. . . . . 61 5.6 The geometry used in our numerical simulations. The entire electrode array
is included. The channel is truncated at the inlet and outlet and replaced with the equivalent boundary conditions. Future figures will show only the section in the dashed box. . . . . 63
5.7
Boundary conditions for (A) the electrostatics model and (B) the laminar flow model. In the electrostatics simulation, all of the channel walls weremodeled as insulating boundary conditions. Posts were alternately assigned positive or negative 2 V, as designated by the red and blue outlines. in the flow simulation, all of the black boundaries were no-slip boundaries. At the inlet, blue, we imposed a normal velocity of 0.5 cn/s. This represents a fully developed flow as we approach the electrodes. The outlet, red, is a zero gage pressure boundary. . . . 63
5.8 The results of the (A) electrostatic and (B) laminar flow simulations. As desired, the electric field is very strong near the posts, and nearly zero elsewhere. This creates a strong gradient that repels cells from the array. The flow field is straighforward. Streamlines follow the channel until they hit the array. Then the flow is split around the posts, but streamlines move back to their original positions once downstream. . . . . 63 6.1 Microfluidics are comprised of fluid handling components and sample handling
components. In our lipid-based sorter, the fluid channels are made using softlithography. The sample is sensed and actuated using DEP, which is imparted by metal electrodes in the flow path. The geometry of both the fluid and electronic components is defined by photolithography. . . . 65
6.2 Soft lithography is the process of casting aii elastomer onto a mold. The mold is typically created using photolithography. In our case, we use the photopolymer SU-8 3010, which is patterned onto a silicon wafer (Step 1). After pouring the PDMS elastomner, the PDMS is cured for 2 hours at 75 C (Step 2). It can then be peeled from the mold, diced, and bonded with a glass substrate using RF plasma (Steps 3 and 4). . . . . 67
6.3 Schematic of and electron beam evaporator. Electron beam evaporation is a line-of-sight metal evaporation method, meaning that the sublimated metal does not conform to features on the substrate. This makes it ideal for liftoff applications, because the metal adhered to the substrate is not contiguous with the photoresist (see inset in upper left). . . . . 68
6.4 During electroplating, metal ions in solution are driven toward the work piece and adsorbed onto the surface. . . . . 69 6.5 Relationship between current density and electrode overpotential, as shown
in [4]. At low current densities, the metal deposition follows Butler-Volmer kinetics. Past a limiting current, IL, the overpotential can increase dramatically. This causes other reactions, such as hydrogen evolution, to become favorable and limits the efficiency of the process. . . . 70
6.6 Individual devices are electroplated in a 500 mL beaker, heated and stirred on a hot plate. A Keithley sourceneter, shown outside the fume hood, sets the current and measures voltage. The length of the run is controlled by a computer, which also records the current and voltage. . . . ... .. 71
6.7 SEM of successfully electroplated, gold posts, before (left) and after (right)
removing the photoresist. The posts are 15 11111 high and 25 pin in dianmeter and show good uniformity. . . . 72
6.8 Resulting heights of posts plated for 8-12 minutes at 100 pA, 600 C using TechniGold 434 (Technic, Cranston, RI). A linear fit to the data tells us the plating rate: 3.38 0.63 pn/min (R2: 0.84). This reflects a cathode efficiency of 53.23% . . . 73
6.9 Procedure for creating electroplating masks using AZ4620. The resultant height is greater than 15 pm. . . . 79
6.10 Brightfield image of the developed AZ4620 layer. The layer is 18.5 pm thick.
Comparing the brightness of the posts to the leads, we can see that the area over each post is clear, indicating good development. . . . 79
6.11 SEM images of the photoresist after exposure and development. (A)
underexposure of the photoresist leads to incomplete development. (B) sufficient exposure doses allow for proper development, revealing the gold seed layer below. (Scale bars 50
pn.)
. . . 80 6.12 Negative of measured voltage over time for plating runs at 100 pA of 9, 10,and 11 minutes. The voltage was measured using the Keithley Sourcemeter in two-probe configuration, at 30 second intervals. (Note: The voltage was measured with ground connected to the cathode. However, overpotentials are reported with reference to the electrode of interest, so these values are negative of the cathodic potential.) . . . 80
7.1 A pair of castellated electrodes charged 180' out of phase yield distinct
positive DEP regions (left) and negative DEP regions (right). . . . 82 7.2 Numerical simulation of the electric field magnitude [V2/m2] in our
arrow-shaped crossover frequency device. The field shown here is a plane from a three-dimensional model at elevation 5
pin.
The three-dimensional effects lead to an electric field gradient around all electrode edges, rather than only between the points of the electrodes. . . . 827.3 Crossover frequency chip. Each chip contains several rows of electrode pairs, in order to easily take experimental replicates. During an experiment, three pairs are measured simultaneously. The responses are taken as the mean of these three pairs, in order to mitigate measurement error. . . . 83 7.4 Sequence of crossover frequency experiment. This protocol is repeated for
each cell phenotype (strain and growth condition). The experiment is run from high to low frequency, between 350 MHz and 100 kHz. All inputs are at
4 VPP. ... .... .. ... 84
7.5 Image processing for determining dielectrophoretic response of cells in the arrow "electrode field." (A) Background image, i.e. median image of device with not signal. (B) Median image with signal on. (C)
Background-subtracted image, revealing the cell locations in white. (D)
Automatically-detected negative DEP regions in purple, with cells identified as negative DEP in white. (E) Automatically-detected positive DEP regions in purple, with cells identified as positive DEP in white. For each experiment, the total number of pixels associated with each region are counted, to give an indication of whether the overall response is positive or negative DEP. The example above represents a case that would be identified as negative DEP. . . . 85
7.6 Image processing for an example identified as positive DEP. . . . 86 7.7 Image processing for an exaniple identified as zero DEP. . . . 86
7.8 Sample SIFT processing using MATLAB and FIJI. The images shown at right were identified as zero DEP. Yellow crosses indicate the matched features between the two images. Many matched features indicates that the background and signal are very similar images, i.e. there was no movement. At left, a demonstration MATLAB script showing the relevant calls to instantiate FIJI within MATLAB. . . . 88
8.1 Cell sorting in inicrofluidics is often achieved in the following manner: first, a phenotype-agnostic force (typically a fluid flow) carries the mixed sample stream through a channel. Next, some form of sensor/actuator system identifies target cells and moves them perpendicular to the carrier flow. This yields physically separate output streams that can then be collected and analyzed . . . . 90
8.2 Schematic of a cell interacting with a DEP source (not to scale). The electrodes are positioned at an angle, 0, with respect to the channel walls and the imposed flow with linear velocity, u. The dielectrophoretic force acts perpendicular to the electrode pair. A cell flowing past the electrodes experiences both Stokes' drag and the DEP force. A cell will be deflected around the end if the ratio Ay/Ax is greater than the array angle. With some algebra, this gives us the minimum force magnitude,
IFD)EP
, expressed in Equation 8.1. . . . 918.3 The DEP force required to sort cells of a given size increases linearly with both
flow rate, u (left), and cell size, a (right) as Equation 8.1 shows. However, due to the non-linear dependence on array angle, the required force increases more rapidly for steeper arrays. The black dots on each plot indicate time fixed value used in the neighboring plot, as noted below each figure . . . 91 8.4 Our initial devices were all co-planar electrode geometries. We were able to
show a proof of concept separation of large and small beads (A), and manipulation of C. reinha-rdtii (B). However, the out-of-plane gradient prevented any meaningful throughput. . . . 92
8.5 Prior to settling on the conducting post design, we explored creating a 3D field by (A) recessed electrodes and (B) sandwiched electrodes. . . . 92 8.6 (A) Channel geometry. Particles are focused to the center of the 400 pim
wide channel upstream of the electrode region. (B) Neighboring posts are charged 1800 out of phase, generating a high field gradient at the posts. (C) Numerical simulation of cell and bead trajectories in the DE1P force field, at
250 MHz. The Clausius-Mossotti factor values from Figure 4.8 were used in
these sim ulations. . . . 93
8.7 Schematic of a cell interacting with the conducting post array (not to scale). The derivation for the required DEP force, IFDEP , is the same as for the case show n in Figure 8.2. . . . 94
8.8 The 3D-DEP sorter is constructed by a series of photolithography steps. Step
1 is to deposit a 150nm/15nm Au/Ti layer onto a glass substrate via
electron-beam evaporation. This pattern contains both the posts and leads (Mask A). In Steps 2-3, a thick layer of positive resist AZ4260 is spin coated and then selectively remove via photolithography, using Mask B. This is to mask off all but the areas to be electroplated. Next, the devices are carefully electroplated to the final height (Step 4). This is followed by removal of the photoresist with acetone, in Step 5. Finally, Step 6 is to form channels by plasma bonding with molded PDM S. . . . 95
8.9 Experiment schematic. A pressure source with two independent regulators both focuses the cells in the middle of the channel and controls the flow velocity. A high frequency function generator provides the signal that creates the DEP force field. . . . 97
8.10 Photograph of the experimental setup, as described in Figure 8.9. The inset
at right shows the connections from the macro world to the microfluidic device. 97
8.11 Example of using fluorescent labeling to identify subpopulations. Here, 6
Pm
beads (red) are separated from 1 pin beads (yellow). By imaging using only the filter for a particular color, we can get independent images for each size. . 98
9.1 Drawing (not to scale) of a model crossover frequency experiment. In this hypothetical experiment, there are three cells in the pDEP region, shown in green, and one in the purple,
nDEP
region. These cells cover a total of 42 and 8 pixels, respectively. This would be reported as shown at right, as a ratio of the pixel count of cells in each region. . . . 1009.2 Dielectrophoretic response of engineered Y. lipolytica cells as a function of frequency. The wild type and engineered cells have an estimated 18t3.05% and 47 1.20% lipid content (dry weight), respectively. The cells' movement toward positive or negative DEP regions were measured as described in Section 7.3. From the final cell locations, we see that high-lipid-content cells tend to exhibit negative DEP much more than low-lipid cells. This implies that we should be able to sort cells based on this criterion. . . . 100
9.3 Cases that would appear as zero DEP to the human observer will still register a non-zero number pixels in the positive and negative DEP regions after background subtraction if there is fluid drift. Therefore, assessment using the
SIFT algorithm in tandem with the cell locations is key to identifying the D EP response. . . . 101
9.4 Time lapse fluorescence images show that low lipid cells and high lipid cells are driven to different lateral positions under DEP. (A) The low lipid cells, stained with Syto BC, traveling primarily through the array under Stokes' drag and with no DEP. Some, however, trap due to positive DEP. (B) The high lipid cells experience almost completely negative DEP, and are deflected toward the walls of the channel. Poor focusing at the inlet causes some low lipid cells to travel toward the walls as well. . . . 103
9.5 The lateral positions of cells at the entrance and exit of the array can be
determined using the fluorescence intensity profiles at each time point. After
filtering noise from the signal, the cells appear as strong peaks in fluorescence. The position of these local maxima are tabulated to give absolute cell counts. 104
9.6 This box plot shows the median, 25th/75th percentile (box edges), data limits (whiskers) and outliers (red crosses) of the cell counts for each experiment. As a negative control, we flowed cells through the device with no applied field. Latex beads, which are strongly insulating, were used as the positive control. We observed that even with no applied signal, there was significant spreading of the cells across the channel. This was due to a combination of steric interactions and mis-alignment of the focused strearn with the electrode. The beads, on the other hand, were strongly deflected to the sides of the device under negative DEP. The low lipid cells behaved similarly to the negative control, indicating that they also experience no DEP force. Better upstream focusing yielded a tighter distribution as well. However, the decrease cell counts at the entry and exit (79 vs. 54, respectively), also show a significant portion of cells trapping through positive DEP. Finally, the high lipid cells are strongly deflected to the outside of the array, behaving much like the insulating beads. . . . 104
9.7 Mechanical trapping is easily distinguishable from positive DEP trapping,
with the former responding strongly to the applied electric field. In brightfield, we can see cells that were initially caught on the array are repelled by negative D E P . . . . ..106
9.8 Fluorescence image sequence of a mechanically trapped bead being deflected
by negative DEP when the signal is turned on. . . . 106 9.9 While mechanically trapped cells tend to be released when the electric field
is applied, cells trapped due to positive DEP remain in place. In addition, we can observe continued accumulation of cells as the experiment progresses. 107
9.10 Although we expect cells to follow streamlines in creep flow, we observed
cells crossing into nearby streamlines, leading them toward an incorrect exit location. This behavior is frequently due to cells trapped on the array. The device may also exhibit some of the behavior exploited in Deterninistic Lateral Displacement (DLD), carrying them perpendicular to the streamline. 107
9.11 Cells that are poorly focused or off-axis with the array will spread under
hydrodynamic forces, even if they experience no DEP force. Trajectories were simulated under the same conditions as Figure 8.6, but with a wider focus stream. Under these conditions, low lipid cells mnay be deflected into the high lipid stream . . . . 108 10.1 Each successive post addition increases the spacing between the high and
low lipid streamlines by a distance slightly less than the post diameter. As there is no additional fabrication required to extend the array (other than new photoiuasks), this is the simplest solution to amplifying the separation and reducing misdirected cells. . . . 110
10.2 Spacing out the arrow features does not force the streamlines to bend as strongly around the posts. The result is that the position of the streamlines exiting the array is pushed closer to the channel wall. . . . .11
10.3 Concept drawing a positive-DEP-based cell sorter. Cells begin focused toward
a wall containing electrodes embedded a slight distance back from the sidewall. In a fashion similar to DLD, cells are, by default, deflected toward the opposite wall. However, cells that experience pDEP are pulled back toward the original
wall, resulting in two sorted streams. . . . .111
B.2 Electrodes are embedded at the bottom of an insulating inicrochanne of height h. An AC signal is applied so that the electrodes are 1800 out of phase. We can consider this as the electrostatic case with the electrodes at Vp,. . . . . 116
B.3 Using the Fourier solution for an open channel and the method of images, we can evaluate an analytical solution for a capped microchannel with planar electrodes. We see that throughout most of the channel depth, the out of plane forces are greater than the in-plane forces. If the cell is levitated to a height where it does not experience sufficient lateral force, it will not be sorted. 119 D.1 Calibration of
ODoo
vs. volume fraction for wild type Y.lipolytica.
The volume fraction was calculated from the cell concentration as measured by a hemocytoneter, and then using an average cell volume based on the average cell radius. . . . 154E. 1 Profilometer scans of developed AZ4620. Photoresist thickness was measured at 27 pin. Development scans were taken over an alignment feature, shown at right with approximate scan path. Sample 4 appeared to yield full development, but at the expense of resolution, as shown below. . . .159
E.2 Brightfield images of AZ4620 development after 90 seconds. As listed in Table E. 1, all samples except Trial 4 were developed in AZ400K 4:1 developer. Trial 4 was developed using AZ405 MIF. . . . 160
E.3 Brightfield images of AZ4620 development after full development (5-15 minutes, as listed in Table E. 1). Trial 1 was re-exposed and developed as Trial
1b.
Trial 2 was not developed further. . . . 161E.4 SEM images of developed AZ4620. Scale bars represent 50
pm
on all images. Trials 4 and 5 appear to be fully developed, potentially over-developed. All images were taken at a 25' angle. . . . 162E.5 Profilometer scans of developed AZ4620. Scans were taken over an alignment feature as before. The double-coat protocol produced approximately 23 pim thickness, while the slow, single coat protocol yielded 21 pm. . . . 163
E.6 Brightfield image of Wafer 1. Conditions described above. . . . 164
E.7 Brightfield image of Wafer 2. Conditions described above. . . . 165
E.8 Brightfield image of Wafer 3. Conditions described above. . . . 166
E.9 SEM of Wafer 1. Scale bar represents 50 pm in all images. . . . 167
E.10 Development of Wafer 2. Scale bar represents 50
pm
in all images. . . . 168E.11 Development of Wafer 3. Scale bar represents 50 pin in all images. . . . 169
E. 12 Plating rate as a function of current (left) and plated area (right). The bare electrode was measured at 120.6 6.3 nm. Current was applied for 45 min . . 170
E. 13 Electron dispersive spectroscopy spectrum performed on a plated post. . . .. 171
List of Tables
2.1 Comparison of various lipid measurement techniques with the potential of a dielectrophoretic sorting device. FACS and chromatography are only
techniques currently available in a commercial setting. . . . . 31
3.1 Living organisms metabolize nutrient sources to produce biomolecules and energy. Different types of organisms can intake different energy and carbon sources. ... ... .. ... . ... ... . ... . .. .. 33
3.2 Selected examples of metabolic engineering used to boost lipid production in C. reinhardii and Y. lipolytica. . . . . 35
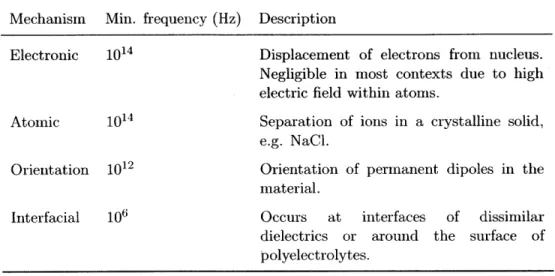
4.1 Mechanisms of dielectric polarization. Cell polarization is governed by the contributions of orientation and interfacial polarizations. . . . 43
4.2 Comparison of the Clausius-Mossotti factor for dielectrics, conductors, and real materials. The derivation above is generalizable to all of these cases. Real materials have both a lossless component as well as a frequency-dependent lossy com ponent. . . . . 45
4.3 Material properties used in the estimated Clausius-Mossotti spectra (Figure 4.8). The listed radii for the lipid body correspond to 15% lipid and 45% content by volume. Note that typically, lipid content is reported as a function of dry cell weight, after extracting the lipids and burning the remainder of the biomass. The values here are cell volume fraction, which will be lower than the dry cell weight. . . . . 50
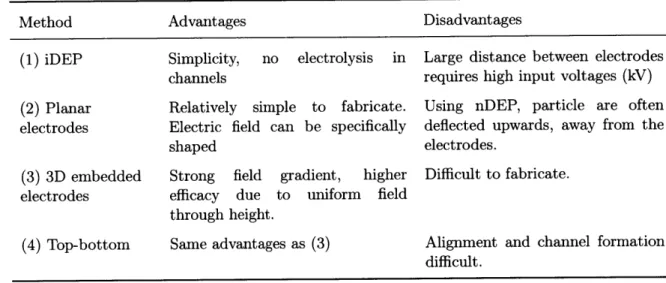
4.4 Summary of the advantages and disadvantages of major DEP sorting methods. 51 5.1 Fixed parameters to create Figures 5.1-5.3. Values for the varied parameters are labeled on each figure. . . . . 57
6.1 List of fabrication techniques used. . . . . 66
6.2 Troubleshooting guide for AZ4620 photoresist. . . . . 75
6.3 Examples of electroplating failure modes. . . . . 78
9.1 Mean and standard deviations of the cell positions at the entry and exit of the array. . . . ... . . . 105
A. 1 Recommendations of mitigating problems encountered with the conducting post sorter. . . . 114
E. 1 AZ 4620 exposure and development parameters. . . . 158
E.2 AZ 4620 exposure and development parameters, Jan 9th experiments. . . . . 163
Chapter 1
Introduction
This thesis details the design and demonstration of a device for selecting single celled organisms based on their lipid content. The device falls within the "lab on a chip" field, as well as the renewable energy industry, since microorganisms show a lot of promise as a future, green, oil supply
[5,
6, 7, 81. In this work we explore the hypothesis that lipid accumulation within a cell changes its dielectric properties sufficiently in order to identify and select high lipid producers. We find that cells containing greater than 45% lipid content can be distinguished from low-lipid-content cells above 150 MHz. At this frequency, we were able to utilize our custom microfluidic device to separate high and low lipid cells from a heterogenous stream, with 98% purity in the rejection stream and 71% purity in the target stream. Thus, we also offer a number of suggestions for reducing the false positive rate and device robustness overall.This manuscript is organized into three areas of discussion. First, in Chapters 1-3, we discuss the motivation and context for this work. This context includes the potential impact within the renewable energy sector, and also some of the scientific background regarding the biology of microorganisms. In Chapters 4-5, we discuss the physical background behind dielectrophoresis, the electrokinetic behavior that is the fundamental operating principle in our device. We also present models specific to the hardware we have designed. Chapters
6-9 all discuss hardware. This includes fabrication methods, experimental protocols, and
results. We begin by discussing the context in this chapter.
1.1
Biodiesel
Renewable energy is being approached in a variety of different ways, from improved batteries to nuclear fusion to solar collectors and more. With respect to the transportation industry, however, one factor still puts gasoline and diesel far ahead of its green counterparts: energy density. With the exception of nuclear energy and coal, no other energy storage mode comes within an order of magnitude.
Despite its particular relevance today, biodiesel is not a new concept. In fact, shortly after the invention of the engine bearing his name, Rudolph Diesel himself published an observation in the Journal of the American Society for Naval Engineers
19]:
At the Paris Exhibition in 1900 there was shown by the Otto Company a small Diesel engine which, at the request of the French Government, ran on Arachis-oil,* and worked so smoothly that only very few people were aware of it. The engine was constructed for using mineral oil, and was then worked on vegetable oil without any alterations being made. The French Government at the time thought of testing the applicability to power production of the Arachide or earth-nut, which grows in considerable quantities in their African colonies, and which can be easily cultivated there; because in this way the colonies could be supplied with power and industry from their own resources, without being compelled to buy and import coal or liquid fuels.
(Arachis oil is a variety of peanit oil.) Diesel explains that following this demionstratioi.
lie has replicated the experiments and found the engine performance to be very near that when running on petrodiesel.
Slightly newer, however, is the use of microorganisms for biofuels. Single-celled organisms such as algae, yeast. and bacteria produce oils through the same metabolic processes as more complex plants (and, in fact. all living organisms). Figure 1.1, from Beer et al. [1], shows the many potential byproducts. diesel included, from algal metabolism. As we will cover in Section 2.1, fuel production from microbes has many advantages over terrestrial plant-based fuels, such as corn ethanol or vegetable oil diesel. Bacteria
110]
and yeast181
have also been investigated.*TAftH Plo-N,3E
1.2 D mandfor cll srtin
celedalges Nabte tty acriglt Iethselct rvgnies (TAare wa ahiar
Start. new cultures Direct use withi high-lipid of oils
producers
Sor with Mixed cultureC Of
high and low lipid cells . .
Discard
Figure 1.2: The ability to sort live cells from a heterogenous culture would greatly increase the throughput of metabolic engineering research and wild type strain screening.
content iil a cell using flow cytonetry or chromatography. In flow cytoinetry, the cells are stained with one of two lipophilic dyes: Nile Red or BODIPY. However, these dyes tend to be rather weak. and for photosynthetic organisms, the Nile Red emission band overlaps with chlorophyll autofluorescence. Thus, fluorescent lipid stains have significant limitations. Chromatography can provide a complete profile of the fatty acid distribution. However, it is generally slow (1-2 days processing time), destructive to cells, and requires large sample volumes. Thus, there is demand for a high throughput and non-invasive method for sorting single cells based on lipid content (Figure 1.2).
1.3
Hypothesis: sorting based on dielectric properties
We hypothesize that due to the fact that lipids have vastly different dielectric properties than cell cytoplasm, cell with high lipid content will respond in distinguishable manners to a non-uniform electric field. When a cell or particle is placed ini an electric field, it polarizes to somfel extent [121. The orientation of the resultant dipole depends on the relative properties of the cell and surrounding medium. If the field is non-uniform. as shown in Figure 1.3. the electrostatic force on each end of the dipole will be unbalanced, and the cell will move in the direction of the net force. This behavior is called dielectrophoresis (DEP), and will be discussed in detail in Chapter 4.
An ideal dielectric material is completely insulating and will polarize in an electric field, creating an internal counter field. An ideal conductor. on the other hand. conducts electricity and does not induce its own field. The conducting and dielectric behaviors of a material represent the storage and loss components of electrical energy. not unlike elasticity and
viscosity in the mechanical domain.
Microbes are generally assumed to be highly conductive particles, surrounded by a thin. insulating membrane. This model is based on the fact that the cells consist of the cytoplasm,
surrounded by '
phospholipid membrane. The cytoplasm is mostly ions in solution, gvg it a high conductivity.
In contrast. the lipid bodies in the cell are electrically insulating, lke the phospholipid membrane. Therefore, we expect that cells containing high lipid fractions act primarily as insulators, while low lipid cells act more like the traditional conducting cell. This should
Positive DEP Negative DEP
104
-Figure 1.3: An induced dipole in a ion-uniform electric field will experience a net force that drives it either toward or avay from regions of high electric field. This behavior is called dielectrophoresis (DEP). and the direction of the force depends on the dipole orientation.
lead to distinct polarization behaviors, as shown in Figure 1.3. The physics behind this polarization are review in Chapter 4, while the sorting principle based on DEP is covered in Chapter 8.
1.4
Contributions of this thesis
We took a three-pronged approach to this research: (1) modeling of cell dielectric properties and device behavior. (2) experimental exploration of the frequency-dependent dielectric properties of lipid-containing organisms, and (3) design and testing of a inicrofluidic sorting chip. Our modeling and testing the relationship between lipid accumulation and dielectric properties is one of a handful reported works that apply DEP to select based on lipid content
[13, 14, 151. In this research, we find that lipid accumulation has little effect at frequencies
below 150 MHz. Exploration into the high frequency DEP response of cells is less common 116, 14].
Lastly. we designed an original microfluidic device and developed custom methods for its fabrication. The device was developed based on the results from (1) and (2), and uses DEP to physically sort cells of high and low lipid content.
This thesis contributes to a body of knowledge that relates physiological properties of cells to their electric properties. The contributions of this work can be categorized as follows:
1. Understanding of the dielectric behavior of eukaryotic organisms at high field
frequencies, and how this relates to oil accumulation in a cell.
2. Investigation of a rapid, low-current method of electroplating 25 im features for use in microfluidics.
3. The design. simulation, and troubleshooting of a DEP sorter containing conducting
Chapter 2
Research motivation
2.1
Status of microbial fuels
Producing biofuels from microrganisms is a widely studied area. There are many design choices and many approaches being pursued, from the organism itself to the resultant fuel, and all of the process steps in between. In 2011, the Nature Publishing Group distributed a special edition: Nature Outlook, Biofuels [17]. This supplement detailed the wide array of biofuels, including bacterial ethanol production and biodiesel from yeast and algae. A common theme among all of the approaches is that the technological crux-how to make a fuel from the metabolic products-has been solved [7, 8]. As noted previously, we have known about the utility of biofuels for nearly as long as we have been combusting fuel. The challenge, instead, is how to create a sustainable life cycle; cultivating and processing these fuels in a way that is both net energy positive and cost effective over the entire process.
2.1.1 Biodiesel from yeast and algae
In this work, we focus on a limitation known in the production of microbial biodiesel. Algae, yeast, and bacteria are all being investigated in the present day. Historically, though, algae has received the most attention, with research beginning in 1970s with the Aquatic Species Program (ASP). This program, sponsored by the U.S. Department of Energy, lasted from
1978 to 1996
[7].
The ASP successfully produced diesel from algae, but the cost was not competitive with the price of fossil fuel and the program was abandoned. Two decades later, environmental concerns, volatility in the supply of petroleum-based oil, and the desire for energy independence have all renewed interest in the search. The major challenge today is the scale-up from promising laboratory results to a true manufacturing process.In May 2010, the DOE published the National Algal Biofuels Roadmap [2], which identified a number of major opportunities for advancing the production of algal biofuels. These include the need to: "Develop small-scale, high-throughput screening technologies.. .Improve on strains for desired criteria by gene manipulation techniques or breeding... [and] Optimize
systems for algal productivity of fuel precursors (e.g. lipids)."
While this chronology concerns algae specifically, there is growing interest in utilizing yeast (and bacteria) as a feedstock as well. The key is to be able to produce sufficient neutral
Algal Biology
Sample strains from a wide vaiiety of environments for maximum diversity Develop small-scale, high-throughpu screening technologies 4
Develop open-access database and collections of existing strains with detailed characterization Investigate genetics and biochemical pathways for production of fuel precursors
Improve on strains for desired criteria by gene manipulation techniques or breeding
Figure 2.1: The National Algal Biofuels Roadmap from the U.S. Department of energy recognizes the need for strain selection techniques as a major technological prioritY in the renewaTble etiergy sector
12].
0 H2C
-o
1 0 HIC -O 0 H C O9 12 15 H2C-O aFigure 2.2: Tiriacylglycerides (TAGs) are made of up a glycerol backbone (left) and three fatty acid chains. Figure from Public domain, by Wolfgang Schaefer.
lipids,
i.e. triacylglycerides (TAGs). TAGs are long chain compounds niade up of glycerol and three fatty acids (Figure 2.2). They are easily converted to diesel by transesterification. which yields diesel ii at a 1:1 stoichiornetric ratio. Therefore, any iticrease in the averageTAG content of a culture will have a direct affect on the diesel vield. Algae and yeast are
attractive because they can produce high quantities of TAGs relative to other fatty acids
118, 19].
2.1.2 Advantages over terrestrial plants
Land usage
There are undoubtedly many reasons to pursue biodiesel productioti as a replacement for petroleuiii products. A lesser understood question is perhaps: what are the advantages of microorganism cultivation over more well knowii, terrestrial plants such as soybean or corn? One answer is given by Figure 2.3. A conmmon objection to biofllel crops is that they compete with farmlanid that is necessary for food production. Microorganisms, however, lack root systems and cellulosic structures, have less "overhead" than larger plants and are thus much imiore efficient etiergy producers. This means that the land requirement for microbial biofuel production is orders of magnitude lower than for traditional plants.
In addlitioli to the lower land requirements. many species. of algae in particular, do not require arable land to grow. Algae exist iii nearly all environments, and there are species that grow on brackish or even salt water. Modern bioreactors can also be angled, stacked,
2.0 bil. acres within
lower 48 s tt t 2.;-%, U.S. crop land will satisfy
~-- - -/% of the transportation fuel
434 mil. demanis using microalgae
acres arable I.And
*t
t1 S. I tansporation fuelconsumilp-tion, annually: 140 bil. gallons Corn: 846%
Figure 2.3: The land requirements for producing algal biodiesel are orders of magnitude lower than those of terrestrial plants. It is estiniated that algae could satistfy 50% of domestic, transportation fuel demand while covering only 2.5% of the currently farmable land area [31.
or otherwise housed to occupy even less real estate (Figure 2.4). Microbial biodiesel is a sinple, )ortal)le solution that works around the globe.
Environmental benefits: Wastewater treatment and carbon capture
The nutritional requirements of many mlicroorganisms can, in sone cases. 1)e met 1y waste effluent from other processes. Bioreactors exist that can run on municipal and industrial wastewater 121, 22, 231, or even brewery effluents [241. Photosynthetic organisms have the conl)ined effect of removing CO2 from the atmosphere:
CO2 + H,0 + I)hoton1s > C6H12O6 + 09
Advocates of algal biodiesel )oint out that bioreactors can be situated near traditional power
plants or other refineries that produce carbon dioxide [25, 26. 271. Algae utilization of CO2 can actually be significantly higher than the levels found in the atmosphere [251. therefore co-locating algae farms with other forms of power generation is quite favorable.
t
II
F~(A) Tubulnar reactor by bbi-biotech (H) Column ractor by 1201
Figure 2.4: In addition to having lower overall land requirements, reactors for microorganism
Figure 2.5: Searching for an organism with both high lipid production and high growth rate has been compared to finding a large marathon runner. Craig Mottram, of Australia, is 62". standing nearly a head above most of his competitors.
2.2
Current cell selection techniques
A bottleneck for this industry is selecting cells that have simultaneously a high growth rate
and a high TAG fraction. as well as the ability to grow consistently under a wide range of conditions. This is the proverbial needle-in-haystack problem. Alternatively, as one researcher more bluntly stated it. "These requirements are similar to demanding a marathon runner to be obese" 1281. While this obese marathon runner may be difficult to find, there
are, at least, rather large ones (Figure 2.5). Similarly, through meticulous strain selection, scientists have been able to identify a number of strains that show promise for the biodiesel industry.
Current screening techniques lack either throughput, yield limited information, or both
[29J. We discussed the only two conunercially available tools, flow cytometry and chromatography, in Section 1.2. For rapid benlinarking of lipid content in live cultures, flow cytometry is certainly the gold standard. Unfortunately, lipophilic dyes can have unreliable uptake in live cells, particularly with neutral lipids. Furthermore, Nile Red's emission band overlaps with chlorophyll fluorescence, requiring very narrow band filters for good imaging. Chromatography can provide a full spectrum of the fatty acids in a cell. However, chromatography can only be performed on extracted lipids, and requires days of preparation.
A handful of other technologies are being explored in research settings. Raman spectromnetry
has been shown to accurately yield the fatty acid profile of live cells 130]. This is similar to the output of chromatography. The spectrometry was performed on a confocal microscope and compared to known emission spectra of each fatty acid. Fourier Transform Infrared Spectroscopy (FTIR). miniaturized gas chromatography and nuclear magnetic resonance are also being explored 1311. Table 2.1 compares conventional methods with our device.
Table 2.1: Comparison of various lipid measurement techniques with the potential of a dielectrophoretic sorting device. FACS and chromatography are only techniques currently
available in a commercial setting.
FACS Chromatography DEP li-fluidic device
Throughput Yes No No
Single-cell detection Yes No Yes
Sorting Yes No Yes
Culture volume ml L II
Label required Yes No No
Preparation 30-60 min. days 15-30 min
2.3
Literature review
Microfluidics and dielectrophoresis (as well as microfluidic dielectrophoresis) have existed for long enough that there are excellent review articles on the subject. We defer to those references here for detailed discussion. These include reviews by: R. Pethig, 2010 [32]; M.P. Hughes, 2002 [33]; M. Li et al., 2014 [34]; J. Voldman, 2006 [35]; and C. Zhang et al., 2009
[36].
In Figure 2.6, we have categorized the major works relating to one or more of: cell sorting, dielectrophoresis, lipid assessment. The relationship between a given work and our work is shown by the arrow traces. The set of red arrows describes our work: a dielectrophoretic sorter that contains three-dimensional electrodes and selects based on lipid content. Details of DEP-based methods shown at the lower right are discussed in Section 4.4.2.
Measure Sort
Cells Beads [37. 38 39, 40] Cells frOil beads [41, 42]
Live lDead Phenotypic Changes Lpid Co~ntent Noii-DEP DEP Ranian spec.
130,
43]1
NMR [44, 31] Fluorescence [45, 46] Electrode-based Insu Planar [49, 50, 51, 52. 53. 541] ator-based 147, 481] Three-dimensionalI55,
56, 57, 58]Figure 2.6: This flowchart categorizes the published literature most related to our work. Bold traces indicate technologies with the strongest relationships to our device, and red traces describe this work specifically. DEP-based sorters in particular, shown in the lower right of the figure, are discussed in more detail in Section 4.4.2
Chapter 3
Biochemistry of lipid-producing
microorganisms
We are interested in finding cells that can produce a renewable hydrocarbon source. The previous chapter described many of the practical advantages in cultivating single-celled organisms. In this chapter, we will review the underlying biochemistry that makes the organisms optimal as an oil feedstock.
3.1
Metabolism
All living organisms produce hydrocarbons. As any high school biology textbook will point
out, hydrocarbons, i.e. fats, are one of the three major classes of biomolecules (the other two being proteins and carbohydrates). Metabolism is the conversion of various food sources into these three types of molecules. From an engineering perspective, metabolism is a chemical energy conversion process that requires energy, electrons, and carbon and produces biomolecules and a different form of energy. Table 3.1 illustrates this, and lists some common metabolic inputs and outputs.
Organisms are classified by what set of inputs they can metabolize. We studied two of these types: phototrophs and chemotrophs. Phototrophs utilize sunlight as their energy Table 3.1: Living organisms metabolize nutrient sources to produce biomnolecules and energy. Different types of organisms can intake different energy and carbon sources.
Inputs -+ Metabolism -+ Outputs
1. Energy 1. Energy
e.g. sunlight, sugars
2. Electron donor e.g. photosynthesis, Krebs Cycle 2. Biomolecules: lipids,
e.g. ammonia, ions carbohydrates, proteins
3. Carbon sources
e.g. C02, sugar