Published in: Journal of the American Society of Nephrology (2019), vol. 30, n°10, pp. 1785-1805
DOI:10.1681/ASN.2019030238 Status : Postprint (Author’s version)
CKD: A C
ALL
FOR
AN
A
GE
-A
DAPTED
D
EFINITION
Pierre Delanaye,1 Kitty J. Jager,2 Arend Bökenkamp,3 Anders Christensson,4 Laurence Dubourg,5 Bjørn
Odvar Eriksen,6,7 François Gaillard,8 Giovanni Gambaro,9 Markus van der Giet,10 Richard J. Glassock,11
Olafur S. Indridason,12 Marco van Londen,13 Christophe Mariat,14 Toralf Melsom,6'7 Olivier Moranne,15
Gunnar Nordin,16 Runolfur Palsson,12,17 Hans Pottel,18 Andrew D. Rule,19 Elke Schaeffner,20 Maarten W.
Taal,21 Christine White,22 Anders Grubb,23 and Jan A. J. G. van den Brand24
Affiliations are listed at the end of this article.
P.D. and K.J.J. contributed equally to this work as co-first authors.
ABSTRACT
Current criteria for the diagnosis of CKD in adults include persistent signs of kidney damage, such as increased urine albumin-to-creatinine ratio or a GFR below the threshold of 60 ml/min per 1.73 m2.
This threshold has important caveats because it does not separate kidney disease from kidney aging, and therefore does not hold for all ages. In an extensive review of the literature, we found that GFR declines with healthy aging without any overt signs of compensation (such as elevated singlenephron GFR) or kidney damage. Older living kidney donors, who are carefully selected based on good health, have a lower predonation GFR compared with younger donors. Furthermore, the results from the large meta-analyses conducted by the CKD Prognosis Consortium and from numerous other studies indicate that the GFR threshold above which the risk of mortality is increased is not consistent across all ages. Among younger persons, mortality is increased at GFR <75 ml/ min per 1.73 m2, whereas in elderly people it is increased at levels <45 ml/min per 1.73 m2.
Therefore, we suggest that amending the CKD definition to include agespecific thresholds for GFR. The implications of an updated definition are far reaching. Having fewer healthy elderly individuals diagnosed with CKD could help reduce inappropriate care and its associated adverse effects. Global prevalence estimates for CKD would be substantially reduced. Also, using an age-specific threshold for younger persons might lead to earlier identification of CKD onset for such individuals, at a point when progressive kidney damage may still be preventable.
The current criteria used for the definition of CKD in adults are: (1) signs of kidney damage, most often determined by an elevated urine albumin (or protein)- to-creatinine ratio (ACR); or (2) reduced kidney function, indicated by GFR <60 ml/min per 1.73 m2. GFR is considered the best determinant
of kidney function,1 and CKD is staged according to six GFR categories (G1, G2, G3a, G3b, G4, and
G5) and three categories for urine ACR levels (A1, A2 and A3) (Table 1). There is abroad agreement that abnormal urine ACR should trigger a diagnosis of CKD, but controversy remains regarding the most appropriate diagnostic criteria regarding GFR. In this article, we will focus on the role of GFR in the definition of CKD. Laboratory thresholds for disease identification are commonly determined in two ways.2-4 First, the distribution of the laboratory results in a representative population of healthy
persons is obtained and thresholds for defining disease are calculated according to extreme values based on this distribution (typically 95th or 97.5th percentile for “too high” and 2.5th or fifth percentile for “too low”). Second, a threshold associated with an adverse outcome is identified through epidemiologic studies. We will discuss these two strategies (reference distribution and prognosis) in the specific case of using GFR for CKD definition.
CURRENT CKD DEFINITION AND RELATED
CAVEATS
The current and widely adopted definition of CKD in adults is based on the 2013 Kidney Disease
Improving Global Outcomes (KDIGO) guidelines.1 Although not entirely undisputed, we do recognize
the merit of these guidelines, as they standardized the definition of CKD.5-11 Not only is GFR one of
the two main criteria for diagnosis of CKD, an isolated GFR <60 ml/min per 1.73 m2 (confirmed with
a second value after at least 90 days) suffices for the diagnosis of CKD. In other words, anyone with a GFR <60 ml/min per 1.73m2 persisting for at least 3 months, by definition, has CKD, even if the
urine ACR and structure or kidney morphology (ascertained by imaging or biopsy) are normal (e.g., category G3a GFR/stage A1 level of albuminuria), and irrespective of an individual’s age.
The considerations in favor of a fixed threshold at 60 ml/min per 1.73 m2 in the current CKD
definition proposed by KDIGO are as follows:1
1. Simplicity. Only one number needs to be kept in mind. This argument is understandably relevant
for nonnephrologists and patients, but carries the risk of oversimplification of the complexities of kidney pathophysiology.
2. Biology. AGFR <60 ml/min per 1.73 m2 is believed to represent <50% of the kidney function
measured in healthy young adults.1 The choice of 50% of normal function is, however, arbitrary,
and whether GFR in healthy young adults is actually about 120 ml/min per 1.73 m2 is debatable.
This value was originally based on measured GFR (mGFR) values compiled and published in 1969
by Wesson.12 More recent studies have shown that median GFR values in healthy young adults
are <120 ml/min per 1.73 m2.13-15 Indeed, one meta-analysis of mGFR data in 5482 living kidney
donors found normal mean GFR values of 106.7 ml/min per 1.73 m2 at ages 20-30 years.14 Such
values were also observed in a large cohort of 2007 French living kidney donors <40 years of age, with a mean mGFR of 107.2 ml/min per 1.73 m2.15
3. Prognosis. The third argument for a threshold at 60 ml/min per 1.73 m2 was based on the
association of lower GFR values with increased morbidity and mortality. Many large epide-miologic studies, especially from the CKD Prognosis Consortium, have seemingly supported the
choice of the 60 ml/min per 1.73 m2 threshold for CKD. We will discuss this argument in depth
Table 1. Current CKD staging according to GFR and urine ACR
CDK Stage Measurement
GFR category GFR (ml/min per 1.73m2)
G1 ≥ 90 G2 60-89 G3a 45-59 G3b 30-44 G4 15-29 G5 <15
ACR category Urine ACR (mg/g)
A1 <30
A2 30-300
THE PROGNOSTIC ARGUMENT FOR AN AGE-ADAPTED DEFINITION OF CKD
Absolute risks of mortality are typically higher in older patients simply because of the limited human life span. Regarding relative risk, several studies from the CKD Prognosis Consortium have
dem-onstrated that GFR <60 ml/min per 1.73 m2 was independently associated with adverse outcomes,
particularly cardiovascular events and all-cause mortality,16-28 thereby confirming findings from the
seminal study published by Go et al.29 in 2004. Of note, most of the Consortium analyses of GFR and
risk of adverse events in both high-risk and general populations use as the reference group partici-pants with only a single eGFR available (hence, no confirmation of chronicity) of ≥ 95 ml/min per 1.73 m2.16-28 However, the Consortium’s 2012 metaanalysis, which was dedicated to age and
included more than 2-million individuals from 46 different cohorts (33 from the general population
and 13 CKD cohorts), used 80 ml/min per 1.73 m2 as the reference group eGFR rather than 95
ml/min per 1.73 m2.17 The associations with mortality and ESKD remained significant when eGFR was
<60 ml/min per 1.73 m2 in all age categories, although hazard ratios were much lower in older
people.17 Although the risk of ESKD was increased, the progression to ESKD in elderly patients with
an eGFR of 45-59 ml/min per 1.73 m2 and no abnormal urine ACR is very rare (< 1% risk in 5 years
using the Kidney Failure Risk Equation).30
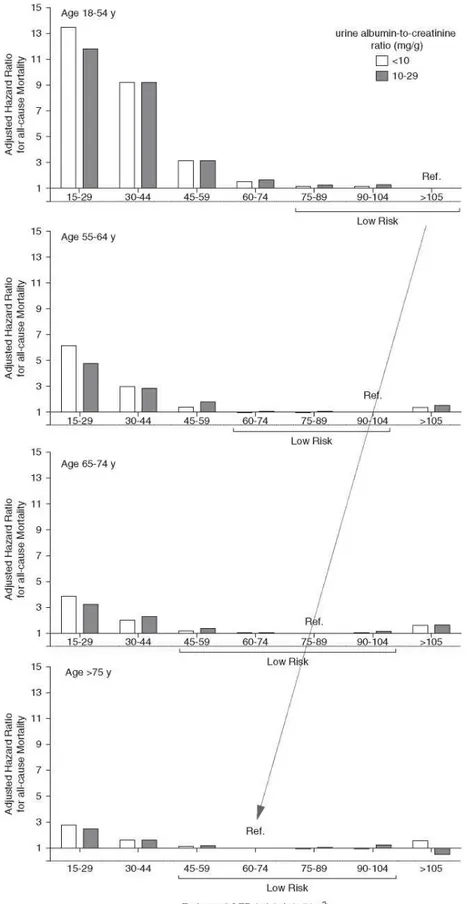
Given the critical importance of the choice of the reference group in such analyses, others have reanalyzed the data from the CKD Prognosis Consortium for mortality using different reference groups based on age (Figure 1).31-34 In these analyses,31’34 the reference eGFR group in each age
category was defined as the one with the lowest mortality risk (in subsets with urine ACR < 10 or 10-29 mg/g). The results revealed that, in the 55-64 years age category (reference eGFR 90-104 ml/min
per 1.73 m2), the mortality risk began to increase when GFR fell below 60 ml/min per 1.73 m2.
However, for people older than 65 years (reference eGFR 75-89 ml/min per 1.73 m2), the risk was
trivial until the eGFR had fallen below 45 ml/min per 1.73 m2. In the youngest age category of 18-54
years (reference eGFR > 105 ml/min per 1.73 m2), the risk of mortality started to increase when
eGFR was <75 ml/min per 1.73 m2.31-34 Therefore, an agespecific analysis of the data used by the
CKD Prognosis Consortium provides a strong argument for an age-adapted definition of CKD using appropriate prognostic strata for age.
Tables 2 and 3 summarize the studies on associations between eGFR and risk of adverse events outside of the CKD Prognosis Consortium. The analysis considered only published full-length articles. We included studies that used creatinine- based equations (Modification of Diet in Renal Disease study or CKD Epidemiology Collaboration [CKD-EPI] equations) and reported adjusted risks of cardiovascular or all-cause mortality.29,35-55 We excluded studies that had only participants with eGFR
categories G3-G5 and those without older individuals. Instead, we focused on studies that were per-formed in elderly individuals or reported results in separate age categories. Our main hypothesis was that the increased risk of mortality associated with lower eGFR differs across age categories and, notably, that an eGFR of 45-60 ml/min per 1.73 m2 in older age groups is not associated with excess
mortality.
When looking at studies that presented a separate eGFR category of 45-60 ml/min per 1.73 m2 and
used eGFR >60 ml/min per 1.73 m2 as a reference category, only a few studies demonstrated an
in-creased risk,43,45,49,56 whereas others did not.40,41,47,48 The largest study to date included a separate
Figure 1. Theassociation betweeneGFRand all-cause mortality depends on the age
group.Hazard ratio for mortality when the reference group is the one with the lowest risk. eGFR ranges are within the brackets (low risk) and are not significantly different from the reference
group (from Denic et al.34).
The results showed that, in this eGFR category, the risk of death was not higher than in the category eGFR>60 ml/min per 1.73 m2.36 In addition, the Renal Risk in Derby study deserves
particular attention, as it included follow-up data on eGFR.55 A total of 1741 participants, most
with confirmed CKD, were prospectively followed for 5 years. The mean age of the cohort was
72.969 years, the mean eGFR using the CKD- EPI equation was 54±12 ml/min per 1.73 m2, and
most participants had normal urine ACR. After 5 years, 34.1% of the cohort was considered to be stable and 19.3% had even improved their GFR category. Nearly all of the participants who improved their CKD status had been classified as category G3a/A1 at baseline.55 Interestingly,
the age- and sex-standardized mortality rates of those with category G3a GFR were similar to those in the general population, whereas those with category G3b or G4 at baseline had higher mortality rates.55,57
Regarding the prognosis argument, we acknowledge that our proposal of an age-adapted definition for CKD is mainly based on mortality risk. We did not consider other outcomes, even though other publications have reported the risk of lower GFR with classic metabolic compli-cations of CKD (anemia, hyperparathyroidism, acidosis, hyperphosphoremia)58,59 and other
clinical complications (such as frailty, impaired quality of life, and fracture).60,61 These studies,
unfortunately, are of little utility in informing our proposal of an age-adapted threshold. Although higher risk of these complications is frequently observed when eGFR is <45 ml/min per 1.73 m2,58 results are much more variable at higher eGFRs (unlike mortality, the definitions of specific
complications or of clinical status are not uniform).
In summary, most studies showed no or a trivial additional mortality risk for older adult participants with an eGFR of 45-59 ml/min per 1.73 m2 and normal urine ACR. Prognostic
arguments thus favor an age-adapted threshold for eGFR in the CKD definition.
KIDNEY SENESCENCE AS AN ARGUMENT FOR AN
AGE- ADAPTED DEFINITION OF CKD
Another concern with a GFR threshold fixed at 60 ml/min per 1.73 m2 is that it fails to account for
the distinct microstructural and macrostructural differences between the aging kidney and kidneys affected by CKD. It also does not take into account the fact that a substantial proportion of healthy older people have an mGFR of <60 ml/min per 1.73 m2.
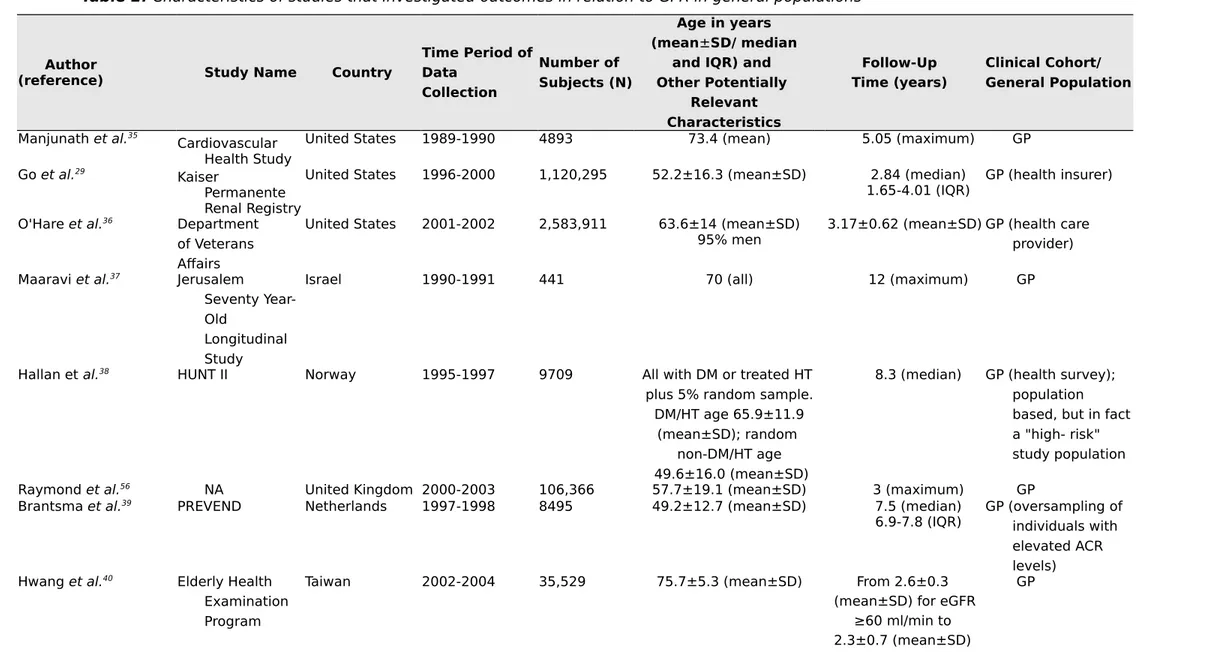
Table 2. Characteristics of studies that investigated outcomes in relation to GFR in general populations
Author
(reference) Study Name Country
Time Period of Data Collection Number of Subjects (N) Age in years (mean±SD/ median
and IQR) and Other Potentially Relevant Characteristics Follow-Up Time (years) Clinical Cohort/ General Population Manjunath et al.35 Cardiovascular Health Study
United States 1989-1990 4893 73.4 (mean) 5.05 (maximum) GP
Go et al.29
Kaiser
Permanente Renal Registry
United States 1996-2000 1,120,295 52.2±16.3 (mean±SD) 2.84 (median)
1.65-4.01 (IQR) GP (health insurer) O'Hare et al.36 Department
of Veterans Affairs
United States 2001-2002 2,583,911 63.6±14 (mean±SD)
95% men 3.17±0.62 (mean±SD) GP (health care provider) Maaravi et al.37 Jerusalem
Seventy Year-Old
Longitudinal Study
Israel 1990-1991 441 70 (all) 12 (maximum) GP
Hallan et al.38 HUNT II Norway 1995-1997 9709 All with DM or treated HT
plus 5% random sample. DM/HT age 65.9±11.9
(mean±SD); random non-DM/HT age 49.6±16.0 (mean±SD)
8.3 (median) GP (health survey); population based, but in fact a "high- risk" study population
Raymond et al.56 NA United Kingdom 2000-2003 106,366 57.7±19.1 (mean±SD) 3 (maximum) GP
Brantsma et al.39 PREVEND Netherlands 1997-1998 8495 49.2±12.7 (mean±SD) 7.5 (median)
6.9-7.8 (IQR) GP (oversampling of individuals with elevated ACR levels)
Hwang et al.40 Elderly Health
Examination Program
Taiwan 2002-2004 35,529 75.7±5.3 (mean±SD) From 2.6±0.3
(mean±SD) for eGFR ≥60 ml/min to 2.3±0.7 (mean±SD)
for stage 5 Roderick et al.41 MRC General
Practice Research Framework
United Kingdom 1994-1999 13,177 80.2 (median)
IQR 6.9 7.3 (median)IQR 5 GP (primary care)
Van der Velde et al.42 PREVEND Netherlands 1997-1998 8047 49±13 (mean±SD) 7.0±1.6
(mean±SD) GP (oversampling of individuals with elevated ACR levels)
Muntner et al.43 REGARDS United States 2003-2007 24,350 ≥45 4.5 (median) GP (oversampling of
black people)
Stengel et al.44 Three-City France 1999-2001 8705 74.3±5.5 (mean±SD) 6 (maximum) GP
Van Pottelbergh et al.45BELFRAIL Belgium 2008-2009 539 84.7±3.6 (mean±SD) 2.9±0.3 GP (primary care)
Oh et al.46 KloSHA Korea 2005-2006 949 75.8±9.0 (mean±SD) 5.3±1.4
(mean±SD) GP Minutolo et al.47 Health Search/ Cegedim Strategic Data Longitudinal Patient Database
Italy 2003-2005 30,326 71.0±11.0 (mean±SD) 7.2 (median)
4.7-7.7 (IQR)GP (primary care); population withoutnephrology consultation at baseline
Malmgren et al.48 OPRA Sweden NA 1011 75.2±0.2
(mean±SD) 100% women
10 (all) GP
Chowdhury et al.49 ANBP2 Australia NA 6083 71.9±4.9
(mean±SD) (median)10.8
9.6-11.4 (IQR) RCTpopulationparticipants; hypertensive Nagai et al.50 Ibaraki
Prefecture Japan 1993 89,547 Men 60.2 (mean)Women 57.8 (mean) 17.1 (mean) GP (exclusion of those with history ofCVD)
Corsonello et al.51 InChianti Italy 1998-2000 828 74.4±6.9 (mean±SD) 9
(maximum) GP
Wu et al.52 Kailuan
Study China 2006-2007 95,391 (mean±SD)52.0±12.6 (maximum)8 GP
GP, general population; IQR, interquartile range; DM,diabetes mellitus; HT, hypertension; NA, notavailable; HUNT, Nord-Trøndelag Health Study; PREVEND, Prevention of Renal and Vascular Endstage Disease; MRC, Medical Research Council; REGARDS, Reasons for Geographic and Racial Differences in Stroke; KloSHA, Korean Longitudinal Study on Health and Aging; OPRA, Osteoporosis Risk Assessment; ANBP2, Second Australian National Blood Pressure Study; RCT, randomized controlled trial; CVD, cardiovascular disease
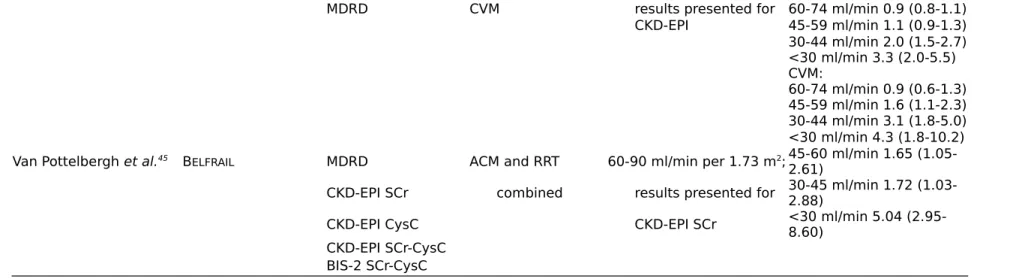
Table 3. Findings of studies that investigated outcomes in relation to GFR in general populations
Author
(reference) Study Name
eGFR/ACR (GFR equation) Outcome Studied (ACMorCVM) Comparison Made and Reference Category
Adjusted Hazard Ratios in
Exposure Categories Comments
Manjunath et al.35 Cardiovascular MDRD ACM 90-130 ml/min per 1.73
m2 60-89 ml/min 1.05 (0.78-1.41)
Health Study 15-59 ml/min 1.47 (1.05-2.06)
Go et al.29 Kaiser Permanente MDRD ACM $60 ml/min per 1.73 m2 ACM: In a subgroup where
chronicity was confirmed (repeated serum creatinine measurements) (n=172,144), eGFR at 45-59 ml/min was not associated with ACM 1.0 (1.0-1.1)
Renal Registry CV events 45-59 ml/min 1.2 (1.1-1.2)
30-44 ml/min 1.8 (1.7-1.9) 15-29 ml/min 3.2 (3.1-3.4) <15 ml/min 5.9 (5.4-6.5) CV events: 45-59 ml/min 1.4 (1.4-1.5) 30-44 ml/min 2.0 (1.9-2.1) 15-29 ml/min 2.8 (2.6-2.9) <15 ml/min 3.4 (3.1-3.8)
O'Hare et al.36 Department of MDRD ACM $60 ml/min per 1.73 m2 18-44 yr: In younger age
categories, adjusted HRs were higher and statistically significant already from 50 to 59 ml/ min.
Veterans Affairs 50-59 ml/min 1.56 (1.30-1.88)
40-49 ml/min 1.90 (1.35-2.67) 30-39 ml/min 3.58 (2.54-5.05) 45-54 yr: 50-59 ml/min 1.27
(1.19-1.36) In younger people and elderly with stable eGFR adjusted HRs were lower in all 40-49 ml/min 1.89
(1.74-2.06)
(2.63-3.18) eGFR categories, 50-59 ml/min was not associated 55-64 yr: 50-59 ml/min 1.18 (1.13-1.23) 40-49 ml/min 1.75 (1.65-1.85) 30-39 ml/min 2.43 (2.27-2.59)
Findings suggest that mortality risk stratification in younger and elderly people should not be based on the same eGFR cut-off points 65-74 yr: 50-59 ml/min 1.02 (0.99-1.05) 40-49 ml/min 1.35 (1.32-1.39) 30-39 ml/min 1.81 (1.75-1.87) 75-84 yr: 50-59 ml/min 1.02 (0.99-1.04) 40-49 ml/min 1.21 (1.18-1.23) 30-39 ml/min 1.55 (1.51-1.58) 85+ yr: 50-59 ml/min 1.02 (0.97-1.06) 40-49 ml/min 1.10 (1.05-1.15) 30-39 ml/min 1.36 (1.29-1.44)
Author
(reference) Study Name
eGFR/ACR (GFR equation) Outcome Studied (ACMorCVM)
Comparison Made and Reference Category
Adjusted Hazard Ratios
in Exposure Categories Comments
Maaravi et al.37 Jerusalem Seventy- MDRD ACM ≥60 ml/min per 1.73 m2 <60 ml/min 1.19(0.83-1.71)
Year-Old CG Results presented for
Longitudinal Study Mayo Clinic MDRD
Hallan et al.38 HUNT II MDRD CVM ≥75 ml/min per 1.73 m2 <70 yr:
and optimal ACR; ACR Optimal ACR:
below sex-specific 60-74 ml/min 1.17 (0.35-3.91) median (<5 and 7 mg/g 45-59 ml/min 0.73 (0.26-2.02) in men and women) <45 ml/min 1.08 (0.19-6.10)
High normal ACR: 60-74 ml/min 1.53 (0.55-4.26) 45-59 ml/min 3.29 (1.02-10.6) <45 ml/min 2.57 (0.88-7.51) Micro-albuminuria: 60-74 ml/min 1.92 (0.71-5.16) 45-59 ml/min 2.22 (0.87-5.70) <45 ml/min 5.94 (2.06-17.2) ≥70 yr: Optimal ACR: 60-74 ml/min 0.79 (0.30-2.10) 45-59 ml/min 2.48 (0.76-8.13) <45 ml/min 1.49 (0.46-4.86)
High normal ACR: 60-74 ml/min 1.68 (0.61-4.69)
45-59 ml/min 1.93 (0.63-5.92)
<45 ml/min 4.70 (1.57-14.1) Micro-albuminuria: 60-74 ml/min 3.80 (1.33-10.80) 45-59 ml/min 4.09 (1.52-10.90) <45 ml/min 8.38 (2.83-24.9)
Author
(reference) Study Name
eGFR/ACR (GFR equation) Outcome Studied (ACMorCVM) Comparison Made and Reference Category
Adjusted Hazard Ratios
in Exposure Categories Comments
Raymond et al.56 NA MDRD ACM $60 ml/min per 1.73
m2 20-44 yr: Stage 3a 13.6(6.2-29.8) Stage 3b 12.1 (4.0-36.5) Stage 4 17.4 (5.9-51.4) Stage 5 26.1 (9.1-74.8) 45-54 yr: Stage 3a 7.5 (4.4-12.6) Stage 3b 13.6 (7.5-24.7) Stage 4 4.6 (1.2-17.4) Stage 5 28.6 (17.4-47.2) 55-64 yr: Stage 3a 3.0 (2.2-4.1) Stage 3b 5.9 (3.9-8.9) Stage 4 9.3 (6.1-14.2) Stage 5 18.2(13.9-23.9) 65-74 yr: Stage 3a 1.8 (1.5-2.1) Stage 3b 3.2 (2.6-3.9) Stage 4 5.2 (4.1-6.5) Stage 5 7.6 (5.7-10.1) 75-84 yr: Stage 3a 1.2 (1.0-1.3) Stage 3b 1.9 (1.7-2.1) Stage 4 3.3 (2.9-3.8) Stage 5 4.4 (3.7-5.3) 85+ yr: Stage 3a 0.9 (0.8-1.0) Stage 3b 1.3 (1.2-1.5) Stage 4 1.8(1.7-2.0) Stage 5 2.5 (2.3-2.8)
Brantsma et al.39 PREVEND MDRD CVM and CV No CKD Stage 1 2.2 (1.5-3.3)
ACR hospitalization Stage 2 1.6 (1.3-2.0)
combined Stage 3 1.3 (1.0-1.7)
Stage 3 with UAE <30 mg/24 h 1.0 (0.7-1.4) Stage 3 with UAE >30 mg/24 h 1.6 (1.1-2.3)
Hwang et al.40 Elderly Health MDRD ACM ≥60 ml/min per 1.73
m2 ACM:
Examination CVM 45-59 ml/min 1.10(1.0-1.2)
1.52(1.3-1.8) 15-29 ml/min 2.1 (1.7-2.6) <15 ml/min 2.55 (1.8-3.6) CVM: 45-59 ml/min 1.30(1.0-1.7) 30-44 ml/min 2.42 (1.7-3.4) 15-29 ml/min 3.62 (2.3-5.8) <15 ml/min 3.22 (1.3-8.3) Author
(reference) Study Name
eGFR/ACR (GFR equation) Outcome Studied (ACMorCVM) Comparison Made and Reference Category
Adjusted Hazard Ratios
in Exposure Categories Comments
Roderick et al.41 MRCGeneral
Practice MDRD ACM ≥60 ml/min per 1.73 m2; ACM after 0-2 yr: Short-term (0-2 yr)
eGFR- related risk is higher than long term (>2 yr) risk (not shown) Research Dipstick proteinuria CVM in those without proteinuria negative Men:
Framework CVD at baseline 45-59 ml/min 1.13 (0.93-1.37)
30-44 ml/min 1.69 (1.26-2.28) <30 ml/min 3.87 (2.78-5.38) Women: 45-59 ml/min 1.14 (0.93-1.40) 30-44 ml/min 1.33 (1.06-1.68) <30 ml/min 2.44 (1.68-3.56) CVM after 0-2 yr: Men: 45-59 ml/min 1.67 (1.15-2.43) 30-44 ml/min 1.60 (0.94-2.73) <30 ml/min 2.89 (1.22-6.84) Women: 45-59 ml/min 1.59 (1.01-2.50) 30-44 ml/min 1.45 (0.93-2.28) <30 ml/min 3.80 (1.87-7.75) ACM:
Men: Proteinuria positive >60 ml/min 1.29 (1.07-1.56) 45-59 ml/min 1.25 (1.02-1.52) 30-44 ml/min 1.08 (0.82-1.42) <30 ml/min 0.95 (0.56-1.59) Women: Proteinuria positive >60 ml/min 1.19 (0.96-1.47) 45-59 ml/min 0.94 (0.77-1.15) 30-44 ml/min 1.39 (1.10-1.77) <30 ml/min 1.70 (1.15-2.52) CVM: Men: Proteinuria positive >60 ml/min 1.05 (0.70-1.57) 45-59 ml/min 1.31 (0.91-1.89) 30-44 ml/min 0.83 (0.47-1.46) <30 ml/min 0.97 (0.35-2.68) Women: Proteinuria positive >60 ml/min 1.18 (0.80-1.74) 45-59 ml/min 0.93 (0.65-1.32) 30-44 ml/min 1.34 (0.88-2.03) <30 ml/min 2.79 (1.40-5.54)
Author
(reference) NameStudy
eGFR/ACR (GFR equation)
Outcome Studied (ACMorCVM)
Comparison Made and Reference Category
Adjusted Hazard Ratios
in Exposure Categories Comments
Van der Velde et al.42 PREVEND MDRD Fatal and nonfatal
CV +10 ml/min per 1.73 m2 <60 yr: The association between eGFRandriskof CV events is weaker in elderly subjects than in younger subjects CKD-EPI SCr events Resultsincrease in eGFR. 0.70 (0.62-0.79)
CysC presented for CKD-EPI $60 yr:
SCr-CysC 1.02(0.92-1.13)
Creatinine clearance
Muntner et al.43 REGARDS CKD-EPI ACM $60 ml/min per 1.73 m2 45-59 yr: If ACR is <10 mg/g,
the results are similar: ACR 45-59 yr: 45-60 ml/min 4.5 (1.8-11.1) <45 ml/min 4.7 (0.7-34.2) 45-60 ml/min 2.5 (1.3-4.6) <45 ml/min 3.5 (1.8-6.8) 60-69 yr: 60-69 yr: 45-60 ml/min 1.9 (1.2-3.1) <45 ml/min 2.5 (1.0-6.1) 45-60 ml/min 1.7 (1.3-2.3) <45 ml/min 2.2 (1.6-3.0) 70-79 yr: 70-79 yr: 45-60 ml/min 1.1 (0.8-1.6) <45 ml/min 2.1 (1.2-3.6) 45-60 ml/min 1.1 (0.9-1.3) <45 ml/min 1.9(1.5-2.4) $80 yr: ≥80 yr: 45-60 ml/min 1.4 (0.9-2.2) <45 ml/min 1.6 (0.9-2.8) 45-60 ml/min 1.3 (1.0-1.7) <45 ml/min 1.5 (1.1-2.0)
Stengel et al.44 Three-City CKD-EPI ACM $75-89 ml/min per 1.73
MDRD CVM results presented for 60-74 ml/min 0.9 (0.8-1.1) CKD-EPI 45-59 ml/min 1.1 (0.9-1.3) 30-44 ml/min 2.0 (1.5-2.7) <30 ml/min 3.3 (2.0-5.5) CVM: 60-74 ml/min 0.9 (0.6-1.3) 45-59 ml/min 1.6 (1.1-2.3) 30-44 ml/min 3.1 (1.8-5.0) <30 ml/min 4.3 (1.8-10.2) Van Pottelbergh et al.45 BELFRAIL MDRD ACM and RRT 60-90 ml/min per 1.73 m2; 45-60 ml/min 1.65
(1.05-2.61)
CKD-EPI SCr combined results presented for 30-45 ml/min 1.72 (1.03-2.88)
CKD-EPI CysC CKD-EPI SCr <30 ml/min 5.04 (2.95-8.60)
CKD-EPI SCr-CysC BIS-2 SCr-CysC
Author
(reference) Study Name
eGFR/ACR (GFR equation)
Outcome Studied (ACM or CVM)
Comparison Made and Reference Category
Adjusted Hazard Ratios
in Exposure Categories Comments
Oh et al.46 KLoSHA CKD-EPI ACM ≥90 ml/min per 1.73 m2; 60-89 ml/min 1.37
(0.75-2.52) If proteinuria:
Disptick proteinuria proteinuria negative 45-59 ml/min 1.65 (0.84-3.25) 1.96)Trace 1.24 (0.78-<45 ml/min 2.36
(1.17-4.75) ≥1+1.73 (1.13-2.63)
Minutolo et al.47 Health Search/ MDRD ACM ≥60 ml/min per 1.73 m2 ACM:
Cegedim
Strategic Stage 3a 1.11 (0.99-1.23)
Data Longitudinal Stage 3b 1.66 (1.49-1.86)
Patient Database Stage 4 2.75 (2.41-3.13)
Stage 5 2.54 (2.01-3.22)
Malmgren et al.48 OPRA CKD-EPI ACM ≥60 ml/min per 1.73 m2; 75-80 yr:
MDRD results presented for 45-60 ml/min 1.1 (0.6-2.0)
Revised Lund-Malmö CKD-EPI 0-45 ml/min 4.5 (2.2-9.2)
BIS-1 75-85 yr: CG 45-60 ml/min 1.4 (1.0-1.9) 0-45 ml/min 3.5 (2.1-5.8) 80-85 yr: 45-60 ml/min 1.7 (1.1-2.6) 0-45 ml/min 2.6 (1.4-5.0)
Chowdhury et al.49 ANBP2 MDRD ACM ≥60 ml/min per 1.73 m2; ACM:
CKD-EPI CVM results presented for 45-59 ml/min 1.13 (1.01-1.27)
CKD-EPI 30-44 ml/min 1.65 (1.37-1.99) <30 ml/min 5.16 (3.17-8.42) CVM: 45-59 ml/min 1.05 (0.89-1.23)
30-44 ml/min 1.64 (1.27-2.13)
<30 ml/min 5.60 (2.32-13.51)
Author (reference) Study Name eGFR/ACR (GFR equation) Outcome Studied (ACMorCVM) Comparison Made and Reference Category Adjusted Hazard Ratios in Exposure Categories Comments
Nagai et al 50 Ibaraki Prefecture MDRD ACM ≥60 ml/min per 1.73 m2 ACM:
CVM Men: 40-69 yr: 45-49 ml/min 1.33 (1.06-1.67) 30-44 ml/min 1.53 (1.20-1.96) 70-80 yr: 45-49 ml/min 1.02 (0.82-1.25) 30-44 ml/min 1.63 (1.33-2.00) Women: 40-69 yr: 45-49 ml/min 1.50 (1.27-1.78) 30-44 ml/min 2.21 (1.81-2.71) 70-80 yr: 45-49 ml/min 1.19 (1.02-1.38) 30-44 ml/min 1.53 (1.31-1.79) CVM: Men: 40-69 yr: 45-49 ml/min 1.82 (1.23-2.69) 30-44 ml/min 1.65 (1.04-2.62) 70-80 yr: 45-49 ml/min 1.03 (0.72-1.48)
30-44 ml/min 1.37 (0.93-2.02) Women: 40-69 yr: 45-49 ml/min 1.34 (0.98-1.82) 30-44 ml/min 2.24 (1.58-3.17) 70-80 yr: 45-49 ml/min 1.43 (1.14-1.79) 30-44 ml/min 1.57 (1.23-2.00)
Corsonello et a!.51 InChianti CKD-EPI
SCr ACM ≥90 ml/min per 1.73 m2; 60-89.9 ml/min 1.63 (0.84-3.17) BIS-1 SCr results presented for 45-59.9 ml/min 2.50 (1.21-5.15)
FAS CKD-EPI SCr 30-44.9 ml/min 5.44 (1.10-27.7)
CKD-EPI
SCr-CysC <30 ml/min 7.42 (1.79-30.6)
BIS-2 SCr-CysC
Author
(reference) Study Name
eGFR/ACR (GFR equation) Outcome Studied (ACM or CVM) Comparison Made and Reference Category
Adjusted Hazard Ratios
in Exposure Categories Comments
Wu et al.52 Kailuan Study CKD-EPI ACM ≥ 90 ml/min per 1.73 m2All:
Dipstick proteinuria 60-89 ml/min 1.01 (0.93-1.09)
45-59 ml/min 1.11 (0.99-1.24) <45 ml/min 1.51 (1.30-1.74) Men: 60-89 ml/min 1.01 (0.94-1.10) 45-59 ml/min 1.11 (0.99-1.23) <45 ml/min 1.35 (1.17-1.57) Women: 60-89 ml/min 1.65 (1.16-2.34) 45-59 ml/min 1.92 (1.25-2.96) <45 ml/min 4.11 (2.50-6.76)
ACM, all-cause mortality; CVM, cardiovascular mortality; MDRD, Modified Diet in Renal Disease Study equation; CV, cardiovascular; HR, hazard ratio; CG, Cockcroft and Gaultformula; MRC, Medical Research Council; CVD, cardiovascular disease; HUNT, Nord-Tr0ndelag Health Study; PREVEND, Prevention of Renal and Vascular Endstage Disease; CysC, cystatin C; REGARDS, Reasons for Geographic and Racial Differences in Stroke; KLoSHA, Korean Longitudinal Studyon Health and Aging; NA, not available; OPRA, Osteoporosis RiskAssessment; ANBP2, Second Australian National Blood Pressure Study; SCr, serum creatinine; BIS1, Berlin Initiative Study; FAS, full age spectrum.
STRUCTURAL DIFFERENCES BETWEEN AGING KIDNEY AND CKD
Among healthy kidney donors, aging is reflected by an indolent nephrosclerosis, characterized by arteriosclerosis, ischemic globally (but not segmentally) sclerotic glomeruli, and interstitial fibrosis and tubular atrophy.62 Although the interstitial fibrosis and tubular atrophy that occur with aging are
fairly minimal,62 there is a substantial nephron loss and dropout (from about 1,000,000 nephrons per
kidney in healthy adults aged 18-29 years to 500,000 per kidney in healthy individuals aged 70-75 years).63 Despite this substantial nephron loss with age, there is no compensation by the remaining
nephrons because glomerular volume, single-nephron GFR, and singlenephron glomerular filtration capacity remain stable.63-65
CKD, on the other hand, is often characterized by disease-specific pathology that differs from age-induced nephrosclerosis. CKD can include unique microstructural findings (such as specific immunofluorescence staining patterns) or macrostructural findings (such as polycystic kidney or renal artery stenosis) that are not seen with aging alone. Although risk factors for CKD such as obesity, diabetes, and hypertension are associated with nephrosclerosis, they are also associated with glomerular enlargement, segmental glomerulosclerosis, and higher single-nephron GFR in intact nonsclerotic glomeruli.63,64 Only when the degree of global glomerulosclerosis exceeds that expected
for age or when there is increased metabolic demand (e.g., obesity and hyperglycemia) is there an increase in single-nephron GFR. Therefore, application of age-adapted thresholds for glo-merulosclerosis is also useful with kidney biopsies performed in clinical care, as only glomerulosclerosis exceeding that expected for age is a risk factor for CKD progression.66,67
DECLINE OF GFR WITH AGING
As already stated, the definition of normality for laboratory results can also be obtainedby the distribution of the results in healthy populations. Establishing reference interval values with a fixed threshold, as per the KDIGO guidelines, would mean that the GFR reference values are constant across all age categories. 13,14,68-81 However, more reliable studies, using mGFR and living kidney
donors or healthy individuals selected from the general population, indicate a clear decrease in GFR with age13-15,64,68-90 and show that the rate of mGFR decline becomes significant after age 40 years. 2,12-15,73,76,80,85,88,91,92 Importantly, such a decline in mGFR with aging has been established on different
continents and in different ethnic groups.68,77,79-81,87,89 From these data, it is obvious that a substantial
proportion of healthy older people have an mGFR of <60 ml/min per 1.73 m2, despite the paucity of
studies focusing on the elderly and using mGFR.
Regarding eGFR,93-95 available cross sectional studies from different parts of the world confirmed that
many people older than 65 years of age have an eGFR value <60 ml/min per 1.73 m2, suggesting a
rather ubiquitous decline of eGFR with age.13,68,96-101 Unfortunately, the few published longitudinal
studies have shown discrepancies in the rate of kidney function decline or suffered from methodological limitations, such as use of eGFR or 24-hour creatinine clearance, inclusion of non-healthy individuals, limited follow-up duration, and study attrition, making it difficult to draw a definitive conclusion about the magnitude of the average rate of GFR decline with aging.
majority of healthy participants.48,96,102-114 The only longitudinal study using mGFR in a healthy
general population is the Renal Iohexol Clearance Survey in Tromsø 6, which included a representative sample of 1594 white people aged 50-62 years from the general population without CKD, diabetes, or cardiovascular disease.
The iohexol clearance measurement was repeated in 1299 (81%) patients after a median period of 5.6 years. The authors showed a mean GFR decline rate of 0.84±2.00 ml/min per year (or 0.95±2.23 ml/min per 1.73 m2 per year). Although this may be the most valid study to date, it nevertheless was
limited by its inclusion of only middle-aged white people and by its relatively short follow-up, with only two measurements in the majority of participants.114
PROPOSALS FOR AN AGE- ADAPTED CKD
DEFINITION
The concept of an age-adapted definition of CKD is not new and has been proposed by a number of authors.2,3,8,10,31,33,34,36,64,98,99,115-124 Such adaptation could be achieved in different ways. We emphasize
that the suggested change in CKD definition should pertain only to people without other evidence of kidney damage (notably those with normal urine ACR).
AGE-RELATED PERCENTILES OF GFR
One way to achieve an age-adapted definition of CKD is to refer to percentiles of GFR in the healthy population, which are available in the literature for mGFR or eGFR in different ethnic groups.13,68,96-99
In practice, this would mean interpreting a GFR result in light of age-specific GFR percentiles, and defining CKD as a value below a given percentile in healthy persons (Figure 2). By relating measurements to percentiles using different mGFR or eGFR methods, this approach may overcome differences in mGFR measurement techniques125,126 or eGFR equations.93,94,127 Using percentiles for
each year of age minimizes the “birthday paradox,” in which healthy people can become classified as having a disease or individuals with a disease can “recover” simply by becoming 1 year older; this problem is inherent to a single -threshold approach or an age-based approach with only a few thresholds.
By employing age-specific means and SDs, the individual patient levels can be transformed into a SD score (SDS), a metric commonly used in pediatrics (or even in adults for diagnosing diseases like osteoporosis, using bone mass density). An SDS value of ≤ -2 corresponds to an mGFR/eGFR at the 2.5th percentile or lower. Calculation of an SDS requires well characterized reference values across the entire age spectrum. Using these data, GFR SDS can be reported directly by the laboratory, analogous to reporting the eGFR results. The SDS is independent of age and method and is therefore ideal for follow-up. Furthermore, reference values may be included in the laboratory report (Figure 2).
A LIMITED SET OF AGE-SPECIFIC THRESHOLDS
One can consider the CKD staging based on three pivotal age categories (Figure 3): <40 years, 40-65 years, and >40-65 years. We suggest GFR cut-offs of 75 ml/min per 1.73 m2 for the youngest group,
60 ml/min per 1.73 m2 for individuals aged 40-65 years, and 45 ml/min per 1.73 m2 for those older
than 65 years. In other words, in individuals older than 65 years, the current CKD category G3a∕A1
(GFR 45-60 ml/min per 1.73 m2) would not be considered to have CKD. Moreover, younger adults
with a GFR <75 ml/min per 1.73 m2 would be considered to have CKD, as their kidney function is
below what would be expected for their age.31,34,97,120,123,128,129 The choice of the different GFR
thresholds can be justified by associations of these thresholds with prognosis (Figure 1).
Potential effect of an UPDATED DEFINITION OF
CKD
A modification of the CKD definition would have a substantial effect on the estimation of CKD prevalence. The KDIGO guidelines used the data from the National Health and Nutrition Examination Survey (NHANES) study (1999-2006) and estimated the CKD prevalence in the US adult general pop-ulation at 11.5%. Individuals with a GFR of 45-59 ml/min per 1.73 m2 and normal urine ACR
represented 3.6% of the general population, and 75% of patients that are classified with CKD solely
by the GFR criterion. Individuals with category G3a/A1 represented >30% of all people with CKD.1
CKD categories 3 or 3a are unequivocally the largest or second largest group in terms of CKD prevalence in other studies as well.47,48,55,56,97,123,130-139 The epidemiologic literature clearly shows that
CKD prevalence increases with age when using the fixed-threshold CKD definition of 60 ml/min per 1.73 m². 1,48,56,97,101,123,130-134,138-143 Most older subjects defined as having CKD have a GFR of 45-59
ml/min per 1.73 m2 and normal urine ACR, whereas the younger individuals more frequently have
elevated urine ACR and GFR >60 ml/min per 1.73 m2.53,97,134,144 Thus, among the 3.6% of the general
population with normal urine ACR and a GFR of between 45-59 ml/min per 1.73 m2 in the NHANES
(19992006) cohort’ a large proportion are adults older than 65 years, without any other signs of kidney damage. These individuals would be considered free of disease with the age-adapted definition proposed above. Likewise, results from the MAREMAR (Maladies Rénales Chroniques au Maroc) study crucially illustrate the important effect of an age- adapted definition on the CKD prevalence. Among the 10’524 individuals screened’ 2.7% had a confirmed eGFR <60 ml/min per 1.73 m2. However, almost half of those with eGFR <60 ml/min per 1.73 m2 had an eGFR above the
third percentile of the population. These people, all older than 55 years and with normal dipstick analysis’ would not be considered to have CKD with the age-adapted definition (using age-related percentiles) and the estimated CKD prevalence based on GFR would decrease from 2.7% to 1.8%, a 33% decrease.97
The current fixed GFR threshold of 60 ml/min per 1.73 m2 not only results in overdiagnosis of CKD in
the older adults’ it may also lead to missed diagnoses of CKD in younger individuals who lack overt
signs of kidney damage and have a GFR above the fixed threshold of 60 ml/min per 1.73 m2 but
below the lowest percentile for their age. This group may include young people with low-nephron endowment, such as individuals born with a single kidney,145 those born preterm146 or at a low birth
weight, patients with Down syndrome,147 or young people with a past history of treatment with
nephrotoxic drugs.148 Such individuals are at risk for developing progressive CKD over their remaining
lifetime, and may experience associated comorbidities and adverse events, including an increase in mortality.33,97,123,129
Because the availability of curative therapies is limited, treatment of CKD rests on the prevention of progressive kidney damage. The sooner younger people with CKD are identified, the greater the likelihood that poor health outcomes may be prevented. In the MAREMAR study, young individuals
with a low-for-age GFR represented 1.3% of the population.97 These persons remain unrecognized in
most epidemiologic studies that use a fixed GFR threshold of 60 ml/min per 1.73 m2.97,123 Using SDS,
percentiles, or age-adapted staging in the definition of CKD would result in classifying these patients as having a disease. Further research, with a focus on long-term follow-up data, is warranted to elucidate whether such patients should be considered at risk for adverse renal or other disease-related outcomes.
Moving from a CKD definition with a fixed GFR threshold to a definition based on GFR adapted to age has several advantages. These include:
1. taking into account the physiologic age-related decline in GFR.
2. fitting with reference distributions of mGFR and eGFR in healthy individuals.
3. consistency with the observed associations between low GFR and prognosis.
4. reconciling the two ways to define a disease—namely, the distribution of laboratory findings and
the prognostic approach.
5. facilitating the identification, evaluation, and treatment of younger patients with a GFR that is too low for their age.
6. avoiding overdiagnosis of CKD in elderly patients.
Use of an age-adapted definition of CKD will also result in a much lower global CKD prevalence (perhaps by as much as 50%), particularly for elderly individuals. However, given that older adults without increased urine ACR or other signs of kidney damage usually have slightly decreased GFR that is physiologic and will on average remain stable (or could even improve) during followup, and have a mortality risk similar to those with higher GFR, there is no reason to consider such older individuals as living with a disease that requires investigations, referrals, and even therapeutic interventions with potential side effects.149 At an individual level, applying a CKD status to older
people (“D” meaning “disease”) can sometimes be a source of unjustified stress. In some countries, this diagnosis can also lead to adverse consequences in terms of insurance. Using the age-adapted CKD definition could eventually result in more appropriate attention and directing resources to those who are at higher risk of adverse outcomes associated with CKD.
Figure2. Theinterpretation Of GFR results depends on age. Examples of interpretation of GFR(here
GFR estimated using the FAS equation but the same can be applied to measured GFR or eGFR using other estimating equations) according to age and normal percentiles: abnormal (bottom) and normal (below) GFR result. The red circle corresponds to FAS=48 ml/min per 1.73 m2 (serum creatinine
[SCr]=1.3 mg/dl corresponds to SCr/Q=1.3/0.9=1.44>1.33) and the green circle corresponds to FAS=58 ml/min per 1.73 m2 (SCr=1.1 mg/dl corresponds to SCr/Q=1.22<1.33). These results are
abnormally low and normal predicted eGFR-FAS results with the age-adapted staging, respectively. Dark green shaded area corresponds to reference intervals for mGFR±SD and symmetrical limits for FAS based on SCr/Q=1 (middle line) and SCr/Q=1.33 (lower limit) (14). Light green area corresponds to the upper limit for FAS, based on SCr/Q=0.67. The interval (0.67 to 1.33) is considered the reference interval for SCr/Q. FAS, full age spectrum. Q, median SCrfrom healthy populations to account for age and sex.
Figure 3. Age-specific thresholds in relation to age-specific GFR percentiles. GFR cut-off values and
percentiles according to age (here percentiles of eGFR are calculated using the FAS equation). The bold line represents an age-adapted threshold for CKD: 75 ml/min per 1.73 m2 for age below 40
years, 60 ml/min per 1.73 m2 for age between 40 and 65 years, and 45 ml/min per 1.73 m2 for age
above 65 years. The dashed line represents the median (50th percentile) and the thin solid lines represent the 97.5th and 2.5th percentiles. The shaded zone is considered as below the normal reference intervals for GFR (<2.5th percentile).
DISCLOSURES
Dr. Jager declared speaker honoraria from Fresenius and received grant support from European Renal Association - European Dialysis and Transplant Association. Dr. Schaeffner declared speaker hon-oraria from Fresenius Medical Care, Fresenius Kabi, and Siemens Health Care. Dr. White received grant support from Academic Health Science Center Alternate Funding Plan Innovation Fund. Dr. Melsom declared speaker honoraria from Astellas, Norwegian evening summit, American Society of Nephrology, 2018, andgrants from Boehringer Ingelheim AS, outside the submitted work. Dr. van Londen declared speaker honoraria from Fresenius Medical Care. Dr. Rule declared royalties as “UpToDate” author on “The Aging Kidney.” Dr. van der Giet reports personal fees from Novartis, personal fees from Bayer, personal fees and “other” from IEM, personal fees and other from Charité Research Organization, grants from Deutsche For- Schungsgemeinschaft, grants from Else Kroner Freseniusstiftung, personal fees from Berlin Chemie, personal fees from Otsuka, personal fees from Servier, and personal fees from CVRX, outside the submitted work. Dr. Glassock reports other from Wolters-Kluwer, outside the submitted work. Dr. Rule reports grants from National Institutes of Health, National Institute of Diabetes and Digestive and Kidney Diseases, during the conduct of the study. All authors are members of the ERA- EDTA European Kidney Function Consortium.
REFERENCES
1. Kidney Disease: Improving Global Outcomes (KDIGO) Chronic Kidney DiseaseWorkGroup: KDIGO 2012 clinical practice guideline for the evaluation and management of chronic kidney disease. Kidney Int Suppl 3: 1-150,2013
2. Delanaye P, Schaeffner E, Ebert N, Cavalier E, Mariat C, Krzesinski JM, et al.: Normal ref-erence values for glomerular filtration rate: What do we really know? Nephrol Dial
Transplant 27: 2664-2672, 2012
3. Poggio ED, Rule AD: Can we do better than a single estimated GFR threshold when screening for chronic kidney disease? Kidney Int 72: 534-536, 2007
4. Poggio ED, Rule AD: A critical evaluation of chronic kidney disease--should isolated re-duced estimated glomerular filtration rate be considered a 'disease'? Nephrol Dial
Transplant 24: 698-700, 2009
5. Tonna SJ: Invited commentary: Defining incident chronic kidney disease in epidemiologic study settings. Am J Epidemiol 170: 425-427, 2009
6. Bash LD, Coresh J, Köttgen A, Parekh RS, Fulop T, Wang Y, et al.: Defining incident chronic kidney disease in the research setting: The ARIC Study. Am J Epidemiol 170: 414424, 2009
7. Hsu CY, Chertow GM: Chronicrenal confusion: Insufficiency, failure, dysfunction, or disease. Am J Kidney Dis 36: 415-418, 2000
8. Hall YN, Himmelfarb J: The CKD classification system in the precision medicine era. Clin J
Am Soc Nephrol 12: 346-348, 2017
9. Black C, van der Veer SN: Unlocking the value of variation in CKD prevalence. J Am Soc
Nephrol 27: 1874-1877, 2016
10. Bauer C, Melamed ML, Hostetter TH: Staging of chronic kidney disease: Time for a course correction. J Am Soc Nephrol 19: 844-846, 2008
11. Eknoyan G: Chronic kidney disease definition and classification: The quest for re-finements. Kidney Int 72: 1183-1185, 2007
12. Wesson LG: Renal hemodynamics in physiologic states. In: Physiology of the Human
Kidney, edited by Wesson LG, New York, Grune and Stratton, 1969, pp 96-108
13. Poggio ED, Rule AD, Tanchanco R, Arrigain S, Butler RS, Srinivas T, et al.: Demographic and clinical characteristics associated with glomerular filtration rates in living kidney do-nors. Kidney Int 75: 1079-1087, 2009
14. Pottel H, Hoste L, Yayo E, Delanaye P: Glomerular filtration rate in healthy living potential kidney donors: A meta-analysis. Nephron 135:105-119, 2017
15. Gaillard F, Courbebaisse M, Kamar N, Rostaing L, Del Bello A, Girerd S, et al.: The age-calibrated measured glomerular filtration rate improves living kidney donation selection process. Kidney Int 94: 616-624, 2018
16. Matsushita K, van der Velde M, Astor BC, Woodward M, Levey AS, de Jong PE, et al.: Chronic Kidney Disease Prognosis Consortium: Association of estimated glomerular filtration rate and albuminuria with all-cause and cardiovascular mortality in general pop-ulation cohorts: A collaborative meta-analysis. Lancet 375: 2073-2081,2010
17. Hallan SI, Matsushita K, Sang Y, Mahmoodi BK, Black C, Ishani A, et al.: Chronic Kidney Disease Prognosis Consortium: Age and association of kidney measures with mortality and end-stage renal disease. JAMA 308: 2349-2360, 2012
18. Matsushita K, Ballew SH, Coresh J, Arima H, Ärnlöv J, Cirillo M, et al.: Chronic Kidney Disease Prognosis Consortium: Measures of chronic kidney disease and risk of incident peripheral artery disease: A collaborative meta-analysis of individual participant data.
Lancet Diabetes Endocrinol 5: 718-728, 2017
19. Fox CS, Matsushita K, Woodward M, Bilo HJ, Chalmers J, Heerspink HJ, et al.: Chronic Kidney Disease Prognosis Consortium: Associations of kidney disease measures with mortality and end-stage renal disease in individuals with and without diabetes: A meta-analysis. Lancet 380: 1662-1673, 2012
20. Nitsch D, Grams M, Sang Y, Black C, Cirillo M, Djurdjev O, et al.: Chronic Kidney Disease Prognosis Consortium: Associations of estimated glomerular filtration rate and al-buminuria with mortality and renal failure by sex: A meta-analysis. BMJ 346: f324, 2013 21. Mahmoodi BK, Matsushita K, Woodward M, Blankestijn PJ, Cirillo M, Ohkubo T, et al.:
Chronic Kidney Disease Prognosis Consortium: Associations of kidney disease measures with mortality and end-stage renal disease in individuals with and without hypertension: A meta-analysis. Lancet 380: 1649-1661, 2012
22. Matsushita K, Coresh J, Sang Y, Chalmers J, Fox C, Guallar E, et al.: CKD Prognosis Consortium: Estimated glomerular filtration rate and albuminuria for prediction of car-diovascular outcomes: A collaborative metaanalysis of individual participant data. Lancet
Diabetes Endocrinol 3: 514-525, 2015
23. Thomas B, Matsushita K, Abate KH, Al-Aly Z, Ärnlöv J, Asayama K, et al.: Global Burden of Disease 2013 GFR Collaborators; CKD Prognosis Consortium; Global Burden of Disease Genitourinary Expert Group: Global cardiovascular and renal outcomes of reduced GFR. J
Am Soc Nephrol 28: 21672179, 2017
24. Wen CP, Matsushita K, Coresh J, Iseki K, Islam M, Katz R, et al.: Relative risks of chronic kidney disease for mortality and end-stage renal disease across races are similar. Kidney
Int 86: 819-827, 2014
25. van der Velde M, Matsushita K, Coresh J, Astor BC, Woodward M, Levey A, et al.: Chronic Kidney Disease Prognosis Consortium: Lower estimated glomerular filtration rate and higher albuminuria are associated with all-cause and cardiovascular mortality. A collaborative meta-analysis of high-risk population cohorts. Kidney Int 79: 13411352, 2011
26. Astor BC, Matsushita K, Gansevoort RT, van der Velde M, Woodward M, Levey AS, et al.: Chronic Kidney Disease Prognosis Consortium: Lower estimated glomerular filtration rate and higher albuminuria are associated with mortality and end-stage renal disease. A collaborative meta-analysis of kidney disease population cohorts. Kidney Int 79: 1331-1340, 2011
27. Gansevoort RT, Matsushita K, van der Velde M, Astor BC, Woodward M, Levey AS, et al.: Lower estimated GFR and higher albuminuria are associated with adverse kidney outcomes. A collaborative meta-analysis of general and high-risk population cohorts.
Kidney Int 80: 93-104, 2011
28. Hui X, Matsushita K, Sang Y, Ballew SH, Fulop T, Coresh J: CKD and cardiovascular disease in the atherosclerosis risk in communities (ARIC) study: Interactions with age, sex, and race. Am J Kidney, Dis 62:691-702, 2013
29. Go AS, Chertow GM, Fan D, McCulloch CE, Hsu CY: Chronic kidney disease and the risks of death, cardiovascular events, and hospitalization. N Engl J Med 351: 12961305, 2004 30. Tangri N, Stevens LA, Griffith J, Tighiouart H, Djurdjev O, Naimark D, et al.: A predictive
model for progression of chronic kidney disease to kidney failure. JAMA 305: 1553-1559, 2011
31. Delanaye P, Glassock RJ, Pottel H, Rule AD: An age-calibrated definition of chronic kidney disease: Rationale and benefits. Clin Biochem Rev 37: 17-26, 2016
32. Glassock R, Denic A, Rule AD: When kidneys get old: An essay on nephro-geriatrics. J
Bras Nefrol 39: 59-64, 2017
33. Glassock RJ: Con: Thresholds to define chronic kidney disease should not be age dependent. Nephrol Dial Transplant 29: 774-779, discussion 779-782, 2014
34. Denic A, Glassock RJ, Rule AD: Structural and functional changes with the aging kidney.
Adv Chronic Kidney Dis 23: 1928, 2016
35. Manjunath G, Tighiouart H, Coresh J, Macleod B, Salem DN, Griffith JL, et al.: Level of kidney function as a risk factor for cardiovascular outcomes in the elderly. Kidney Int 63: 1121-1129, 2003
36. O'Hare AM, Bertenthal D, Covinsky KE, Landefeld CS, Sen S, Mehta K, et al.: Mortality risk stratification in chronic kidney disease: One size for all ages? J Am Soc Nephrol 17: 846-853, 2006
37. Maaravi Y, Bursztyn M, Hammerman- Rozenberg R, Stessman J: Glomerular filtration rate estimation and mortality in an elderly population. QJM 100: 441-449, 2007
38. Hallan S, Astor B, Romundstad S, Aasarod K, Kvenild K, Coresh J: Association of kidney function and albuminuria with cardiovascular mortality in older vs younger individuals: The HUNT II Study. Arch Intern Med 167: 2490-2496, 2007
39. Brantsma AH, Bakker SJL, Hillege HL, de Zeeuw D, de Jong PE, Gansevoort RT; PREVEND Study Group: Cardiovascular and renal outcome in subjectswith K/DOQI stage 1-3 chronic kidney disease: The importance of urinary albumin excretion. Nephrol Dial Transplant 23: 3851-3858, 2008
40. Hwang SJ, Lin MY, Chen HC, Hwang SC, Yang WC, Hsu CC, et al.: Increased risk of mortality in the elderly population with latestage chronic kidney disease: A cohort study in Taiwan. Nephrol Dial Transplant 23: 31923198, 2008
41. Roderick PJ, Atkins RJ, Smeeth L, Mylne A, Nitsch DD, Hubbard RB, et al.: CKD and mortality risk in older people: A communitybased population study in the United King-dom. Am J Kidney Dis 53: 950-960, 2009
42. van der Velde M, Bakker SJL, de Jong PE, Gansevoort RT: Influence of age and measure of eGFR on the association between renal function and cardiovascular events. Clin J Am Soc
Nephrol 5: 2053-2059, 2010
43. Muntner P, Bowling CB, Gao L, Rizk D, Judd S, Tanner RM, et al.: Age-specific association of reduced estimated glomerular filtration rate and albuminuria with all-cause mortality.
Clin JAm Soc Nephrol 6: 2200-2207, 2011
44. Stengel B, Metzger M, Froissart M, Rainfray M, Berr C, Tzourio C, et al.: Epidemiology and prognostic significance of chronic kidney disease in the elderly--the Three-City pro-spective cohort study. Nephrol Dial Transplant 26: 3286-3295, 2011
45. Van Pottelbergh G, Vaes B, Adriaensen W, Mathef C, Legrand D, Wallemacq P, et al.: The glomerular filtration rate estimated by new and old equations as a predictor of important outcomes in elderly patients. BMC Med 12: 27, 2014
46. Oh SW, Kim S, Na KY, Kim KW, Chae DW, Chin HJ: Glomerular filtration rate and pro-teinuria: Association with mortality and renal progression in a prospective cohort of a community-based elderly population. PLoS One 9:e94120, 2014
47. Minutolo R, Lapi F, Chiodini P, Simonetti M, Bianchini E, Pecchioli S, et al.: Risk of ESRD and death in patients with CKD not referred to a nephrologist: A 7-year prospective study.
Clin J Am Soc Nephrol 9: 1586-1593, 2014
48. Malmgren L, McGuigan FE, Berglundh S, Westman K, Christensson A, Akesson K: Declining estimated glomerular filtration rate and its association with mortality and co-morbidity over 10 years in elderly women. Nephron 130: 245-255, 2015
49. Chowdhury EK, Langham RG, Owen A, Krum H, Wing LM, Nelson MR, et al.: Second Australian National Blood Pressure Study Management Committeem: Comparison of predictive performance of renal function estimation equations for all-cause and cardio-vascular mortality in an elderly hypertensive population. Am J Hypertens 28: 380-386, 2015
50. Nagai K, Sairenchi T, Irie F, Watanabe H, Ota H, Yamagata K: Relationship between estimated glomerular filtration rate and car- diovascular mortality in a Japanese cohort with long-term follow-up. PLoS One 11: e0156792, 2016
51. Corsonello A, Pedone C, Bandinelli S, Ferrucci L, Antonelli Incalzi R: Predicting survival of older community-dwelling individuals according to five estimated glomerular filtration rate equations: The InChianti study. Geriatr Gerontol Int 18: 607-614, 2018
52. Wu J, Jia J, Li Z, Pan H, Wang A, Guo X, et al.: Association of estimated glomerular fil -tration rate and proteinuria with all-cause mortality in community-based population in China: A result from Kailuan study. Sci Rep 8: 2157, 2018
53. O'Hare AM, Hailpern SM, Pavkov ME, Rios-Burrows N, Gupta I, Maynard C, et al.: Prognostic implications of the urinary albumin to creatinine ratio in veterans of different ages with diabetes. Arch Intern Med 170: 930-936, 2010
54. Gansevoort RT, Correa-Rotter R, Hemmelgarn BR, Jafar TH, Heerspink HJ, Mann JF, et al.: Chronic kidney disease and cardiovascular risk: Epidemiology, mechanisms, and pre-vention. Lancet 382: 339-352, 2013
55. Shardlow A, McIntyre NJ, Fluck RJ, McIntyre CW, Taal MW: Chronic kidney disease in primary care: Outcomes after five years in a prospective cohort study. PLoS Med 13: e1002128, 2016
56. Raymond NT, Zehnder D, Smith SC, Stinson JA, Lehnert H, Higgins RM: Elevated relative mortality risk with mild-to-moderate chronic kidney disease decreases with age. Nephrol
Dial Transplant 22: 3214-3220, 2007
57. Wyatt CM: A rose by any other name: Is stage 3a chronic kidney disease really a disease?
Kidney Int 91: 6-8, 2017
58. Moranne O, Froissart M, Rossert J, Gauci C, Boffa JJ, Haymann JP, et al.: NephroTest Study Group: Timing of onset of CKD-re- lated metabolic complications. J Am Soc Nephrol 20: 164-171, 2009
59. Drawz PE, Babineau DC, Rahman M: Metabolic complications in elderly adults with chronic kidney disease. J Am Geriatr Soc 60: 310-315, 2012
60. Bowling CB, Muntner P, Sawyer P, Sanders PW, Kutner N, Kennedy R, et al.: Community mobility among older adults with reduced kidney function: A study of life-space. Am J
Kidney Dis 63: 429-436, 2014
61. Fried LF, Lee JS, Shlipak M, Chertow GM, Green C, Ding J, et al.: Chronic kidney disease and functional limitation in older people: Health, aging and body composition study. J Am
Geriatr Soc 54: 750-756, 2006
62. Rule AD, Amer H, Cornell LD, Taler SJ, Cosio FG, Kremers WK, et al.: The association between age and nephrosclerosis on renal biopsy among h ealthy adults. Ann Intern Med 152: 561-567, 2010
63. Denic A, Lieske JC, Chakkera HA, Poggio ED, Alexander MP, Singh P, et al.: The substantial loss of nephrons in healthy human kidneys with aging. J Am Soc Nephrol 28: 313-320, 2017
64. Denic A, Mathew J, Lerman LO, Lieske JC, Larson JJ, Alexander MP, et al.: Singlenephron glomerular filtration rate in healthy adults. N Engl J Med 376: 2349-2357, 2017
65. Tan JC, Busque S, Workeneh B, Ho B, Derby G, Blouch KL, et al.: Effects of aging on glomerular function and number in living kidney donors. Kidney Int 78: 686-692, 2010 66. Hommos MS, Zeng C, Liu Z, Troost JP, Rosenberg AZ, Palmer M, et al.: Global
glomerulosclerosis with nephrotic syndrome; the clinical importance of age adjustment.
67. Srivastava A, Palsson R, Kaze AD, Chen ME, Palacios P, Sabbisetti V, et al.: The prognostic value of histopathologic lesions in native kidney biopsy specimens: Results from the boston kidney biopsy cohort study. JAm Soc Nephrol 29: 2213-2224, 2018
68. Yayo E, Aye M, Yao C, Gnionsahe A, Attoungbre M-L, Cavalier E, et al.: Measured (and estimated) glomerular filtration rate: Reference values in West Africa. Nephrol Dial
Transplant 33: 1176-1180, 2018
69. Hogeman O: Normal individuals. Acta Med Scand Suppl 131: 99-108, 1948
70. Bucht H: Studies on renal function in man; with special reference to glomerular filtration and renal plasma flow in pregnancy. Scand J Clin Lab Invest 3[Suppl 3]: 1-64,1951
71. Slack TK, Wilson DM: Normal renal function: CIN and CPAH in healthy donors before and after nephrectomy. Mayo Clin Proc 51: 296300, 1976
72. Landahl S, Aurell M, Jagenburg R: Glomerular filtration rate at the age of 70 and 75. J Clin
Exp Gerontol 3: 29-45, 1981
73. Granerus G, Aurell M: Reference values for 51Cr-EDTA clearance as a measure of glomerular filtration rate. Scand J Clin Lab Invest 41: 611-616, 1981
74. Hamilton D, Riley P, Miola U, Mousa D, Popovich W, al Khader A: Total plasma clearance of 51Cr-EDTA: Variation with age and sex in normal adults. Nucl Med Commun 21: 187-192, 2000
75. Rule AD, Gussak HM, Pond GR, Bergstralh EJ, Stegall MD, Cosio FG, et al.: Measured and estimated GFR in healthy potential kidney donors. Am J Kidney Dis 43: 112119, 2004 76. Grewal GS, Blake GM: Reference data for 51Cr-EDTA measurements of the glomerular
filtration rate derived from live kidney donors. Nucl Med Commun 26: 61-65, 2005
77. Barai S, Bandopadhayaya GP, Patel CD, Rathi M, Kumar R, Bhowmik D, et al.: Do healthy potential kidney donors in India have an average glomerular filtration rate of 81.4 ml/min? Nephron, Physiol 101: 21-26, 2005
78. Berg UB: Differences in decline in GFR with age between males and females. Reference data on clearances of inulin and PAH in potential kidney donors. Nephrol Dial Transplant 21: 2577-2582, 2006
79. Jafar TH, Islam M, Jessani S, Bux R, Inker LA, Mariat C, et al.: Level and determinants of kidney function in a South Asian population in Pakistan. Am J Kidney Dis 58: 764-772, 2011
80. Ma YC, Zuo L, Chen L, Su ZM, Meng S, Li JJ, et al.: Distribution of measured GFR in ap -parently healthy Chinese adults. Am J Kid- ney Dis 56: 420-421,2010
81. Soares AA, Prates AB, Weinert LS, Veronese FV, de Azevedo MJ, Silveiro SP: Reference values for glomerular filtration rate in healthy Brazilian adults. BMC Nephrol 14: 54, 2013 82. Peters AM, Perry L, Hooker CA, Howard B, Neilly MD, Seshadri N, et al.: Extracellular fluid
volume and glomerular filtration rate in 1878 healthy potential renal transplant donors: Effects of age, gender, obesity and scaling. Nephrol Dial Transplant 27: 14291437, 2012
83. Holness JL, Fleming JS, Malaroda AL, Warwick JM:(99m)Tc-DTPA volume of distribution, half-life and glomerular filtration rate in normal adults. Nucl Med Commun 34: 1005-1014, 2013
84. De Santo NG, Capasso G, Anastasio P, Coppola S, Policastro M, Bellini L, et al.: Renal functional reserve. Child Nephrol Urol 11: 140-145, 1991
85. Davies DF, Shock NW: Age changes in glomerular filtration rate, effective renal plasma flow, and tubular excretory capacity in adult males. J Clin Invest 29: 496-507, 1950
86. Shock NW: Kidney function tests in aged males. Geriatrics 1: 232-239, 1946
87. Horio M, Yasuda Y, Kaimori J, Ichimaru N, Isaka Y, Takahara S, et al.: Performance of the Japanese GFR equation in potential kidney donors. Clin Exp Nephrol 16: 415-420, 2012 88. Hoang K, Tan JC, Derby G, Blouch KL, Masek M, Ma I, et al.: Determinants of glomerular
hypofiltration in aging humans. Kidney Int 64: 1417-1424, 2003
89. Teo BW, Xu H, Koh YY, Li J, Subramanian S, Sinha AK, et al.: Glomerular filtration rates in healthy Asians without kidney disease. Nephrology (Carlton) 19: 72-79, 2014
90. den Bakker E, Gemke RJBJ, Bökenkamp A: Endogenous markers for kidney function in children: A review. Crit Rev Clin Lab Sci 55: 163-183,2018
91. Pottel H, Delanaye P, Weekers L, Selistre L, Goffin K, Gheysens O, et al.:Age-dependent reference intervals for estimated and measured glomerular filtration rate. Clin Kidney J 10: 545-551, 2017
92. Back SE, Ljungberg B, Nilsson-Ehle I, Borga̐ O, Nilsson-Ehle P: Age dependence of renal function: Clearance of iohexol and p-amino hippurate in healthy males. Scand J Clin Lab
Invest 49: 641-646, 1989
93. Pottel H, Hoste L, Dubourg L, Ebert N, Schaeffner E, Eriksen BO, et al.: An estimated glomerular filtration rate equation for the full age spectrum. Nephrol Dial Transplant 31: 798-806, 2016
94. Levey AS, Stevens LA, Schmid CH, Zhang YL, Castro AF 3rd, Feldman HI, et al.: CKD- EPI (Chronic Kidney Disease Epidemiology Collaboration): A new equation to estimate glomerular filtration rate. Ann Intern Med 150: 604-612, 2009
95. Schaeffner ES, Ebert N, Delanaye P, Frei U, Gaedeke J, Jakob O, et al.: Two novel equations to estimate kidney function in persons aged 70 years or older. Ann Intern Med 157:471-481,2012
96. Baba M, Shimbo T, Horio M, Ando M, Yasuda Y, Komatsu Y, et al.: Longitudinal study of the decline in renal function in healthy subjects. PLoS One 10: e0129036, 2015
97. Benghanem Gharbi M, Elseviers M, Zamd M, Belghiti Alaoui A, Benahadi N, Trabelssi H, et al.: Chronic kidney disease, hypertension, diabetes, and obesity in the adult population of Morocco: How to avoid “over”- and "under"-diagnosis of CKD. Kidney Int 89: 1363-1371, 2016
98. van den Brand JA, van Boekel GA, Willems HL, Kiemeney LA,den Heijer M, Wetzels JF: Introduction of the CKD-EPI equation to estimate glomerular filtration rate in a Caucasian population. Nephrol Dial Transplant 26: 3176-3181, 2011