Surveying activity-travel behavior in Flanders:
Assessing the impact of the survey design
Mario Cools
Transportation Research Institute (IMOB) - Hasselt University mario.cools@uhasselt.be
Elke Moons
Transportation Research Institute (IMOB) - Hasselt University elke.moons@uhasselt.be
Tom Bellemans
Transportation Research Institute (IMOB) - Hasselt University tom.bellemans@uhasselt.be
Davy Janssens
Transportation Research Institute (IMOB) - Hasselt University davy.janssens@uhasselt.be
Geert Wets
Transportation Research Institute (IMOB) - Hasselt University geert.wets@uhasselt.be
Abstract
Ever since car ownership and car use started to increase in Western Europe and the USA, transportation planners attempted to model people’s travel behavior. In the context of the Feathers project a dynamic activity-based travel demand framework is developed for Flanders. In this paper, the complete survey design of the data collection effort required for such dynamic activity-based model is discussed. A mixed survey design of using a PDA application on the one hand, and using traditional paper and pencil diaries on the other hand, turns out to be a very suitable way of collecting detailed information about planned and executed activity-travel behavior of households. The results show that no attrition effects are present, not on the number of out-of-home activities reported, nor on the number of trips reported. Moreover the survey mode (PDA versus paper and pencil) has no direct impact on the quantities investigated. Notwithstanding, it is essential for further analysis on the Feathers data to explicitly take into account mode effects because of two reasons. First, the effect of explanatory variables can be influenced by the survey mode. Second, the variance in the estimation of the quantity investigated can differ significantly. Heteroscedatisc linear regression models provide the required framework to explicitly take into account these mode effects.
KEYWORDS: activity-travel behavior, mixed-mode survey design, heteroscedastic linear regression
1 Background
Ever since car ownership and car use started to increase in Western Europe and the USA, transportation planners attempted to model people’s travel behavior. A series of models was developed, each successor ameliorating the previous one, however, the underlying reasons why people undertake trips were completely neglected. This is where the activity-based approach came into play, which has set the standard for travel demand modeling during the last decade (Moons and Wets, 2007). The basic premise of this approach is that travel demand is derived from the activities that individuals and households need or wish to perform (Jones et al., 1983). In the context of the Feathers project (Janssens et al., 2007) a dynamic activity-based travel demand framework is developed for Flanders (the Dutch speaking region of Belgium), founded on the latter behavioral realism. The theoretical underpinnings of this framework focus on the formulation of a comprehensive theory and model of activity rescheduling and reprogramming decisions as a function of time pressure (Joh et al., 2003; Timmermans et al., 2001-15).
Several types of dynamics are involved. First, the model system will address the problem of activity rescheduling behavior, assuming that daily and multi-day activity (re)scheduling processes depend on history, available time and time pressure. Secondly, it will address the problem of long-term dynamics (e.g. behavioral changes due to lifecycle events such as getting married, first child, etc). Thirdly, the framework incorporates the notion that travelers learn about their environment and cope with an environment which is non-stationary (Janssens et al., 2008; Ramaekers et al. 2008).
It is clear that the data requirements of such a dynamic model constitute a real challenge. In addition to activity-travel diaries, the model needs data on activity rescheduling decisions of individuals, data on household multiday activity scheduling, data on life trajectory events and data on short-term dynamics. The data collection therefore involves an extensive hybrid, mixed-mode approach. In the remainder of the text, first, an elaboration on the data requirements for a full activity-based model is provided. Thereupon, the survey design is thoroughly discussed. Then, mixed-mode design effects are analyzed using proper statistical techniques, and finally, some conclusions and recommendations are formulated.
2 Data requirements
The purpose of the Feathers framework in particular, and activity-based models in general, is to predict which activities will be conducted where, when, for how long, with whom, and with which (chain of) transport mode(s). Thus, in order to build a model that incorporates all of these facets, one requires data on all these facets. Moreover, as the interdependencies between these facets play a key role, it is also necessary to collect detailed data about these facets for all activity episodes. Consequently, for each new activity, the data should reveal where it is conducted, when, for how long, etc. Although this seems evident, the collection of such data requires various operational decisions.
The first decision concerns the collection of data about in-home activities and out-of-home activities. On the one hand one could argue that out-of-home activities would be sufficient as only these activities generate traffic. On the other hand, if one is interested in the relationship between in-home activities and out-of-home activities, data about both kinds of activities should be collected. However, collecting detailed in-home activity information also
significantly increases the burden for respondents, who may also be reluctant to fill out detailed in-home activities in a context of transportation research. In the pilot test, both options were pursued and evaluated in terms of user burden and response rates. Based on this pilot test, it was chosen to collect only detailed information about out-of-home activities. A second operational decision which was made is the classification of activities. Should one collect data using a broader classification, or should one use a more detailed classification? The choice was made to incorporate the following activity classes: in-home activities, sleeping, services, working, eating, daily shopping, non-daily shopping, education, social activities, leisure, bring or get persons or goods, waiting, touring and other activities. This classification is based on the pretest and on the recommendations relying upon experiences with the Albatross and Aurora model frameworks (Arentze et al., 2000; Joh et al., 2004).
A third facet concerns the timing dimension. Activity-based models incorporate the timing of travel decisions. Consequently, data on start and end times, and hence duration of activities and related travel should be collected. An important consideration in this regard is that a longer time interval (for instance “before noon”) will likely result in an under-reporting of short trips, and activities of short duration. We therefore decided to avoid this problem by asking respondents to report the exact start and end times of their activities.
The “with whom” dimension is the fourth operational choice that had to be made. Most existing activity-based models do not incorporate this choice dimension. It has been decided to use a rather broad categorization of the travel party: children and partner information being household members on the one hand, and other members on the other hand. In addition, it was also explicitly asked to report the number of people that are participating in the travel, because this has implications for vehicle occupancy rates and traffic volume.
The final facet, that of the transport mode, requires data with respect to the transport mode that is used to conduct the various activities. Activity-based models do not involve any other requirements than conventional models in terms of transport mode. The usual categorization into car (driver versus passenger), various means of public transport, bicycle, and walking would typically suffice. In the context of modeling multi-modal transportation modes, data was collected about travel chains (journeys). To this end, users had the possibility to enter four different travel episodes, and their corresponding transport mode, in one journey in the data collection.
3 Mixed-mode survey design
Having defined the information needs in the previous section, this section elaborates on the actual survey design. To collect the required data, a full activity diary format was adopted. Clarke et al. (1981) conducted one of the most elaborate studies that compares different diary types and concluded that the full activity diary substantially increases reported trip rates when compared to trip diaries. These results are confirmed by the increases reported by Stopher (1992). Several methodological issues are further discussed in the following subsections.
3.1
Recall Period
The concept of recall period concerns the question whether diary data should be collected for the past or for the future. In principle, respondents may be asked to recall yesterday’s trips or activities or activities longer ago, or be asked to fill out the diary for a particular day in the
future. Often, the latter option is referred to as ‘leave-behind’ as it typically involves an interviewer leaving behind the diary for the respondent to fill out after explaining the diary. In contrast, the recall format involves asking respondents, with or without previous notifications, to report their activities performed during a given, previous day. In the Feathers project, data is collected for the past, as well as planned activity and travel information for the future, since data about both are important for model calibration of a dynamic activity-based model. Therefore, respondents were asked to fill in a planned and executed diary, and to report rescheduling decisions as well as the reasons for rescheduling.
3.2
Frequency
The concept of frequency is used in the time use research literature to describe how long the diary should be kept. This issue has been subject of considerable debate. One group of scholars argues that the respondent demands are so high that reliable results can only be obtained for one or two-day diaries. Others have argued that, while this may be true, one or two-day diaries are not very valuable in that they do not capture multi-day cycles in activity patterns. This argument is supported by referring to the typical cyclical effects found in a large number of empirical studies (e.g. Mahmassani et al. (1991) and Pas and Koppelman (1987)). The survey reported in this paper has been carried out during a one-week period. A first reason for this choice, is the interest in capturing dynamic travel information, which is reflected in collecting data about both the planning and execution of activities. Moreover, one should reckon that some activities have a rather fixed time point and hence can be planned a long time ahead. Second, some activities take place only once a week (i.e. non-daily shopping, sport activities) and the goal was to capture them as well. Finally, the choice for increasing the number of days per respondent reduces important dimensions of measurement error and marginal costs (Gershuny, 1992), and increases the usefulness of the data analysis and model development.
3.3
Form of Instrument
An important decision concerns the question which instrument to use to collect diary data. Most diaries have used the paper-and-pencil format, while alternatively, computer-assisted instruments may be used. Some researchers have argued that data collection is facilitated by means of computer-assisted data collection, while others state that it is experienced as an additional burden. It remains undoubted however that electronic data collection yields information of higher quality (Kalfs and Saris, 1997; Verweij et al., 1987). Obviously, computer-assisted data collection tools have the advantage of data quality control. Indeed, a computer system can easily check for anomalies and prompt the respondent for additional information. Errors that report activities where the beginning hour of an activity is later than the ending hour, activity locations that do not seem to exist and many others can be easily checked by a computer-assisted instrument. Moreover, advanced data consistency and data quality rules can be implemented. The possibility to enable computer assisted data collection tools with GPS, facilitates the collection of travel and route-information and widens the application area of the data in addition to the traditional travel behavior model development (Wolf, 2004). Automated data collection techniques are particularly well suited to obtain data which require a significant effort from the respondent like for instance the rescheduling of activities for the development of dynamic models.
There is also a cost-related argument which is in favor of computer-aided data collection. Indeed, both the data entry cost and the cost of pre- and post-processing the data, bear a
significant share of the total data collection cost and can be reduced with the help of computer-assisted instruments. On the contrary, it could be argued that sample bias is introduced when only computer-assisted forms of data collection are used. Previous studies have indeed demonstrated that some socio-economic classes of society, like older-age and lower-education groups, may be more reluctant towards using computer-assisted instruments for the data collection.
Within the context of the Feathers project, it was of utmost importance that the collected sample data is representative in terms of travel behavior. To this end, we decided to adopt a hybrid approach for our data collection; using computer-assisted instruments and handheld PDA (personal digital assistant), enhanced by additional paper–and-pencil data.
3.3.1 Computer-Assisted Data Collection: PARROTS
The computer-assisted activity-travel diary survey tool has been labeled PARROTS, which stands for PDA system for Activity Registration and Recording Of Travel Scheduling. An extensive functional description of this tool is provided in Kochan et al (2006). PARROTS runs on a PDA with integrated GPS (Global Positioning System) to automatically capture location information. The PDA was programmed such that besides the automatic registration of location data, respondents could provide information about their (re)planning and execution of activities and trips as well. The most important activity and trip attributes PARROTS collected are: activity type, date, start and end time, location, mode of transportation, travel time and travel party. Note that although PARROTS collected location data using GPS, the location of activities was still queried. Besides, PARROTS features several data consistency checks. If any on the checks failed, the user was taken to the relevant interface and an informative error was shown.
3.3.2 Paper-and-Pencil Survey
The paper-and-pencil survey is a traditional activity-based travel survey, except for the fact the additional information was collected with respect to travel dynamics and rescheduling information. In the diary, the respondent filled out his personal activity-travel diary which includes all performed activities and journeys during one week. Similar to PARROTS, both the planned and executed activities and trips were registered in a separate booklet.
Obviously, one could not register detailed information about replanning behavior of a respondent for every choice facet (transport mode, duration, travel party, location) as this would have involved many manual checks on both booklets leading to unacceptable respondent burden. Hence, no detailed replanning information was gathered in the paper-and-pencil survey and only the reason for differences in duration of planned and executed activities was queried.
3.4
Study Population
Since the objective of the survey was to give a representative description of the travel behavior of the population in Flanders, the target population in our project was defined as “all the people residing in Flanders, regardless of their place of birth, nationality of any other characteristic”. Note, however, that the population that was reached by the study, i.e. the study population, does not cover the target population completely. The following categories of persons are included in the target population, as defined above, but are not included in the
study population: homeless, illegal refugees, people residing in an institution (elderly people living in old people’s homes, student homes, orphanages, nursing homes and psychiatric nursing homes), people residing in a religious community or cloister with more than 8 persons, and people residing in a prison. Thus, only private households were considered, no collective households.
3.5
Sample Design
Sample surveys can be distinguished from other statistical collections by their particular approach with respect to two questions. The first question concerns the units from which the population data are to be collected (the sample selection), while the second relates to how relevant conclusions can be inferred. Sampling theory is concerned with the answers to these two questions.
The results of sample surveys are always subject to some uncertainty because only part of the population has been included and because of errors of measurement. Simply increasing the sample size induces costs both in terms of time and money. Hence, the specification of the degree of precision wanted in the results is an important consideration (Cochran, 1977).
3.5.1 Sample Unit, Sample Size and Selection Unit
The sample unit is strongly linked to the type of questioning and the type of design. In literature on transportation survey research, the household is often regarded as the sample unit, because of the obvious relationships between the mobility behavior of persons belonging to the same household.
The total number of successful interviews for the sample is set to 2 500 households for Flanders. This sample size is based on the following sample size calculations. The minimal sample size depends on different factors such as the accuracy with which one wants to draw conclusions. If one is satisfied with rather general statements on the population, i.e. if one wants to know a certain population parameter only approximately, then a rather small sample size suffices. Based on calculations as proposed by Billiet and Waege (2001), the sample size can be determined. From classical statistics, we know that the confidence interval for a population proportion is determined by:
n p p z p n p p z p (1 ) (1 ) ,
with p de survey proportion, n the sample size and z de z-value of the desired confidence interval. Based on this calculation, one can determine a maximal deviation (md), with which the survey proportion p can deviate from the population proportion :
n p p z md (1 ) Isolating n yields: 2 2 (1 ) md p p z n .
Based on this formula, it can observed that the sample size n depends on the survey proportion p, the accuracy with which one wishes to draw conclusions via the value of z and of the accuracy itself via md. If the most ‘safe’ case is considered, i.e. p=0.5, then the next table gives possible sample sizes for some classical values of confidence and maximal deviation:
Table 1: Minimal qample qize in function of confidence level and accuracy
p=0.5 Accuracy (md)
Confidence level z-value 0.1 0.05 0.02 0.01
0.90 1.65 68 271 1 691 6 764
0.95 1.96 96 384 2 401 9 604
0.98 2.33 135 541 3 382 13 530
0.99 2.58 166 663 4 147 16 587
For a maximal deviation of 2% and a confidence level of 95%, the questioning of 2401 sample units seems a minimum. The minimum sample size was set to 2500. This conservative choice was made to get the desired sample size, as response rates are rather low in this type of surveys. The survey was set up in such a way, that if a household refused to cooperate, there are 4 replicate households that could make up for this household. These replicate households are matched to the first reference household based on the following factors: municipality where the household lives, gender of reference person, age category of reference person (< 25 yrs, 25- 34 yrs, 35 – 44 yrs, 45 – 64 yrs and 65 yrs) and household composition (No of adults and No of children).
Moreover, several problems that could occur were taken into account. Some people could not be reached in the three calling moments. Other people might not be willing to cooperate, and others might not end the inquiry successfully given that they were willing to cooperate, since filling out the questionnaire could be considered too cumbersome. All this taken into consideration has led to an estimated total response rate (over the 5 matched households) of 60%, so in total 4200 household groups were included in the sample. Because it was also necessary to account for the replicate households, the total number of requested households in the sample equals 21000 households.
3.5.2 Stratified Clustered Design
In the design of the sampling scheme, both the coverage of the people in Flanders and the logistic feasibility of the fieldwork are important concerns. Even when an exhaustive list is available (such as the National Register), a direct selection of persons from this list would be too expensive, because the spread would be too wide. Cost savings may allow the investigators to use a larger sample size than they could use for a simple random sample of the same cost. Therefore, a stratified clustered design is a preferable solution. In this stratified design, the population will first be divided into non-overlapping groups (strata) after which for each group a simple random sample will be drawn. The clustered part of the design means that households will serve as cluster units. The advantage of using a clustered design, is that one does not have to have a full list of individuals at one’s disposal.
Choosing a stratified sample instead of a simple random sample can be motivated as follows. Sample surveys displaying small variability among the measurements will produce small bounds on the errors of estimation. In other words, stratification may produce a smaller bound on the error of estimation than would be produced by a simple random sample of the same size. This result is enforced if strata are largely homogeneous. In this survey; there are two stratification levels (at the provincial level and the level of a municipality). Within each province, a proportional representation in the base sample of 4 200 is sought. A simple random sample of municipalities within a region would ascertain this condition from the sampling framework point of view.
Municipalities are established administrative units, they are stable (in general those units do not change during the time the survey is conducted), and they are easy to use in comparison with other specialized sources of data related to the survey. Municipalities are preferred to provinces, because the latter are too large and too few. The great variation in the size of the municipalities is accounted for by systematically sampling within a province with a selection chance proportional to their size.
Within each municipality, a random sample of representative households is drawn and the replicate households are matched according to the criteria mentioned above. Clustering also takes place at the household level since members of the same household are more alike than persons not belonging to the same household.
Whereas the stratification effects and the systematic sampling according to municipalities have the effect of increasing the precision, the clustering effect (selecting households instead of individuals) might slightly reduce precision, since units will resemble each other more than in a simple random sample. However, since stratification is based on unequal probabilities (to guarantee meaningful sample size per stratum) a slight decrease in overall efficiency is to be expected. The effects due to clustering and stratification observed will however not outweigh the advantages. In summary, in the light of the previous remarks, multistage sampling is the appropriated way to get access to individuals.
3.5.3 Replacement of Households (Field Substitution)
In order to “solve” the problem of refusing or non-contactable households, the decision was made to replace these households by replicate households, a process which in survey literature is called field substitution (Vehovar, 1999). These replicate households were not randomly chosen, they have 4 characteristics in common with the refusing household: they live in the same municipality as the refusing household, the age of the reference person falls within the same age category as that of the initially chosen household (reference household), the gender of the reference person is the same and the household composition is the same as that of the reference household. The latter is to ensure that people show the same mobility characteristics, since a household without children will probably show different mobility behavior when compared to a household with 3 children.
When a chosen reference household refuses to take part in the survey, or when it is unable to be contacted in any way (either by phone or via regular mail), then the household will be replaced by the next one in the list. If the same applies to this household (i.e. when it also refuses to take part in the survey, or when it could not be contacted) it will be replaced by the next in the list. This procedure will go on until the list of 5 households has run out. If none of the households is prepared to cooperate, no other replacements will be sought. As soon as a household is willing to participate in the survey, there is no need to replace the household anymore. The possible remaining households from the list of 5 will receive the status ‘not activated’ and they are not incorporated in the remainder of the project.
3.6
Survey Process
The actions that were taken in the survey process have been derived from the “New Kontiv Design (NKD)”, which is one of the best known approaches for developing a good and reliable survey. The NKD provides a detailed phased survey procedure. The following actions must be performed sequentially according to the NKD (Brög, 2006): an advance
notice (mail), mailing of questionnaires (mail), motivation (telephone), reminder (mail), motivation (telephone), reminder (mail), motivation (telephone), respondent helpdesk (telephone), new mailings of questionnaires on request (mail).
The following procedure was adopted in the data collection process of the Feathers project. First, the households that were selected for the paper questionnaires were sent an introduction letter in which the purpose of the research was explained in general, as well as what was exactly expected from the respondents. Note that advance letters accomplish several useful purposes: they help establish the legitimacy of the survey, inform potential respondents about the study’s purposes, allay concerns about confidentiality, and serve as an introduction to the interviewer. In addition to this, studies suggest an advance letter can be quite useful in obtaining cooperation, increasing response rates by an average of about 17 percent (Dillman, 1991; Zimowski et al., 1997). Three working days after sending the introduction letter, a maximum of three attempts, spread over at least two days, was undertaken in order to reach a household: once during the morning, once in the afternoon, and once in the evening. When the household was reached, they were asked whether they wanted to participate or not. If they were indeed willing to cooperate, the questionnaires were sent, a starting date was agreed with the household and an appointment was made to call the household on the second day of the survey. On that day, the household as contacted again to remind them of filling out the diaries, and to check whether the participants experience any problems filling out the questionnaires. Because of this procedure, any difficulties that the respondents encountered, could be solved quickly and the households would remain motivated to participate. Households who refused to further participate after the telephone call (second day of the research), were asked to fill out and send back at least the household questionnaire and the questionnaires with personal socio-economic information. After seven days, the participating households were expected to send back the questionnaires. If the questionnaires had not been received one week after the last day of the research, the household was called back to remind them of sending back the questionnaires.
The households that received a PDA went through a similar procedure. They first received an introduction letter in which the purpose of the research was explained. This letter also included more information with respect to the PDA-technology and their assignment during this research. Again, three days after sending the introduction letter, the telephone operator tried to reach the household during three calling attempts. When the household was contacted, they were asked whether they wanted to take part in the research. If so, an appointment for the delivery of the PDA, the household questionnaire and the socio-economic questionnaire was fixed at the respondents’ home location. During this moment the household received the PDA and the questionnaires. Further explanation was also provided to the participants during the contact moment. Similar to the procedure concerning the paper-and-pencil diary information, each household was also called on the second day of the survey to ensure that everything went smoothly, and to motivate the respondents. At this point, a new appointment was fixed to collect the PDA, preferably the day after the last day of the survey. At this appointment, participants were also questioned about their social network. After the appointment, the data on the PDA was processed and the PDA was initialized for use by another household. When households refused to participate because of unfamiliarity with the PDA-technology, they were allowed to switch from the PDA collection to the paper and pencil mode. This could occur on two moments: at the moment of the recruitment telephone, and at the moment of the motivation call. Nonetheless switches were only allowed as option I n the case that otherwise the households would have rejected or stopped their participation.
In order to limit the costs incurred by delivery and pick-up of the PDA’s, a decentralized modus operandi was implemented. Co-workers living scattered over Flanders were recruited such that the travel costs could be minimized by optimizing the allocation of tasks to co-workers. The full procedure was administered and guided by means of a computer-assisted application which has been specifically designed for this purpose.
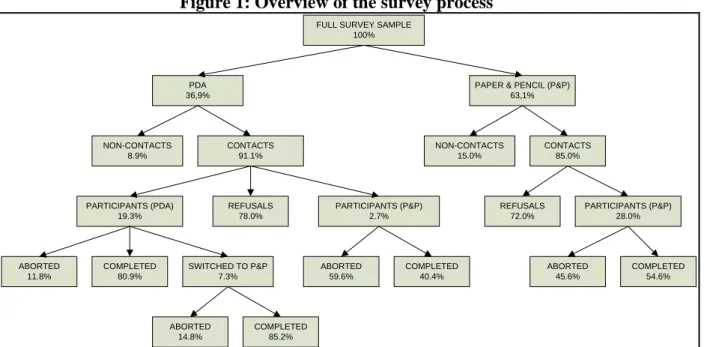
Figure 1: Overview of the survey process
PDA 36,9%
PAPER & PENCIL (P&P) 63,1% CONTACTS 91.1% CONTACTS 85.0% NON-CONTACTS 8.9% NON-CONTACTS 15.0% FULL SURVEY SAMPLE
100% REFUSALS 78.0% PARTICIPANTS (PDA) 19.3% PARTICIPANTS (P&P) 2.7% REFUSALS 72.0% PARTICIPANTS (P&P) 28.0% SWITCHED TO P&P 7.3% COMPLETED 80.9% ABORTED 11.8% ABORTED 14.8% COMPLETED 85.2% ABORTED 59.6% COMPLETED 40.4% COMPLETED 54.6% ABORTED 45.6%
Figure 1 displays the survey process. From this figure it is clear that more households were assigned to the paper and pencil data collection than to the data collection by means of the PDA application. Given the assignment to the PDA or paper and pencil data collection, small differences could be observed in the percentage of households that was successfully contacted, yet these differences are purely random as the households were arbitrary assigned to the two modes of data collection. Since more than 85% of the households were successfully contacted after three calling attempts, with an average of 1.5 phone calls to contact the household, one can conclude that the three phone call attempts were up to the mark.
From Figure 1, one can also observe that participation rates are rather low as could be expected. After all, declining response rates in household surveys, a relative high respondent burden due to the surveying of planned and executed activity-travel behavior during a seven day period, and low response rates in general in Belgium (Demarest et al., 2007) make the data collection effort a more difficult task. Moreover, one could notice that very few people switched from the PDA data collection to the paper and pencil mode. Recall that switches were only allowed as option in the case that otherwise the households would have rejected or stopped their participation. The finding that of the households that participate significantly more complete the surveys using PDA when compared to paper and pencil, indicates that the PARROTS application was perceived as a user-friendly survey tool, tailored for keeping the respondent burden to a minimum.
4 Mixed-mode design effects
Bayart et al. (2008) highlighted that although combining survey modes and methods provide the opportunity to remedy increasing difficulties in data collection (increasing costs, declining response rates, etc), mixing survey modes requires some caution. When mixed survey modes are used, and individuals have the choice to report data with the survey medium that suits them, the responses are not comparable anymore, because the sample is no longer random and the presence of respondents is determined by external factors which may also affect the variable of interest in the studied model. This risk is limited by randomly assign the survey instruments to the households and therefore self-selection is not a real issue. Allowing the respondents to switch from PDA to paper and pencil could introduce self-selection, but as noted earlier, switching was only suggested as a solution to reduce non-response. In the balancing exercise between self-selection bias, and non-response bias the choice was in this made to choose to limit the non-response bias. Moreover, only 5% of the completed surveys were completed using paper and pencil diaries, in stead of the originally attribution to the PDA data collection. Thus, the potential self-selection biasing effect is only marginal and therefore can be neglected.
Moreover, it is important to assess to what extent the survey instrument (PDA versus paper and pencil) contribute to differences in the magnitude of activity-travel reported by the respondents. Yennamami and Srinivasan (2008) suggested an approach for combining data sources and assessing the impact of survey mode on estimated quantities using a heteroscedastic linear regression structure. Formally the heteroscedastic linear regression (HLR) model can be represented by the following equation:
0 0 1 1 K K i k ki i k ki i i k k T X S X S , 2 0, i N i ,
where Ti is the quantity investigated (to test the effect of the survey instrument, two quantities are analyzed, namely the daily number of out-of-home activities and the daily number of trips), Xki is the value of the kth explanatory variable corresponding to respondent
i, Si equals 1 if the data from respondent i was collected using PDA and 0 if the data from respondent i was collected using paper & pencil, and are the coefficients on the explanatory variables including constant terms. The parameters are called the “base effects” as they capture the effect of explanatory factors (e.g. socio-demographics) on travel behavior, whereas the term are called “interaction effects” and capture how the effects of the explanatory factors on travel behavior are different across the survey modes. The error terms are assumed to be independently normally distributed across the respondents with a mean zero. The variance of the error term i2 is assumed to depend on the survey mode and parameterized as follows: i2 2exp S Thus, the variance of the error terms is i
2 2
exp
i for PDA and
2
for paper & pencil ( is called the scale parameter).
Next to three socio-demographic variables (age, gender and occupational status (professionally active versus non-active), also weekend effects are included in the HLR model, as respondents were asked to report their activity travel behavior for seven days (a dummy variable equal to one for weekdays, and equal to zero was included). In addition the effect of attrition is taken into account by including attrition dummies (six dummy variables representing the first six day of recording, the seventh day taken as baseline reference), as
well as their interaction effect with the mode dummy (so different attrition effects for both modes are estimated as well).
The heteroscedastic linear regression models are estimated in a stepwise fashion. First the complete models with all explanatory variables (age, gender, occupational status, weekday/weekend dummy, attrition dummies) and corresponding interaction effects with the mode dummies were modeled. Then, non-significant interactions and main effects were removed from the model. Note, however, when interaction effects are significant, it is recommended to include the main effect regardless the significance of the main effect. To ensure the stability of the results, also the effect of multicollinearity is assessed using variance inflation factors (VIFs). Regression results are considered to be stable when the largest VIF is smaller than 10.
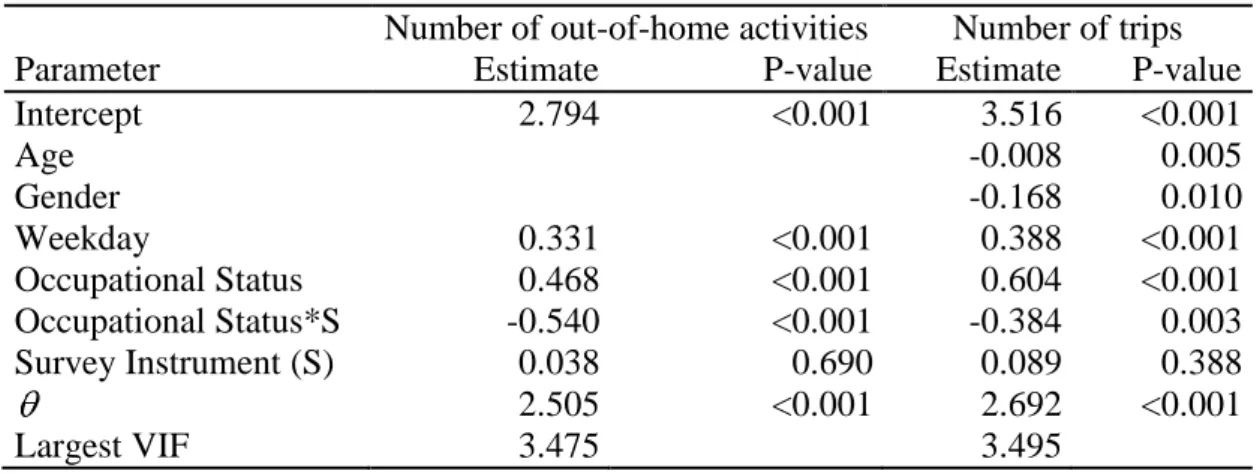
The final models that were obtained for the number of out-of-home activities and number of trips are presented in Table 2 (Note that the stability of the results is assured as the largest VIF is smaller than 10). From this Table one can see that no attrition dummies or their corresponding interaction variables with the mode dummy were significant (there are not included in the final models), indicating that there was no difference in attrition between respondents filling in the paper and pencil diary and the respondents using the PDA application, and that there was no fatigue in reporting activity-travel behavior. This is in line with the preliminary exploratory data analysis results reported by Bellemans et al. (28). The results of the models also show that, although mode has no direct impact on the quantities investigated, it does influence the estimation in two ways. First, the mode influences the effect of the professional (occupational) status. Second, the variance in the estimation of the quantities analyzed, differ significantly: the estimates are highly significant (p-value < 0.001) for both the number of out-of-home activities reported, and the number of trips registered. Thus, in order to combine data collected from both survey modes, it is essential that these types of mode effects are properly taken into account. Satisfactory, the results show that although small differences between the two modes existed, both survey modes actually recorded activity-travel behavior in a comparable manner. Note however, that Bellemans et al. (2008) did report on differences in data quality favoring the data collection by means of PDA.
Table 2: Parameter estimates and corresponding p-values for the HLR models
Number of out-of-home activities Number of trips
Parameter Estimate P-value Estimate P-value
Intercept 2.794 <0.001 3.516 <0.001 Age -0.008 0.005 Gender -0.168 0.010 Weekday 0.331 <0.001 0.388 <0.001 Occupational Status 0.468 <0.001 0.604 <0.001 Occupational Status*S -0.540 <0.001 -0.384 0.003 Survey Instrument (S) 0.038 0.690 0.089 0.388 2.505 <0.001 2.692 <0.001 Largest VIF 3.475 3.495
5 Conclusions
In this paper, the complete survey design of a large scale activity-based data collection effort was discussed. A mixed survey design of using a PDA application on the one hand, and using traditional paper and pencil diaries on the other hand, turned out to be a very suitable way of collecting detailed information about planned and executed activity-travel behavior of households. The results showed that no attrition effects were present, not on the number of out-of-home activities reported, nor on the number of trips reported. Moreover the survey mode (PDA versus paper and pencil) had no direct impact on the quantities investigated. Notwithstanding, it is essential for further analysis on the Feathers data to explicitly take into account mode effects because of two reasons. First, the effect of explanatory variables can be influenced by the survey mode (in the results discussed in this paper the effect of occupational status was significantly influenced by mode). Second, the variance in the estimation of the quantity investigated can different significantly. Heteroscedatisc linear regression models provide the required framework to explicitly take into account mode effects.
References
Arentze, T.A. et al. (2000) Albatross: Multiagent, Rule-Based Model of Activity Pattern Decisions.
Transportation Research Record: Journal of the Transportation Research Board 1706, 136-144.
Bayart, C., P. Bonnel and C. Morency (2008) Survey Mode Integration and Data Fusion: Methods and Challenges. In Proceedings of the 8th International Conference On Survey Methods in Transport. CD-ROM,
International Steering Committee for Travel Survey Conferences, Annecy (France).
Bellemans T. et al. (2008) Field Evaluation of Personal Digital Assistant Enabled by Global Positioning System: Impact on Quality of Activity and Diary Data. Transportation Research Record: Journal of the Transportation
Research Board 2049, 136-143.
Billiet, J. and H. Waege (2001) Een samenleving onderzocht: Methoden van sociaal-wetenschappelijk
onderzoek. Standaard Uitgeverij, Antwerp.
Brög, W. (2006) The New Kontiv Design – NKD. Socialdata, Munich.
Clarke, M., M. Dix and P. Jones (1981) Error and uncertainty in travel surveys. Transportation 10, 105-126. Cochran, W.G. (1977) Sampling Techniques, 3rd Edition. Wiley, New York.
Demarest, S., L. Gisle and J. Van der Heyden (2007) Playing hard to get: field substitutions in health surveys.
International Journal of Public Health 52, 188-189.
Dillman, D.M. (1991) The design and administration of mail surveys. Annual Review of Sociology 17, 225-249. Gershuny, J. (2004) Time budget research in Europe. In S. Zamagni and E. Agliardi (eds.), Time in Economic Theory. Edward Elgar, Cheltenham.
Janssens D. et al. (2007) Modeling short-term dynamics in activity-travel patterns: the Feathers model. In
Proceedings of the 11th World Conference on Transportation Research. CD-ROM, WCTRS, Berkeley.
Janssens D. et al. (2008) Simulating Emergent Behavior and Evolution of Activity-Travel Patterns: Data Collection Challenges. In Proceedings of the 8th International Conference On Survey Methods in Transport.
Joh, C.-H., T.A. Arentze and H.J.P. Timmermans (2003).Modeling individuals’ activity-travel rescheduling heuristics: Theory and numerical experiments. Transportation Research Record: Journal of the Transportation
Research Board 1807, 16-25.
Joh, C.-H., T.A. Arentze, and H.J.P. Timmermans (2004) Activity-Travel Scheduling and Rescheduling Decision Processes: Empirical Estimation of Aurora Model. Transportation Research Record: Journal of the
Transportation Research Board 1898, 10-18.
Jones P. et al. (1983) Understanding Travel Behavior. Gower, Aldershot.
Kalfs, N. and W.E. Saris (1997) New data collection methods in travel surveys. In D.F. Ettema and H.J.P. Timmermans (eds.), Activity-Based Approaches to Travel Analysis. Pergamon Press, Oxford, 243-262.
Kochan B. et al. (2006) Dynamic activity-travel diary data collection using a GPS-enabled personal digital assistant. In K.C.P. Wang et al. (eds), Applications of Advanced Technology in Transportation. Amercian Society of Civil Engineers, Reston, VA, 319-324.
Mahmassani, H.S., S.G. Hatcher and C.G. Caplice (1991) Daily variation of trip chaining, scheduling and path selection behaviour of work commuters. In Proceedings of the Sixth International Conference on Travel
Behavior. Methods for Understanding Travel Behavior in the 1990s. Quebec, 29-45.
Moons, E. and G. Wets (2007) Tackling Non Response in Household Travel Surveys: A Case study. In
Proceeding of the 56th Session of the International Statistics Institute. CD-ROM, Lisbon.
Pas, E.I. and F. Koppelman (1987) An examination of the determinants of day-to-day variability in individuals’ urban travel behavior. Transportation 14, 3-20.
Ramaekers K. et al. (2008). Linking activity-based travel demand models and traffic assignment: A Flemish case study. In Proceedings of the TRB Conference on Innovations in Transport Modeling 2008. Portland, Oregon.
Stopher, P. (1992) Use of an activity-based diary to collect household travel data. Transportation 19, 159-176. Timmermans, H.J.P., T.A. Arentze and C.-H. Joh (2001) Modeling the effects of anticipated time pressure on the execution of activity programs. Transportation Research Record: Journal of the Transportation Research
Board 1752, 8-15.
Vehovar, V. (1999) Field Substitution and Unit Nonresponse. Journal of Official Statistics 15, 335-350.
Verweij N. et al. (1987) Tijdbestedingsonderzoek middles tele-interviewing en de mogelijkheden voor segmentatie. Massacommunicatie 4, 253-369.
Wolf, J. (2004) Applications of new technologies in travel survey. In Proceedings of the Seventh International
Conference on Travel Survey Methods. CD-ROM, International Steering Committee for Travel Survey
Conferences, Playa Herradura (Costa Rica).
Yennamami, R. and S. Srinivasan (2008) Disaggregate Comparison of Travel Reported by Two American Surveys, The Nhts and the Atus. In Proceedings of the 8th International Conference On Survey Methods in Transport. CD-ROM, nternational Steering Committee for Travel Survey Conferences, Annecy (France).
Zimowski M. et al. (1997) Nonresponse in household travel surveys. FHWA/PD-98/029, NORC, Chicago, IL.