HAL Id: hal-00297570
https://hal.archives-ouvertes.fr/hal-00297570
Submitted on 9 Aug 2006
HAL is a multi-disciplinary open access
archive for the deposit and dissemination of
sci-entific research documents, whether they are
pub-lished or not. The documents may come from
teaching and research institutions in France or
abroad, or from public or private research centers.
L’archive ouverte pluridisciplinaire HAL, est
destinée au dépôt et à la diffusion de documents
scientifiques de niveau recherche, publiés ou non,
émanant des établissements d’enseignement et de
recherche français ou étrangers, des laboratoires
publics ou privés.
mountain forest soil
B. Kitzler, S. Zechmeister-Boltenstern, C. Holtermann, U. Skiba, K.
Butterbach-Bahl
To cite this version:
B. Kitzler, S. Zechmeister-Boltenstern, C. Holtermann, U. Skiba, K. Butterbach-Bahl. Controls over
N2O, NOx and CO2 fluxes in a calcareous mountain forest soil. Biogeosciences, European Geosciences
Union, 2006, 3 (4), pp.383-395. �hal-00297570�
www.biogeosciences.net/3/383/2006/ © Author(s) 2006. This work is licensed under a Creative Commons License.
Biogeosciences
Controls over N
2
O, NO
x
and CO
2
fluxes in a calcareous mountain
forest soil
B. Kitzler1, S. Zechmeister-Boltenstern1, C. Holtermann2, U. Skiba3, and K. Butterbach-Bahl4
1Federal Research and Training Centre for Forests, Natural Hazards and Landscape (BFW), Seckendorff-Gudent-Weg 8,
Vienna, Austria
2Sellenyg. 2–4/52, Vienna, Austria
3Institute of Terrestrial Ecology, Bush Estate, Penicuik, Midlothian EH26 OQB, Scotland
4Institute for Meteorology and Climate Research, Atmospheric Environmental Research, Forschungszentrum Karlsruhe,
Kreuzeckbahnstraße 19, 82467, Garmisch-Partenkirchen, Germany
Received: 1 July 2005 – Published in Biogeosciences Discuss.: 9 September 2005 Revised: 24 February 2006 – Accepted: 2 April 2006 – Published: 9 August 2006
Abstract. We measured nitrogen oxides (N2O and NOx),
dinitrogen (N2) and carbon dioxide (CO2) emissions from a
spruce-fir-beech forest soil in the North Tyrolean limestone Alps in Austria. The site received 10.6–11.9 kg N ha−1y−1 nitrogen as bulk deposition. Fluxes of nitric oxide (NO) were measured by an automatic dynamic chamber system on an hourly basis over a two year period. Daily N2O
emis-sions were obtained by a semi-automatic gas measuring sys-tem. In order to cover spatial variability biweekly man-ual measurements of N2O and CO2emissions were carried
out in addition. For acquiring information on the effects of soil and meteorological conditions and of N-deposition on N-emissions we chose the auto-regression procedure (time-series analysis) as our means of investigation. Hence, we could exclude the data’s autocorrelation in the course of the time. We found that soil temperature, soil moisture and bulk N-deposition followed by air temperature and precipitation were the most powerful influencing parameters effecting N-emissions. With these variables, up to 89% of observed tem-poral variations of N-emissions could be explained. During the two-year investigation period between 2.5 and 3.5% of deposited N was reemitted in form of N2O whereas only
0.2% were emitted as NO. At our mountain forest site the main end-product of microbial activity processes was N2and
trace gases (N2O and NO) were only of minor importance.
Correspondence to: B. Kitzler ([email protected])
1 Introduction
Nitrous oxide (N2O) is a stable greenhouse gas in the
tro-posphere and is involved directly in global warming. In the stratosphere it is responsible for the catalytic decomposition of ozone (Crutzen, 1979). The increase in the atmosphere is reported at present to be about 0.25% per year (IPCC, 2001). As the potential of global warming of N2O is 300
times higher than that of carbon dioxide (CO2) a further
in-crease of atmospheric N2O concentration might affect global
climate even more in the future.
In contrast, nitric oxide (NO) is indirectly involved in global warming and contributes to the net production of ra-diative tropospheric ozone and photochemical air pollution (Crutzen, 1995; Firestone and Davidson, 1989; Williams et al., 1992).
The production of N2O, NO, and N2in soils is mainly the
result of nitrifying and denitrifying bacteria (e.g. Davidson et al., 2000; Conrad, 1996; Lovett et al., 2002). These micro-bial activity processes and thus the production rates of NO, N2O and N2, are influenced by various factors. These drivers
are temperature, precipitation, total N, availability of O2,
mineralization rate, respiration, texture and structure, avail-able nitrogen, pH and tree species composition (Davidson et al., 2000; Ludwig et al., 2001; Simek and Cooper, 2002). As forest soils are generally not treated with N fertilizers, N deposition from the atmosphere which are mainly due to NH3release from agricultural practices and NOxrelease
from combustion processes provides a considerable increase in mineral N input to forest soils. Atmospheric N-deposition is estimated to be at least 5 kg N ha−1y−1in most regions of Europe, but can reach up to 50 kg N ha−1y−1in Central and Northern Europe (NADP, 2002). Nitrogen surplus in forest
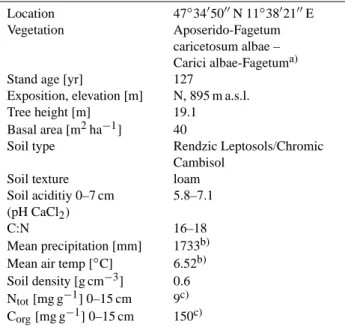
Table 1. Site and soil characteristics of the investigation site Achenkirch. Location 47◦3405000N 11◦3802100E Vegetation Aposerido-Fagetum caricetosum albae – Carici albae-Fagetuma) Stand age [yr] 127
Exposition, elevation [m] N, 895 m a.s.l. Tree height [m] 19.1
Basal area [m2ha−1] 40
Soil type Rendzic Leptosols/Chromic Cambisol
Soil texture loam
Soil aciditiy 0–7 cm (pH CaCl2)
5.8–7.1
C:N 16–18
Mean precipitation [mm] 1733b) Mean air temp [◦C] 6.52b) Soil density [g cm−3] 0.6 Ntot[mg g−1] 0–15 cm 9c)
Corg[mg g−1] 0–15 cm 150c) a)Englisch and Starlinger 1995, b)Mean of years 1998–2003, c)Mutsch 2001.
soil can be stored as soil N, taken up by microbes and plants or leached into groundwater. It can alter the rates of micro-bial N- and C- turnover in soil or it can be nitrified and deni-trified to gaseous products of NO, N2O and N2(Skiba et al.,
2004). Increased N-deposition can lead to changes in soil chemistry, forest composition and forest productivity.
A deposition of 12 kg ha−1y−1 of nitrogen at the study site Achenkirch (AK) is moderate but exceeds Critical Loads according to the WHO-Guideline (WHO, 1995) for sensi-tive coniferous forest ecosystems (Smidt et al., 1996). In other alpine areas an input of up to 30 kg ha−1y−1 was found (Herman et al., 2002) and increased flux rates of at-mospheric greenhouse gas emissions (NO, N2O, CO2, CH4)
might be expected. However, only limited information is available about effects of atmospheric N deposition on the biosphere-atmosphere exchange of N trace gases in alpine forest ecosystems. For the estimation of global budgets such measurements are needed. During a two-year sampling pe-riod of CO2, N2O and NOxemissions, measurements were
carried out in order to (1) investigate the trace gas exchange between a typical spruce-beech-fir forest soil in the lime-stone Alps and the atmosphere. Measurements were con-ducted in high temporal and spatial resolution to (2) get bet-ter estimates of annual emissions, (3) study the relationships between N-trace gas emissions and meteorological factors and soil parameters, (4) investigate if N-deposition affects N-emissions in these forest ecosystems and (5) find an ap-propriate statistical procedure to describe the relationships between N-emissions and their ecological drivers.
2 Material and methods
2.1 Investigation site and soil
The 127 year old forest is located in the Achental of the North Tyrolean limestone Alps, and was described by Englisch and Starlinger (1995) as a warm, central-montane spruce-fir-beech forest. The M¨uhleggerk¨opfl is a completely isolated hill, formed from dolomite, at a height of 895 m above sea level. The soils are mainly Rendzic Leptosols and Chromic Cambisol and are characterized by a high clay content and a low percentage of coarse material in the upper 10 cm. The soil properties are characterized by a high spatial heterogene-ity. The depth of the A-horizon varies from 10–35 cm. For this horizon the organic matter content is very high (>10%). Mean pH is 6.42. (For site description see Table 1). A de-tailed description of the site is given in Herman et al. (2002). 2.2 N2O and CO2flux measurements
Gas measurements were carried out as described in Kitzler et al. (2006). Gas samples of four manually operated chambers (area: 1 m2, volume: 80 l) were taken biweekly from May 2002 until July 2004. Duplicate air samples from the cham-bers were taken after 0, 1 and 2 h and injected into gas tight head-space vials (20 ml). Linearity of emission was always tested. We never observed a flattening of the N2O increase in
our chambers, which would indicate an approach of the com-pensation point for N2O. Additional measurements every 15
minutes showed that the increase in N2O concentrations
re-mained linear for up to 4 hours (Zechmeister-Boltenstern et al., 2002).
Daily (1/day) samples were taken by the automatic gas sampling system (AGPS – patent DE 198 52 859) and vials were collected every two weeks. The system is described in detail by Kitzler et al. (2006). Gas samples were stored at 4◦C until analysis.
Gas samples were automatically drawn at 6 a.m. The time was chosen based on observations that emission rates were higher in the morning. Seven diurnal measurements at different times of the year showed, that between 4 and 10 a.m. and again in the afternoon slightly higher emissions were measured, but no regular daily trend could be observed. Furthermore, a high variability was detected on successive days. At each manual sampling time we made a measure-ment with the AGPS to ensure, that with our timing of the AGPS system reliable estimates can be made. The N2O
concentrations of manually and automatically drawn samples were of similar magnitude and well within the range of spa-tial variability. In order to avoid freezing of the covering case on the sealing plate, the thermostat was set to 1◦C and there were no measurements conducted below this tempera-ture. During winter no automatic measurements were carried out, but manual measurements were carried out as long as the site was accessible. Emissions of N2O (µg N m−2h−1)
and CO2(mg C m−2h−1) were determined by the linear
in-crease of the mixing ratio within the incubation period. Ni-trous oxide and CO2fluxes were calculated as described in
IAEA (1992). Annual rates were calculated by weighting hourly emission rates with the exact period between sam-pling times. Emissions from the manual system are presented for the first investigation year (May 2002–April 2003) and for the second investigation year (May 2003–April 2004). With the AGPS (N2O-N AGPS) no measurements were made
during winter, calculated emissions are presented for June– November 2002 and May–November 2003. A gas chromato-graph (HP 5890 Series II) with a63Ni-electron-capture de-tector (ECD), connected to an automatic sample-injection system (DANI HSS 86.50, HEADSPACE-SAMPLER) was used for N2O analysis. The oven, injector and detector
temperatures were set at 120◦C, 120◦C and 330◦C,
respec-tively. A standard of 5 µl l−1N2O (Linde Gas) was used
and dilution series (5; 2.5; 1.25; 0.625; 0.25 vppm) were made regularly. Standards were placed after each batch of 12 samples. Dinitrogen in ECD-quality with a flow rate of 30 ml min−1served as carrier-gas. We quantified a minimum detectable N2O flux of 0.04 µg N m−2h−1 and the relative
error falls below <17% with a median of 5%. Carbon diox-ide was analysed by using a gas chromatograph (Hewlett-Packard 5890 II series) equipped with a thermal conductivity detector (TCD). Helium was used as carrier-gas (flow rate 10 ml min−1); the CO2 standard contained 10 ml l−1 CO2
(Linde Gas) and dilution series (10 000; 5000; 2500; 1250; 500 vppm) were made regularly. Standards were placed after each batch of 12 samples. The detection limit for CO2flux
was 0.001 mg C m−2h−1. 2.3 NOxflux measurements
Continuous measurements of NOx were completed by a
fully automated system (Holtermann, 1996), at an hourly frequency. NOx was measured with a HORIBA
APNA-360 chemoluminescence NOx analyzer (detection limit:
1 ppbv NO or 0.6 µg NO-N m−2h−1, 1 ppbv NO2; flow rate:
1 l min−1). The reading for NOxof the HORIBA analyzer
refers to NO, NO2 and other nitrogen compounds (PAN,
NH3, HONO, HNO3, aerosol ammonium, nitrate and nitrite).
We therefore use the terms NO and (NOx-NO) further on.
The median error was <15% and <35% for NO and NOx
-NO, respectively. Calibration was conducted monthly by us-ing a HORIBA calibration unit (Transferstandard, ASGU-360, 0–600 ppb). The quality of calibration near the detec-tion limit was <1%. To avoid reacdetec-tions of NO and O3in the
chambers, a filter cylinder, filled with Purafil and activated charcoal, was applied in front of the chambers in year 1 (May 2002–April 2003) as no ozone analyzer was available in this year. In the second year (May 2003–April 2004) we used an ozone analyzer (HORIBA APOA-360) for measuring O3
concentrations within the chambers. Thus, the chemical re-action between NO and O3 could be considered. No filter
was applied in this year.
Air samples were taken from 5 stainless steel chambers (ø=20 cm; Vol.=3.27 l), plus one reference chamber where the opening to the soil was sealed with a Plexiglas pane. Each chamber was closed (Plexiglas lid) for 5 min within which steady state was reached. For the calculation of the fluxes of the first year we followed the protocol of Schindl-bacher et al. (2004), and for the second year the protocol of Butterbach-Bahl et al. (1997). For corrections in the tubings see also Beier and Schneewind (1991) and for corrections in the dynamic chambers Remde et al. (1993) and Ludwig (1994). For further details on analysis of gas samples and calculation of fluxes compare Kitzler et al. (2006). Ozone can strongly absorb to the chamber wall and to tubes and does effect the gas phase correction of NO and NO2fluxes.
An error analysis indicated that O3absorption at the chamber
walls was negligible and no correction of fluxes was deemed necessary. Even a 30% decrease of O3concentration would
have changed the NO flux by less than 0.2 µg N m−2h−1 which is in our case smaller than the detection limit. The measured pressure deficit (Pressure sensor: PCLA 12X5D Sensor Technics) in our chambers is < than 0.6 Pa and ir-relevant for N-fluxes. The residual aerodynamic resistance was determined as suggested by Ludwig (1994) and was 61 s m−1. This value is in accordance to published values (55 and 60 s m−1) by Meixner et al. (1997) and Gut et al. (2002). 2.4 Soil samples
Soil samples were taken approximately every two months. Extractable nitrogen was determined from litter layer (frame: 30×30 cm) and mineral soil (upper 7 cm), and analysed ac-cording to Kandeler (1995). Soil moisture was determined gravimetrically. The pH was measured in soil suspensions in 0.01 M CaCl2solution using a glass electrode.
Addition-ally to these analysis, an acetylene (C2H2) inhibition
exper-iment was carried out twice (May 2003 and August 2003). Acetylene inhibits the reduction of N2O to N2and is used to
quantify the total N-emission (N2O+N2)that is produced via
denitrification (Klemedtsson et al., 1990). Per sampling time 16 soil cores from the upper 5 cm mineral soil were incu-bated in airtight incubation cylinders (volume: 500 ml) and sealed with silicon grease. The headspace air of the cylin-ders was sampled (30 ml) at the beginning of the incubation period and after 4 h at a temperature of 25◦C; thus allowing the determination of N2O production. Afterwards, acetylene
was introduced into the head-space, exposing the soil core to 10 kPa acetylene. Gas sampling procedure and incubation of the acetylene treated samples was the same as for non treated samples. Gas samples were analyzed for N2O as described
in Sect. 2.2. The difference between acetylene treated and untreated N2O production was calculated to be the N2
pro-duction at the time of soil sampling (May 2003 and August 2003). Water filled pore space of soil samples was 43% and 46%.
Table 2. Mean soil nitrogen [µg N g−1dw] and pH (CaCl2) in the
litter layer and in the upper 7 cm mineral soil in year 1 (May 2002– April 2003) and year 2 (May 2003–April 2004) at Achenkirch.
year 1 year 2 Litter layer NH+4-N 65.8 (8.5) 43.1 (4.0) NO−3-N 31.4 (4.4) 18.3 (2.2) pH (CaCl2) 6.1 (0.1) 5.8 (0.1) Mineral soil NH+4-N 21.0 (3.0) 8.8 (1.2) NO−3-N 1.5 (0.3) 2.1 (0.3) pH (CaCl2) 6.5 (0.1) 6.3 (0.1) Note: Soil data are means with standard error in parenthesis.
2.5 Meteorological data
Soil temperature (in◦C, Vitel-thermisters) and soil moisture data (in %, Vitel – Theta probes) were quantified at a soil depth of 5, 15, 25 and 50 cm and stored in a data logger. Air temperature (◦C) was measured with a LTK-592 C sensor
(Inc. Sommer) at 2 m above ground in a standard weather station. Measuring interval was 4 h. As far as the man-ual gas sampling time was concerned, soil temperatures at a soil depth of 3 and 10 cm were additionally measured around the chambers. Daily precipitation was recorded by an om-brometer at the nearby meteorological station – Pumpwerk Achenkirch. The biweekly input below the crown was calcu-lated from the crown throughfall collectors.
2.6 Deposition measurements
Dry N-deposition comprises NH3and NO2, NO (if soil
com-pensation mixing ratio is exceeded), HONO, HNO3, PAN,
aerosol ammonium, nitrate and nitrite. In this study, con-centrations of NH3were captured by three passive diffusion
tubes (Tang et al., 2001) and were analysed at CEH Edin-burgh.
In this study the samplers were placed in the canopy at the investigation site at a height of 1.5 m and were changed monthly. Dry deposition velocities were assumed to be 3 mm s−1for NH3(Duyzer, personal communication). Bulk
deposition was collected biweekly using 15 crown through-fall collectors. Bulk deposition was analysed for NH+4-N and NO−3-N (Dionex DX100 and Dionex 120). Concentration of NH3 was measured in the first investigation year (May
2002–April 2003), whereas bulk deposition was measured in the first and the second investigation year (May 2003-April 2004).
Table 3. Sum of bulk and sum of NH3deposition [kg N ha−1y−1]
and precipitation via throughfall in year 1 (May 2002–April 2003) and year 2 (May 2003–April 2004) at the study site Achenkirch.
year 1 year 2 Precipitation [mm] 1416 1067
N-input by bulk deposition/throughfall [kg N ha−1y−1]
NH+4-N 3.5 4.6
NO−3-N 7.1 7.3
Sum of bulk deposition 10.6 11.9
N-input by dry deposition [kg N ha−1y−1]
NH3-N 0.56 n.d.
n.d. = not determined.
2.7 Statistical analysis
Data were checked for normal distribution. The t-test or the nonparametric Wilcoxon-test was used for determining dif-ferences in soil emissions, soil chemical and N-deposition data between the investigation years. Pearson or Spearman rank correlation was used for determining relations between daily or biweekly emission data and soil, meteorological or deposition data. A moving average of 2 was applied for de-position data.
As variables are autocorrelated in the course of time (Durbin-Watson statistic), the autoregression procedure – GARCH (p, q) model (generalized autoregressive condi-tional heteroscedasticity model) – was used to detect influ-ences of soil data, meteorological- or deposition data on N-emissions. Specifications of the GARCH model are de-scribed in detail in Kitzler et al. (2006). Variables that emerged to correlate best with N2O and NO emissions and
variables, whose effects on emissions were lagged, were in-corporated in the models. Statistical analysis was either com-pleted using SAS Enterpriseguide Version 2 or SAS Version 8. All differences reported were significant at p<0.05 unless otherwise stated.
3 Results
3.1 Soil nitrogen and pH
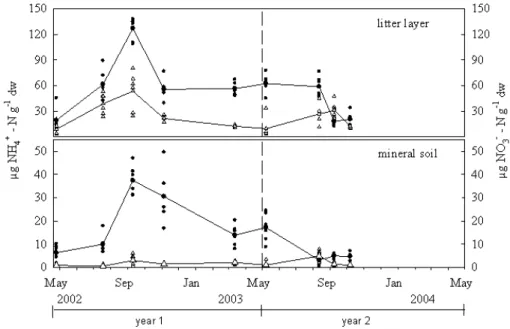
Concentrations of extractable N in the litter layer were at their highest after litterfall in autumn and reached a max-imum of 138 µg NH+4-N g−1 dw (dry weight) and 80 µg NO−3-N g−1 dw in September 2002 (Fig. 1). Mean NH+4 -N and -NO−3-N concentrations of the first year were consid-erably higher than the concentrations measured in the sec-ond year (Table 2). A similar seasonality was also observed with regard to N concentrations in the mineral soil. Here, up to 7.9 µg NO−3-N g−1dw (year 1) and up to 50 µg NH+4 -N g−1dw (year 2) were reached in autumn. In the second
Fig. 1. Extractable NH+4-N (circles) and NO−3-N (triangles) in the litter layer and in the mineral soil at Achenkirch in the first investigation year (May 2002–April 2003) and the second investigation year (May 2003–April 2004). The straight line indicates the mean. Pooled samples (n=4) were taken from around the individual chambers.
year considerably lower NH+4-N concentrations were de-tected, particularly in autumn. Mean soil pH was 6.4 with a maximum of 7.0 and a minimum of 5.4. PH of the litter layer was generally lower (mean=5.9) and ranged from 5.1– 7.1.
3.2 Nitrogen input
In the two years of investigation, the N-input via through-fall amounted to 10.6 kg and 11.9 kg N ha−1y−1 (Table 3). Ratio of deposited NO−3-N:NH+4-N is 1.7:1. In general, N from throughfall had its maximum in spring/early summer. In the second year, however, the highest bulk N-deposition was detected in autumn (Fig. 2). No relationship was found between precipitation rates and N-input. Concentrations of NH3were as high as 7.7 µg NH3m−3in the first year (May
2002–April 2003), respectively. The forest floor received 21.6 kg N ha−1y−1 (1999) through litterfall (Herman et al., 2002).
3.3 Gas fluxes 3.3.1 CO2fluxes
Maximum CO2emissions were recorded in summer,
follow-ing a seasonal course of air and soil temperature (Fig. 3a). In the first investigation year the summer peak was not as pro-nounced and summer emissions were significantly (p<0.01) smaller than in the following year. In late autumn emissions decreased steadily and reached a minimum in winter (0.0– 0.2 mg CO2-C m−2h−1).
Table 4. Mean CO2-C ( mg C m−2h−1), N2O-N and NO-N
emis-sions (µg N m−2h−1), minimum and maximum values and number of observations at Achenkirch. (year 1: May 2002–April 2003 and year 2: May 2003–April 2004). Mean NO-N emissions are calcu-lated for a) June–November 2002 and b) May–November 2003.
CO2-C N2O-N NO-N [mg C m−2h−1] [µg N m−2h−1] year 1 mean 11.6 4.5 0.7a) min-max (0–56.4) (−3.5–34.0) (0.4–2.5) N 95 242 105 year 2 mean 19.7 4.4 0.5b) min-max (0.4–83.0) (−2.9–40.6) (−0.1–7.6) N 96 288 145
NO-N emissions are calculated for a) July–October 2002 and b) May–November 2003.
Mean CO2 emission were 11.6±1.1 mg CO2-C m−2h−1
(year 1) and 19.7±2.0 mg CO2-C m−2h−1 (year 2)
show-ing a significant difference between the two years (Ta-ble 4). At our site the cumulative soil respiration rate was 1.3±0.3 t C ha−1y−1 (Table 5) with a 60% higher annual CO2production rate in year 2.
The most influencing parameters controlling CO2
emis-sions were soil temperature at a soil depth of 3–25 cm (r2=0.86) and air temperature (r2=0.70).
Table 5. Measured and predicted CO2-C (± S.E) [kg C ha−1y−1], N2O-N emissions (± S.E) [kg N ha−1y−1] from the manual chambers
for the two investigation years at the site Achenkirch (year 1: May 2002–April 2003 and year 2: May 2003–April 2004); N2O-N (AGPS)
and NO-N emissions [kg N ha−1y−1] are calculated for a) June–November 2002 and b) May–November 2003.
CO2-C N2O-N (manual) N2O-N (AGPS) NO-N
kg C ha−1y−1 kg N ha−1y−1
measured measured predicted1,2 measured predicted3 measured predicted4 year 1 1020±241 0.30±0.11 0.36±0.04 0.22±0.02a) 0.28±0.01 0.03±0.002a)) 0.03±0.001
0.33±0.03
year 2 1636±283 0.41±0.09 0.26±0.04 0.19±0.02b) 0.23±0.01 0.03±0.004b) 0.03±0.004 0.38±0.04
1−4Model 1–Model 4.
Fig. 2. Bar chart: Biweekly N-input (kg N ha−1) at Achenkirch measured in the two investigation years. Pie chart: Portion of throughfall (TF NH+4-N, TF NO−3-N) on annual N-input (kg N ha−1) in the first investigation year (May 2002–April 2003).
3.3.2 N2O fluxes
Nitrous oxide emissions were mostly dependent on air and soil temperature, as well as on soil moisture. Figure 3b shows spatial and temporal variability during the investiga-tion years. Spatial variainvestiga-tion between the chambers was high (mean CV: 50%) and reached a maximum in winter (CV: 350%).
Mean N2O emissions averaged 4.4±0.3 µg N m−2h−1
(Table 4). In the course of the year largest N2O emissions
were observed in summer 2003 (40.6 µg N m−2h−1). Al-though we missed the summer peak with the manual cham-ber system in the first year, we were able to observe large N2O emissions by the AGPS (Fig. 3b). During winter, when
the site was covered with snow, a significant uptake of atmo-spheric N2O (range: −0.3 to −3.5 µg N m−2h−1) could be
observed. Significant correlations could be found between C- and N-emissions, and soil, meteorological and N-input
data (Table 6). Log-transformed N2O fluxes measured by
the manual system were positively correlated (p<0.001) to soil respiration rates (r2=0.58), soil temperature in a depth of 3 and 10 cm (r2=0.64) and air temperature (r2=0.58).
Cor-relation analysis between daily N2O fluxes from the AGPS
system and soil temperature revealed weaker but significant relationships (r2=0.27, p<0.001).
Nitrate and NH+4 deposition via throughfall and NO−3 concentration in the mineral soil showed significant posi-tive effects on N2O fluxes (r2=0.26, r2=0.25, p<0.001 and
r2=0.41, p<0.05), even higher correlation was found with NO−3 concentration in the litter layer (r2=0.44, p<0.01).
Simple regression models were insufficient for revealing dependencies of emission data, as residuals were correlated over time. Two GARCH models could be developed to pre-dict N2O emissions as measured with the manually operated
system. Independent variables in model 1 were (x1t) soil
Fig. 3. (a) Mean CO2emissions (squares±S.E) measured with the manual chambers and soil temperature [5 cm] (line), (b) mean N2O
emissions from manual (dots±S.E) and automatic (circles) chambers, (c) mean NO emissions (±S.E) and, (d) daily precipitation (bars) and soil moisture [5 cm] (line) at the study site Achenkirch in the two investigation years.
Table 6. Matrix of Pearson correlation coefficients for significant relationships of mean N-emissions from manual chambers, AGPS system
and dynamic chambers and soil-, meteorological- and N-input data at the site Achenkirch.
lnN2O-manual lnN2O-AGPS lnNO
CO2 0.58 *** Air temperature 0.58 *** 0.16 * Soil temperature 0.64 ***a) 0.27 ***b) 0.19 **b) NO−3-N litter layer 0.44 ** NO−3-N mineral soil 0.41 * TF NO−3-N 0.26 *** TF NH+4-N 0.25 *** TF sumN 0.31 *** DRY NH3-N 0.37 **
TF = throughfall, DRY = dry deposition. A moving average of 2 was applied to throughfall data. Soil temperature ina)3 and 10 cm andb) in 5 cm. Asterisk indicates the statistic significance (* p<0.05, ** p<0.01, *** p<0.001).
a soil depth of 3 cm. As an effect of N-deposition on N2O
emission was discovered while carrying out the correlation analysis (Table 6), we included the monthly sum of nitro-gen input (NO−3 and NH+4) via throughfall within model 2 and achieved an improvement of modelled N2O emissions
in comparison to simple regression analysis. Both models follow the GARCH (2, 1) process and revealed a r2of 0.89 (model 1) and r2 of 0.83 (model 2) (Fig. 4). Daily N2O
emissions from the AGPS showed a high temporal
variabil-ity. Moreover, correlations with soil parameters were lower compared to the N2O emissions measured by the spatially
ex-tended manual system. The GARCH model (Fig. 4, model 3 and Table 7) revealed that precipitation and air temperature on daily N2O emissions are delayed by 8 days (p<0.001,
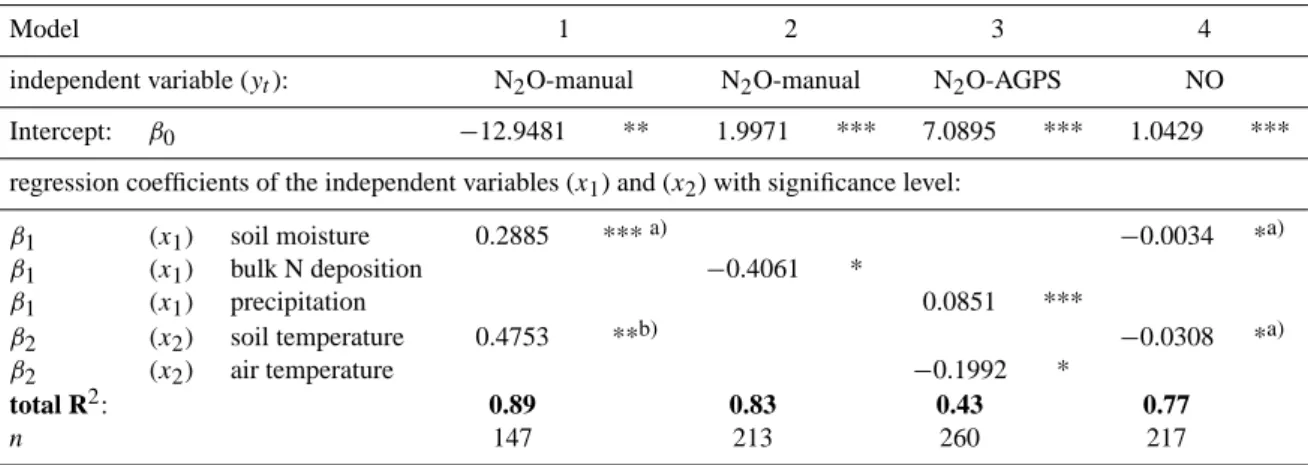
Table 7. Parameter estimation for the autoregression models 1 to 4 to predict N2O and NO emissions from the study site, Achenkirch.
Parameters are based on data from the two investigation years. Intercept, regression coefficients of the independent variables (x1) and (x2)
and significance level are shown for the individual models. a) in 5 cm, b) in 3 cm.
Model 1 2 3 4
independent variable (yt): N2O-manual N2O-manual N2O-AGPS NO
Intercept: β0 −12.9481 ** 1.9971 *** 7.0895 *** 1.0429 ***
regression coefficients of the independent variables (x1) and (x2) with significance level:
β1 (x1) soil moisture 0.2885 ***a) −0.0034 *a) β1 (x1) bulk N deposition −0.4061 * β1 (x1) precipitation 0.0851 *** β2 (x2) soil temperature 0.4753 **b) −0.0308 *a) β2 (x2) air temperature −0.1992 * total R2: 0.89 0.83 0.43 0.77 n 147 213 260 217
Regression coefficients and model parameters are statistically significant at the * p<0.05, ** p<0.01, *** p<0.001 level. Bulk N deposition = NO−3-N and NH+4-N in the throughfall.
3.3.3 NOxfluxes
Mean NO emissions were 0.7±0.04 µg N m−2h−1 and hence significantly larger in the first year (p<0.001) com-pared to the second year (0.5±0.07 µg N m−2h−1) when low soil N concentrations were measured. Mean NO emis-sions were generally smaller than N2O emission rates. A
consistent seasonal trend could not be observed: In the first year largest emissions occurred in autumn, whereas in the second year maximum emissions were measured in spring (Fig. 3c). (NOx-NO) was deposited with a mean of
−0.3±0.1 µg N m−2h−1(year 2).
Correlation analysis (Table 6) revealed a weak positive re-lationship between mean daily NO fluxes and soil tempera-ture at the soil depth of 5 cm (r2=0.19, p<0.5). No valid sta-tistical explanation could be given to characterize NO emis-sions by a simple regression model. By using the autoregres-sion procedure, however, a GARCH (1,1) model could be developed to predict daily NO emissions of our site (Fig. 4, model 4). Through a mean of daily soil moisture content (x1t) and soil temperature (x2t) at a soil depth of 5 cm,
pre-dictions of mean daily NO emissions could be carried out with an r2of 0.77 (Table 7). This model revealed a time lag of 2, signifying that the independent variables have an influ-ence on NO emissions over two days.
3.3.4 Acetylene inhibition
Acetylene inhibits the reduction of N2O to N2. The
to-tal N-emission due to denitrification can be measured. The production of N2O in C2H2-treated samples was between
101 and 4200% (median: 266%) of the samples without inhibition. The ratio of N2O-N:N2-N was 1:6. Mean
N2 production (± S.E) at a WFPS of 43% and 46% was
11.6±1.4 µg N m−2h−1and 19.1±3.9µg N m−2h−1.
4 Discussion
4.1 CO2fluxes
Carbon dioxide emissions, a measure for general microbial activity, followed a typical seasonal trend, with highest rates in summer, when mineralization of organic matter occurs. Lowest rates were measured in winter. Organic carbon is converted to CO2 during mineralization. This process is
strongly dependent on soil temperature and soil moisture. At our site, soil temperature at a soil depth of 3 and 10 cm was mostly responsible for temporal variation in soil respiration. This finding is in good agreement with results from other studies (Epron et al., 1999; Merino et al., 2004). Soil mois-ture also showed a significant effect on soil respiration rates. Carbon dioxide release was reduced during periods of heavy rain (summer 2002), when the water content was between 50–65%, probably as a consequence of O2deficiency in soil
due to diffusion restrictions (Howard and Howard, 1993). The cumulative soil respiration rates at our site (1–1.6 t CO2
-C ha−1y−1) are lower than values for temperate coniferous forests reported by Raich and Schlesinger (1992).
4.2 N2O fluxes
At our site, seasonal variations in N2O emissions followed
mainly the annual changes in soil temperature, soil moisture and the availability of N in the soil. Largest emissions were thus observed during summer/autumn. Although, we missed out on the summer peak in year 2002 through the manual
chamber system (biweekly sampling), we were able to ob-serve large emissions by the AGPS.
Soil temperature and soil moisture were the most impor-tant factors controlling N2O emissions. Those parameters
affect microorganisms and their metabolism and, hence, the production and consumption of N trace gases in soils (Con-rad, 1996). The air-filled porosity controls the movement of the gases towards and away from the atmosphere; it also af-fects soil aeration, and, thus, indirectly controls the capacity of the soil for producing or consuming soil-produced trace-gases (Smith et al., 2003; Davidson et al., 2000). In a lab-oratory parameterisation study, Schindlbacher et al. (2004) found for the AK site a N2O emission maximum at a soil
moisture range of 60%–90% water filled pore space (WFPS) which corresponds to a water content of 53–80%. In the field we found, beside the peak in August 2003, that maximum N2O emissions occurred at soil moisture values in the range
of 50%–65%, i.e. in accordance to the laboratory results of Schindlbacher et al. (2004). With the GARCH model 1 N2O
emissions could be predicted best using soil moisture and soil temperature as predictors (r2=0.89). Within the model, soil moisture showed a highly significant effect (p<0.001); an effect of soil temperature was also visible (p<0.01). Fur-thermore, high precipitation and low air temperature showed a significant effect on N2O emissions with a lag of ∼8 days
(model 3). We hypothesize that these adverse conditions for microbes may be comparable to the effects observed after freeze-thaw events. In a microcosm experiment Sharma et al. (2006) found that maximum N2O emissions occurred ∼8
days after thawing.
Largest emissions were observed in the second year in August. There are various parameters that might have con-tributed to the N2O peak. Even at this site, where soil
mois-ture is generally high, the water content during the European drought period of summer 2003 decreased to 30%. After a rainfall event soil moisture increased again and may have caused an increase in microbial activity. On the other hand, the actual level of N-deposition and the NO−3 pool in the soil might have played an important role in the sudden release of N2O (Davidson et al., 2000). Highest amounts in NO−3
and NH+4 via throughfall reached the forest floor in August. Although, throughout the study bulk N-deposition accounted for up to only 31% of the variation in N2O emission
(corre-lation analysis), a strong re(corre-lationship was apparent between the two factors. This high N2O peak coincided with
sig-nificant larger available soil N concentrations, in particular soil NO−3. Using model 2 the relationship between biweekly measured N2O emissions and biweekly sum of nitrogen
in-put (NO−3 and NH+4) via throughfall was found by a high
r2(0.83). The time series analysis revealed a highly signif-icant (p<0.001) lagged effect of reduced bulk N-deposition on N2O emission for a 3-month period. Model 1 also
re-vealed that past environmental conditions (3 months) of high soil moisture and temperature can significantly affect actual
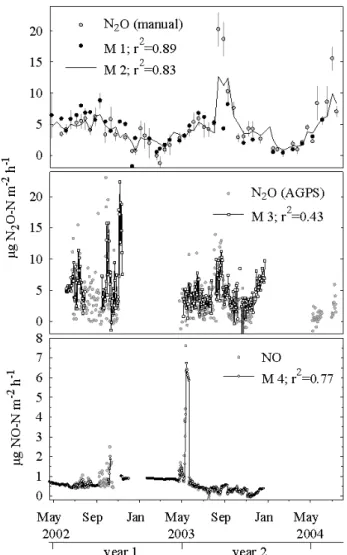
Fig. 4. Predicted versus measured N2O and NO emissions at
Achenkirch in the two investigation years. Independent variables are soil moisture and soil temperature for model 1 (M 1) and model 4 (M 4); N-deposition (NH+4-N and NO−3-N) for model 2 (M 2) and, precipitation and air temperature for model 3 (M 3).
N2O emissions. Explanations for this phenomenon can only
be hypothetical. It has been observed that nitrogen in mi-crobes may have a turnover rate of ∼3 months (Tietema and van Dam, 1996). According to the theories of microbial stochiometry (Schimel and Weintraub, 2003) microbes tend to immobilize nitrogen from the soil solution and use it for cell growth at times when it is the limiting nutrient. This could be the case during favourable growth conditions of soil moisture and high temperatures but little N-input. After ∼3 months microbial death may occur, which may lead to en-hanced N-release and N2O emissions as observed in beech
forests (Zechmeister-Boltenstern et al., 2002).
The soil at the M¨uhleggerk¨opfl is typically moist (mean 55%) and denitrification may have been the main source of N2O emissions throughout the year. A high pH value is
for denitrification at the site. Previous studies (H¨artel et al., 2002) have indicated that complete nitrification takes place at our site and that it is of major importance for N2O
emission. 15NO−3 was strongly immobilized. Furthermore, close C/N-ratios (16–18) suggest favourable conditions for N-mineralization and nitrification (Herman et al., 2002). It was in August/September that nitrate concentration increased and we suppose that the high N2O peak in the second year is
the product of nitrification.
At our site winter emissions were generally small and the site even functioned as a sink for N2O. Butterbach-Bahl et
al. (2002) detected negative N2O fluxes in pine forests with
moderate deposition whereas a pine forest with high N-loads exclusively functioned as a source of N2O during
win-ter. On the other hand winter emissions, comparable to the ones during the year (January 2003; 4.3±1.3 µg N2
O-N m−2h−1), could be observed after freeze-thaw events. These large emissions were either a result of enhanced den-itrification activity or could be due to the physical release of accumulated N2O in the snow or in the soil (Teepe et al.,
2001).
4.3 NOxfluxes
The production of NO is strongly dependent on climate and varies considerable with soil temperature and soil moisture (Davidson et al., 2000; Ludwig et al., 2001; Van Dijk et al., 2002). The optimum soil temperature (20◦C), as detected in laboratory studies by Schindlbacher et al. (2004), could not be confirmed in the field experiment, where largest NO emis-sions were measured at 8–10◦C soil temperature; maximum soil temperature in the field was 16◦C. Optimum WFPS in the field for NO emission was found to be at 30–45% WFPS (water content 27–40%) and was, thus, higher than in labora-tory studies (Schindlbacher et al., 2004). In the field largest NO emissions were found in autumn and in spring, when soil water content was between 45–50%. Large spring emissions were detected in May, when soil was moistened and soil tem-perature increased. With the GARCH procedure a relation-ship between NO emissions and soil moisture and soil tem-perature could be found with an r2=0.77 (model 4). Autore-gressive parameters were estimated for a time-lag of 2 days; i.e. NO emissions were especially promoted when soils had been colder and drier ∼2 days before.
Soil nitrogen content contributed to large NO emission in autumn, where highest NO−3 and NH+4 concentrations were measured. As in autumn 2003 the N-pool (especially ex-tractable NH+4) in the soil and the litter layer was low com-pared to concentrations measured in autumn 2002 no in-crease in NO emissions could be detected. The effect of rewetting the soil as it was found for N2O emissions could
not be seen for NO emissions.
Soil acidity is supposed to be an important factor pro-moting N-emissions from forest soils influenced by atmo-spheric nitrogen deposition (Li et al., 2000 and Venterea et
al., 2003). Soils with a pH of 7–8 are supposed to produce higher amounts of N2(Simek and Cooper, 2002) but revealed
an order of magnitude larger N2O emissions than soils with
a pH between 4 and 6 (Vermoesen et al., 1996). A soil pH of 6.7–7.1 measured at our limestone site restricts self-decomposition of HNO2and might, therefore, be
responsi-ble for small NO fluxes (Van Cleemput and Samater, 1996). Beside the high pH and the high microbial biomass (H¨artel et al., 2002), the well-balanced community composition of the microflora could be a reason for small NO-fluxes. Results of PLFA (Phospholipid fatty-acid analysis) studies of European soils by (Zechmeister-Boltenstern, unpublished) showed that at acidic high N-input sites the microbes are under stress which leads to structural changes of their cell membranes. This could cause losses of intermediate products in the ni-trification or denini-trification pathway and could, thereby, lead to larger NO and N2O emissions. The assumption of a
well-balanced microflora was supported by the acetylene inhibi-tion experiment.
4.4 Annual N-emissions
At our site the N release was between 0.3 and 0.4 kg N2
O-N ha−1y−1, and 0.03 kg NO-N ha−1y−1 (Table 5). These values correspond to a yearly release of actual N input of 2.5–3.5% in form of N2O-N and 0.2% in form of NO-N and
are located in the lower reported percentage of deposited N which is 0–16% (N2O-N) and 0–10% (NO-N) (Skiba et al.,
2004). According to the acetylene inhibition method the ra-tio of N2:N2O was 6.0. The estimated annual N2emission
is therefore 2.2 kg N ha−1. The ratio of N2:N2O is
consid-erably higher than in previous investigations of forests (0– 0.4; Wolf and Brumme, 2003; Brumme et al., 1999; Mogge et al., 1998). Our estimation is based on only two measure-ments. Conclusions need to drawn cautiously because the N2
production changes with changing WFPS% (Davidson et al., 2000). However, it can be hypothesized that the deposited N from the atmosphere is mainly emitted as N2at this
lime-stone site.
The magnitude of N2O-N emissions from our site is
con-sistent with values reported of other coniferous forests (Mac-Donald et al., 1997; Papen and Butterbach-Bahl, 1999; Butterbach-Bahl et al., 2002) and limed beech forests (Borken and Brumme, 1997). Higher emissions (16–35 N2O-N m−2h−1) have been measured from acidic soils of
N-enriched coniferous forests (Papen and Butterbach-Bahl, 1999; Butterbach-Bahl et al., 2002) and from deciduous forests (1.5–5.6 kg N2O-N ha−1y−1) with low pH (Brumme
and Beese, 1992; Borken and Brumme, 1997).
Nitric oxide emission measured in our study are small in comparison to other published NO fluxes from temperate coniferous forests. Our rates are in accordance with stud-ies by Johansson, (1984) who reported annual NO emissions of 0.04 kg NO-N ha−1y−1 from an unfertilized coniferous forest soil in Sweden. The majority of studies, however,
revealed significantly larger values. Pilegaard et al. (1999) and Butterbach-Bahl et al. (2002) found in moderately N-effected spruce forests annual NO emissions of 3.15 kg NO-N ha−1y−1 and 3.1 µg NO-N m−2h−1, respectively. It has to be taken into account that most of the reported data were measured at forest soils with low pH values; however, NO fluxes are reported to be significantly larger in more acidic soils compared to N2O fluxes (Yamulki et al., 1997).
The employed GARCH model predicts NO fluxes with a higher r2 than a regression model. Nitrous oxide emis-sions measured by manual chambers yielded an r2of 0.89 (model 1) and an r2of 0.83 (model 2). Through model 2, whith N-deposition as the only independent variable, an-nual emission rates were better than with model 1, where soil moisture and soil temperature were the independent vari-ables. Especially in the second year, where large emissions (singular event) were detected in August, the predicted emis-sions with model 2 had a higher R-squared as with model 1. High variations in N2O emissions measured by the AGPS led
to an overestimation of N2O emissions through model 3 (21–
27%). Daily measured NO emissions were predicted with an r2of 0.77 (model 4) and also the high peak in May was captured. Annual simulated fluxes were in accordance with measured annual NO emissions.
We conclude that the GARCH model is better than a con-ventional regression analysis, because soil N-emissions can be modelled with a higher r2. It reflects lagged effects of soil moisture, soil temperature, precipitation, air temperature and N-deposition on N-oxide emissions. The use of time-series models in GHG-flux investigations is a novel approach in soil science. So is the search for time-lagged responses of gas fluxes to environmental factors. At our site, NO emissions were three times smaller compared to N2O emissions and
to-tal emissions of N were small compared to N-inputs. This may be attributed to the fact that in the limestone Alps soil pH is high, a large microbial biomass can be found and ni-trogen is mainly emitted in the form of N2. Alone in Austria,
about a third of forests are on calcareous bedrock and this is the first report on processes determining N-oxides fluxes in these ecosystems.
Acknowledgements. We would like to thank the landowners for access to their land. A. Fiege, J. Pausch, J. Plattner, and F. Winter for field work, C. Abo-Elschabaik and M. Kitzler for assisting with the sample analysis, M. Pfeffer and P. Rosenkranz for technical advice, S. Smidt for provision of meteorological data and S. Wolf, S. Dayton, R. Jandl, F. X. Meixner and two anonymous reviewers for critical discussion and editing. The study is a part of the NOFRETETE project EVK2-CT2001-00106 funded by the European Commission DG Research – Vth Framework Programme. Edited by: F. X. Meixner
References
Beier, N. and Schneewind, R.: Chemical reactions of gases in tubes of probing systems and their influence on measured concentra-tions., Ann. Geophys., 9, 703—707, 1991,
http://www.ann-geophys.net/9/703/1991/.
Borken, W. and Brumme, R.: Liming practice in temperate forest ecosystems and the effects on CO2, N2O and CH4fluxes, Soil
Use and Management, 13, 251–257, 1997.
Brumme, R. and Beese, F.: Effects of liming and nitrogen fertil-ization on emissions of CO2and N2O from temperate forest, J. Geophys. Res., 97, 12, 851–858, 1992.
Brumme, R., Borken, W., and Finke, S.: Hierachical control on ni-trous oxide emission in forest ecosystems, Global Biogeochem. Cycl., 13, 1137–1148, 1999.
Butterbach-Bahl, K., Gasche, R., Breuer, L., and Papen, H.: Fluxes of NO and N2O from temperate forest soils: impact of forest
type, N deposition and of liming on NO and N2O emissions, Nutr. Cycl. Agroecosys., 48, 79–90, 1997.
Butterbach-Bahl, K., Breuer, L., Gasche, R., Willibald, G., and Pa-pen, H.: Exchange of trace gases between soils and the atmo-sphere in Scots pine forest ecosystems of the northeastern Ger-man lowlands: 1. Fluxes of N2O, NO/NO2 and CH4at forest
sites with different N-deposition, For. Ecol. Manag., 167, 1–3, 123–134, 2002.
Conrad, R.: Soil microrganisms as controllers of atmospheric trace tases (H2, CO, CH4, OCS, N2O, NO), Microbiol. Rev., 60, 609– 640, 1996.
Crutzen, P. J.: The role of NO and NO2 in the chemistry of the
troposphere and stratosphere, Annu. Rev. Earth Planet. Sci., 7, 443–472, 1979.
Crutzen, P. J.: Ozone in the troposphere, in: Composition, Chem-istry, and Climate of the Atmosphere, edited by: Signh, H. P., Van Nostrand Reinhold, New York, 349–393, 1995.
Davidson, E. A., Keller, M., Erickson, H. E., Verchot, L. V., and Veldkamp, E.: Testing a conceptual model of soil emissions of nitrous and nitric oxides, BioScience, 50, 667–680, 2000. Englisch, M. and Starlinger, F.: Waldgesellschaften und Standorte
im Bereich der H¨ohenprofile Achenkirch, FBVA-Bericht, 87, 25–54, 1995.
Epron, D., Farque, L., Lucot, E., and Badot, P. M.: Soil CO2efflux
in a beech forest: the contribution of root respiration, Ann. For. Sci., 56, 4, 289–295, 1999.
Firestone, M. K. and Davidson, E. A.: Microbial Basis of NO and N2O Production and Consumption in Soil, in: Exchange of Trace Gases between Terrestrial Ecosystems and the Atmo-sphere, edited by: Andreae, M. O. and Schimel, D. S., John Wi-ley, New York, 7–21, 1989.
Gut, A., Scheibe, M., Rottenberger, S., Rummel, U., Welling, M., Ammann, C., Kirkham, G. A., Kuhn, U., Meixner, F. X., Kesselmeier, J., Lehmann, B. E., Schmidt, W., M¨uller, E., and Piedade, M. T. F.: Exchange fluxes of NO2and O3at soil leaf surfaces in an Amazonian rain forest, J. Geophys. Res., 107, 8060, doi:10.1029/2001JD000654, 2002.
H¨artel, E., Zechmeister-Boltenstern, S., and Gerzabek, M.: Gaseous nitrogen losses from a forest site in the north Tyrolean limestone alps, Environm. Sci. Poll. Res., Special Issue 2, 23–30, 2002. Herman, F., Smidt, S., Englisch, M., Feichtinger, F., Gerzabek,
M., Haberhauer, G., Jandl, R., Kalina, M., and Zechmeister-Boltenstern, S.: Investitations of nitrogen fluxes and pools on
a limestone site in the Alps, ESPR – Environm. Sci. Poll. Res., 46–52, 2002.
Holtermann, C.: A transportable system for the on-line-measurement of NOx(NO, NO2)-emission from soils, Die
Bo-denkultur, 47, 235–244, 1996.
Howard, D. M. and Howard, P. J.: Relationships between CO2
evo-lution, moisture content and temperature for a range of soil types, Soil Biol. Biochem., 25, 1537–1546, 1993.
IAEA: Manual on measurements of methane and nitrous ox-ide emissions from agriculture, International Atomic Energy Agency, Vienna, 90, 1992.
IPCC: Climate Change 2001: The Scientific Basis. Contribution of Working Group I to the Third Assessment Report of the Inter-governmental Panel of Climate Change, in: Cambridge Univer-sity Press, edited by: Houghton, J. T., Ding, Y., Griggs, D. J., Noguer, M., Van der Linden, P. J., and Xiaosu, D., Cambridge, UK and New York, NY, USA, 881p., 2001.
Johansson, C.: Field measurements of emission of nitric oxide from fertilized and unfertilized forest soils in Sweden, J. Atmos. Chem., 1, 429–442, 1984.
Kandeler, E.: Ammonium and Nitrate, in: Methods of Soil Biology, edited by: Schinner, F., ¨Ohlinger, T., Kandeler, E., and Margesin, R., Springer, Berlin, 406–410, 1995.
Kitzler, B., Zechmeister-Boltenstern, S., Holtermann, C., Skiba, U., and Butterbach-Bahl, K.: Nitrogen oxides emission from two beech forests subjected to different nitrogen loads, Biogeo-sciences, 3, 293-310, 2006,
http://www.biogeosciences.net/3/293/2006/.
Klemedtsson, L., Hanson, G., and Mosier, A.: The use of acetylene for the quantification of N2and N2O production from biological
processes in soils, in: Denitrification in soil and sediment, edited by: Sorensen, J. and Revsbech, N. P., Plenum Press, 167–180, 1990.
Li, C., Aber, J. D., Stange, F., Butterbach-Bahl, K., and Papen, H.: A process-oriented model of N2O and NO emission from for-est soils,1, Model development, J. Geophys. Res., 105(4) 4369– 4384, 2000.
Lovett, G. M., Weathers, K. C., and Arthur, M. A.: Control of nitro-gen loss from forested watersheds by soil carbon: Nitronitro-gen ratio and tree species composition, Ecosys., 5, 712–718, 2002. Ludwig, J.: Untersuchungen zum Austausch von NO und NO2
zwischen Atmosph¨are und Biosph¨are, PhD Thesis, University of Bayreuth, 251, 1994.
Ludwig, J., Meixner, F. X., Vogel, B., and F¨orstner, J.: Soil-air ex-change of nitric oxide: An overview of processes, environmental factors, and modeling studies, Biogeochemistry, 52, 225–257, 2001.
MacDonald, J., Skiba, U., Sheppard, L. J., Ball, B. C., Roberts, J. D., Smith, K. A., and Fowler, D.: The effect of nitrogen depo-sition and seasonal variability on methane oxidation and nitrous oxide emission rates in upland spruce plantation and moorland, Atmos. Environ., 31, 22, 3693–3706, 1997.
Meixner, F. X., Fickinger, T., Marufu, L., Serca, D., Nathaus, F.J., Makina, E., Mukurumbira, L., and Andreae, M. O.: Preliminary results on nitric oxide emissions from southern African savannah ecosystem, Nutr. Cycl. Agroecosys., 48, 123-138, 1997. Merino, A., P´erez-Batall´on, P., and Mac´ıas, F.: Responses of soil
organic matter and greenhouse gas fluxes to soil management and land use changes in a humid temperate region of southern
Europe, Soil Biol. Biochem., 36, 917–925, 2004.
Mogge, B., Kaiser, E.A. and Munch, J.C.: Nitrous oxide emissions and denitrification N-losses from forest soils in the Bornh¨oved lake region (Northern Germany), Soil Biol. Biochem., 30, 703– 710, 1998.
Mutsch, F.: Bodenchemische Charakterisierung des M¨uhleggerk¨opfls im Rahmen einer Untersuchung ¨uber Stickstoff-Fl¨usse in den Norditoler Kalkalpen, FBVA Berichte, 116, Wien, 33–40, 2001.
NADP: National Atmospheric Deposition Program 2001 Summary, NADP Report, Illinois State Water Survey, Champaign, IL, 2002. Papen, H. and Butterbach-Bahl, K.: A 3-year continuous record of trace gas fluxes from untreated and limed soil of a N-saturated spruce and beech forest ecosystem in Germany: I. N2O-emissions, J. Geophys. Res., 104, 18 487–18 503, 1999.
Pilegaard, K., Hummelshoj, P., and Jensen, N. O.: Nitric oxide emission from a Norway spruce forest floor, J. Geophys. Res., 104, 3433–3445, 1999.
Raich, J. W. and Schlesinger, W. H.: The global carbon dioxide flux in soil respiration and its relationship to vegetation and climate, Tellus, 44B, 81–99, 1992.
Remde, A., Ludwig, J., Meixner, F. X., and Conrad, R.: A study to explain the emission of nitric oxide from a marsh soil, J. Atmos. Chem., 17, 249-275, 1993.
Rummel, U., Ammann, C., Gut, A., Meixner, F. X., and Andreae, M. O.: Eddy covariance measurements of nitric oxide flux within an Amazonian rain forest, J. Geophys. Res., 107(D20), 8050, doi:10.1029/2001JD000520, 2002.
Schimel, D. S. and Weintraub, M. N.: The implications fo exoen-zyme activity on microbial carbon and nitrogen limitation in soil: a theoretical model, Soil Biol. Biochem., 35, 549–563, 2003. Schindlbacher, A., Zechmeister-Boltenstern, S., and
Butterbach-Bahl K.: Effects of soil moisture and temperature on NO, NO2
and N2O emissions from forest soils, J. Geophys. Res., 109, 1–
12, 2004.
Sharma, S., Szele, Z., Schilling, R., Munch, J. C., and Schloter, M.: Influence of freeze-thaw on the structure and func-tion of microbial communities and denitrifying populafunc-tion in soil, Appl. Environm. Microbiology, 72, 3, 2148–2154, doi:10.1128/AEM.72.3.2148-2154.2006, 2006.
Simek, M. and Cooper, J. E.: The influence of soil pH on denitri-fication: progress towards the understanding of this interaction over the last 50 years, Eur. J. Soil Sci., 53, 3, 345–354, 2002. Skiba, U., Pitcairn, C. E. R., Sheppard, L. J., Kennedy, V. H., and
Fowler, D.: The influence of atmospheric N deposition on nitrous oxide and nitric oxide fluxes and soil ammonium and nitrate con-centrations, Water, Air Soil Poll., Focus 4, 37–43, 2004. Smidt, S., Herman, F., Grill, D., and Guttenberger, H.: Studies of
ecosystems in the Limestone Alps – “Achenkirch Altitude Pro-files”, Phyton, 36, Horn, Austria, 1996.
Smith, K. A. Ball, T., Conen, F., Dobbie, K. E., Massheder, J., and Rey, A.: Exchange of greenhouse gases between soil and atmo-sphere: interactions of soil physical factors and biological pro-cesses, Eur. J. Soil Science, 54, 4, 779–791, 2003.
Tang, Y. S., Cape, J. N., and Sutton, M. A.: Development and types of passive samplers for monitoring atmospheric NO2and NH3
concentrations, The Scientific World, 1, 513–529, 2001. Teepe, R., Brumme, R., and Beese, F.: Nitrous oxide
Biochem., 33, 1269–1275, 2001.
Tietema, A. and van Dam, D.: Calculating microbial carbon and nitrogen transformations in acid forest litter with 15N enrich-ment and dynamic simulation modelling, Soil Biol. Biochem., 28, 953–965, 1996.
Van Cleemput, O. and Samater, A. H.: Nitrite in soils: accumulation and role in the formation of gaseous N compounds, Fertil. Res., 45, 81–89, 1996.
Van Dijk, S. M., Gut, A., Kirkman, G. A., Meixner, F. X., and An-dreae, M. O.: Biogenic NO emissions from forest and pasture soils: Relating laboratory studies to field measurements, J. Geo-phys. Res., 107, 8058, doi:10.1029/2001JD000358, 2002. Venterea, R. T., Groffman, P. M., Verchot, L. V., Magill, A. H.,
Aber, J. D., and Streudler, P. A.: Nitrogen oxide gas emissions from temperate forest soils receiving long-term nitrogen inputs, Global Change Biol., 9, 346–357, 2003.
Vermoesen, A., de Groot, C., Nollet, L., Boeckx, P., and Van Cleem-put, O.: Effect of ammonium and nitrate application on the NO and N2O emission out of different soils, Plant Soil, 181, 153– 162, 1996.
WHO: Updating and revision of the air quality guidelines for Eu-rope, Les Diablerets, 1995.
Williams, E. J., Hutchinson, G. L., and Fehsenfeld, F. C.: NOxand
N2O emissions from soil, Global Biogeochem. Cycl., 6, 351–
388, 1992.
Wolf, I. and Brumme, R.: Dinitrogen and nitrous oxide formation in beech forest floor and mineral soils, Soil Sci. Soc. Amer. J., 67, 1862–1868, 2003.
Yamulki, S., Harrison, R. M., Goulding, K. W. T., and Webster, C. P.: N2O, NO and NO2fluxes from a grassland: Effect of soil pH, Soil Biol. Biochem., 29, 1199–1208, 1997.
Zechmeister-Boltenstern, S., Hahn, M., Meger, S., and Jandl, R.: Nitrous oxide emissions and nitrate leaching in relation to micro-bial biomass dynamics in a beech forest soil, Soil Biol. Biochem., 34, 823–832, 2002.
![Table 3. Sum of bulk and sum of NH 3 deposition [kg N ha −1 y −1 ] and precipitation via throughfall in year 1 (May 2002–April 2003) and year 2 (May 2003–April 2004) at the study site Achenkirch.](https://thumb-eu.123doks.com/thumbv2/123doknet/14777054.594370/5.892.115.385.166.366/table-deposition-precipitation-throughfall-april-april-study-achenkirch.webp)
![Table 5. Measured and predicted CO 2 -C ( ± S.E) [kg C ha −1 y −1 ], N 2 O-N emissions ( ± S.E) [kg N ha −1 y −1 ] from the manual chambers for the two investigation years at the site Achenkirch (year 1: May 2002–April 2003 and year 2: May 2003–April 2004)](https://thumb-eu.123doks.com/thumbv2/123doknet/14777054.594370/7.892.123.771.170.324/table-measured-predicted-emissions-manual-chambers-investigation-achenkirch.webp)
![Fig. 3. (a) Mean CO 2 emissions (squares ± S.E) measured with the manual chambers and soil temperature [5 cm] (line), (b) mean N 2 O emissions from manual (dots±S.E) and automatic (circles) chambers, (c) mean NO emissions (±S.E) and, (d) daily precipitatio](https://thumb-eu.123doks.com/thumbv2/123doknet/14777054.594370/8.892.194.702.94.481/emissions-measured-chambers-temperature-emissions-automatic-emissions-precipitatio.webp)