HAL Id: hal-03023630
https://hal.archives-ouvertes.fr/hal-03023630
Submitted on 25 Nov 2020
HAL is a multi-disciplinary open access
archive for the deposit and dissemination of
sci-entific research documents, whether they are
pub-lished or not. The documents may come from
teaching and research institutions in France or
abroad, or from public or private research centers.
L’archive ouverte pluridisciplinaire HAL, est
destinée au dépôt et à la diffusion de documents
scientifiques de niveau recherche, publiés ou non,
émanant des établissements d’enseignement et de
recherche français ou étrangers, des laboratoires
publics ou privés.
luminescence properties
Victor Castaing, Charlotte Monteiro, Atul Sontakke, Kazuki Asami, Jian Xu,
Alberto Fernández Carrión, Mikhail Brik, Setsuhisa Tanabe, Mathieu Allix,
Bruno Viana
To cite this version:
Victor Castaing, Charlotte Monteiro, Atul Sontakke, Kazuki Asami, Jian Xu, et al.. Hexagonal
Sr1-x/2Al2-xSixO4:Eu 2+ ,Dy 3+ transparent ceramics with tuneable persistent luminescence properties.
Dalton Transactions, Royal Society of Chemistry, 2020, �10.1039/D0DT03137B�. �hal-03023630�
Journal Name
ARTICLE
Received 00th January 20xx, Accepted 00th January 20xx DOI: 10.1039/x0xx00000x www.rsc.org/Hexagonal Sr
1-x/2Al
2-xSi
xO
4:Eu
2+,Dy
3+transparent ceramics
with tuneable persistent luminescence properties
Victor Castaing*a, Charlotte Monteirob, Atul D. Sontakkea, c, Kazuki Asamid, Jian Xud, Alberto J.
Fernández Carriónb, e, Mikhail G. Brikf, Setsuhisa Tanabed, Mathieu Allixb and Bruno Viana*a.
Co-doped hexagonal Sr1-x/2Al2-xSixO4:Eu2+,Dy3+ (0.1≤x≤0.5) transparent ceramics have been elaborated by
full glass crystallization. The compositions with low SiO2 content (x≤0.4) require fast quenching
conditions to form glass, i.e. specific elaboration processes such as aerodynamic levitation coupled to laser heating, whereas the x=0.5 glass composition can be prepared at large scale by classic melt-quenching method in commercial furnaces. After a single thermal treatment, the resulting SrAl2O4-based
transparent ceramics show varying photoluminescence emission properties when x increases. These variations are also observable in persistent luminescence, resulting in an afterglow colour-tuning ranging from green to light blue. Afterglow excitation spectra highlight the possible activation in the visible range of the obtained persistent luminescence. Indeed, persistent luminescence of hexagonal Sr0.75Al1.5Si0.5O4:Eu2+,Dy3+ large transparent ceramics has been successfully charged using a typical
smartphone low power white light source. Moreover, thermoluminescence glow curves of samples containing different Dy3+ doping concentrations are studied to gain insights regarding the traps origin
and depth. Coupling thermoluminescence results together with luminescence thermal quenching and band gap calculations appears useful to understand the charge trapping and detrapping evolution with the material composition. Varying the Si-content in hexagonal Sr1-x/2Al2-xSixO4:Eu2+,Dy3+ compounds
appears as a promising strategy to obtain transparent materials with tuneable green to light blue persistent luminescence.
1. Introduction
Energy storage phosphors, particularly the persistent phosphors, have been widely studied in the past twenty years aiming at the elaboration of the next generation of lighting materials. These materials are able to store so-called optical energy, mostly UV, and emit light for minutes to hours after the excitation stoppage. The applications cover wide ranges from emergency lighting, safety signs, visualization, decorations, etc. Extensive research on these particular materials started after the discovery of the SrAl2O4:Eu2+,Dy3+ phosphor by Matsuzawa et al., demonstrating
considerably intense and long green afterglow emission1 arising
from the 5d → 4f transition of the Eu2+ doping ion. This famous
material, as well as the well-known CaAl2O4:Eu2+,Nd3+, have been
elaborated by different techniques2–5 and widely studied6–15 to
better understand their persistent luminescence mechanism.
Since then, many other materials have been elaborated and studied with that purpose.16,17 Amongst others, garnets
(Y3Al2Ga3O12:Ce3+,Cr3+, Gd3Al2Ga3O12:Ce3+,Cr3+), perovskite-type
niobates or titanates (NaNbO3:Pr3+, CaTiO3:Pr3+) and spinel
gallates (ZnGa2O4:Cr3+, Zn1.1Ga1.8Ge0.1O4:Cr3+) are famous
persistent luminescence materials.18–26 However, most of these
persistent materials require UV irradiation to be charged. This is a noteworthy obstacle for most of the targeted applications. Indeed, the most convenient and common excitation sources are the sunlight and white light-emitting diodes (w-LEDs), which mostly provide visible light. Therefore, in view of widespread usage, persistent luminescence materials chargeable with visible light illumination become more advantageous.
At present, most ceramic persistent phosphors are used as security signage when incorporated in paints. The painted writings or signs can thus be seen for hours after the dark is set. Yet, even though they already find usage as cycling or jogging lanes illumination during night time, the persistent phosphors require improved performance for large area lighting applications.27,28 Designing transparent bulk persistent
phosphors then appears as a promising strategy to overcome the intensity weakness of the materials due to lower light scattering than in the powder phosphor case. Such an approach would enable persistent charging and emission from the whole material volume, thus effectively reducing energy loss.18 This “volume
effect” was demonstrated by Xu et al. in YAGG:Ce3+,Cr3+ where an
effective improvement of the persistent decay was induced by increasing the transparent ceramic thickness.19 Moreover, such
designs allow reading through the transparent persistent phosphor thereby using the material as a lighting screen.29 In
a.Chimie ParisTech, Institut de Recherche de Chimie Paris, PSL Research University,
CNRS, Paris 75005, France
b.CNRS, CEMHTI UPR3079, Université Orléans, F-45071 Orléans, France c. Condensed Matter & Interfaces, Debye Institute for Nanomaterials Science,
Utrecht University, Princetonplein 1, 3584 CC Utrecht, The Netherlands
d.Graduate School of Human and Environmental Studies, Kyoto University, Kyoto
606-8501, Japan
e. MOE Key Laboratory of New Processing Technology for Nonferrous Metals and
Materials, Guangxi Universities Key Laboratory of Non-ferrous Metal Oxide Electronic Functional Materials and Devices, College of Materials Science and Engineering, Guilin University of Technology, Guilin 541004, P. R. China
f. Institute of Physics, University of Tartu, W. Ostwald Str. 1, Tartu, 50411, Estonia
E-mail: victor.castaing@chimieparistech.psl.eu bruno.viana@chimieparistech.psl.eu
view of such added capabilities compared to glow in the dark inks, transparent persistent phosphors show potential advantages for security and night vision applications.
Moreover, current available afterglow emission colours are fairly limited. This is due to the fact that persistent emission properties mostly arise from one of the doping ions located in a particular crystalline compound type, mostly giving access to dark blue (Eu2+ in CaAl2O4:Eu2+,Nd3+) and green (Eu2+ in
SrAl2O4:Eu2+,Dy3+) persistent emissions. Widening the colour
range, giving access to a higher contrast using association of persistent materials with different colours, is of major interest for signalization applications. For that purpose, the most common strategy is to modify the host matrix to change the crystal field strength on the emitting cation and shifts its emission. The elaboration of materials with combined persistent emission centres gathered in a single-phase phosphor appears as another promising direction to create a broad range of persistent luminescence colours though less studied. Only few phosphors with persistent luminescence arising from combined emission centres, based on persistent energy transfers, have been reported.30,31
Several recently developed persistent phosphors achieve one or two of these criteria, in particular some persistent garnets that are transparent and can be efficiently charged by visible light.18,19
Within this work, we aimed at elaborating and characterizing a material fulfilling the three above cited criteria i.e. a transparent persistent ceramic monolith with colour tuneability excited by visible light.
Recently, full crystallization of glass was presented as a promising process to synthesize innovative transparent ceramics.32–41 Among the several transparent materials
developed, the metastable solid-solution Sr1-x/2Al2-xSixO4 (h-SASO
x with 0.2 ≤ x ≤ 0.5) presents tuneable luminescence properties when doped with europium. 42,43 Given that its structure derives
from the hexagonal polymorph of SrAl2O4, which is reported to
have persistent luminescence properties,44 this solid-solution
appears promising to tune the famous properties of the monoclinic SrAl2O4:Eu2+,Dy3+ persistent phosphor. Indeed, due to
a combination of absence of porosity, crystallite orientation (birefringent structure) and optical isotropy induced by structural disorder, the materials belonging to the Sr1-x/2Al2-xSixO4
solid solution show a remarkable transparency. Sr2+ cations
occupy different crystallographic sites in the two SrAl2O4
polymorphs. In the monoclinic structure, two Sr2+ sites exist
whereas in the hexagonal structure five different Sr2+ sites can be
found.42 As Eu2+ substitutes for Sr2+, different optical properties
can be observed for the two polymorphs.42,45 Moreover, as the Sr
sites occupancies evolve along the solid solution, tuneable persistent luminescence properties can be expected.
In the present study, we report the elaboration of hexagonal Sr1-x/2Al2-xSixO4:Eu2+,Dy3+ (h-SASO x, with 0.1 ≤ x ≤ 0.5)
transparent ceramics. Their optical properties, among which persistent luminescence, are studied in detail and compared to each other along the solid solution. Finally, the luminescence properties evolution is discussed based on experimental results, on semi-empirical model and on density functional theory calculations.
2. Experimental procedures
2.1. Synthesis.
In this study, compositions Sr1-x/2Al2-xSixO4 where x = 0, 0.05, 0.08,
0.09, 0.1 0.2, 0.3, 0.4 and 0.5 were investigated and were either
single-doped by Eu2+ (1% Eu2+ in substitution to Sr) or co-doped
with Eu2+, Dy3+ (1 % Eu2+ and 2 % Dy3+). Moreover, for the x = 0.5
compound, a series of Dy3+ contents varying from 0 % to 5 % were
investigated. Melting of each composition has been performed using a double CO2 laser-heating system coupled to an
aerodynamic levitation (ADL) system.46,47 High purity SrCO3
(99.9%, Strem Chemicals), Al2O3 (99.98%, Alfa Aesar), SiO2
(99.999%, Strem Chemicals), Eu2O3 (99.99%, Sigma Aldrich) and
Dy2O3 (99.99%, Alfa Aesar) precursors were first weighed in
stoichiometric amounts and mixed in an agate mortar with absolute ethanol. Each powder batch was then pressed into pellets and placed on a metallic nozzle. Aerodynamic levitation was ensured using an argon gas flow. Depending on the composition, temperatures used for melting were ranging from ca. 1900°C to 1700°C (the melting temperature decreases with the increase of the Si-content). 0 ≤ x ≤ 0.09 compositions could not be entirely vitrified as crystallisation systematically occurred directly during quenching from the melt. For x = 0.1 composition, only 1 mm diameter beads could be vitrified. Nevertheless, 3 mm diameter glass beads could be obtained for compositions with 0.2 ≤ x ≤ 0.5 by free cooling down to room temperature after laser heating stoppage.
For the x = 0.5 sample, glass could also be obtained at much larger scale, with a maximum of 10 g of the mixed precursors, using classical melt-quenching method in a Pt crucible at 1750 °C. The crystallization stage of the glassy samples was subsequently conducted as reported by Fernández-Carrión et. al. (Tcryst = 975 °C
for 7 h), excepted that the heating atmosphere was turned into reducing atmosphere (H2/N2 mixing, 5 % of H2) to promote
europium reduction.42
2.2.
Structure and optical properties characterizations.
X-ray powder diffraction data were recorded using a Bragg-Brentano D8 Advance Bruker diffractometer (Cu Kα radiation) equipped with a LynxEye XE detector over an angular range of 19° < 2θ < 70° using a 0.020° step size.
An optical parametric oscillator (OPO) pulsed laser has been used for the excitation of photoluminescence (PL) measurements while the acquisition was held by a CCD camera (Princeton Instruments, PI-MAX 4) coupled to a monochromator (Princeton Instruments, Acton SP 2300). For photoluminescence excitation (PLE) and temperature dependence of PL/PLE, the excitation was provided by a white lamp (EQ-99X LDLS, ENERGETIQ) coupled to a visible monochromator. LEDs (ThorLabs) were used to excite samples for persistent emission measurements. A typical smartphone white light emitting diode (w-LED, placed 10 cm away from the sample, giving an illuminance of 2740 Lux) was also used to activate persistent luminescence. Persistent decay glow curves were obtained by integrating persistent emission intensity as a function of time. For radiance decay measurements, the samples were charged using a 300 W Xe lamp (Asahi) attached with the UV module (centred at 330 nm) for 5 minutes at 25 °C. Then, the persistent emission decay was recorded using a photomultiplier tube (R11041, Hamamatsu Photonics) coupled with calibrated photodiode detector (S-025-H, Electro-Optical System Inc.) for absolute radiance conversion. Persistent excitation spectra were obtained by integrating persistent luminescence intensity after 1 min excitation at each wavelength step obtained using a white lamp (EQ-99X LDLS, ENERGETIQ) coupled to a visible monochromator. Thermoluminescence measurements were carried out using a closed-cycle He-flow cryostat (Sumitomo Cryogenics HC-4E) attached with a Lakeshore 340 temperature controller. The samples were cooled to 13 K and irradiated using a 365 nm UV lamp (Vilber Lourmat,
Journal Name ARTICLE
Hg vapor lamp) for five minutes. Subsequently, after a waitting time of one minute, the thermoluminescence glow curves were recorded at 10 °C.min-1 ramp rate from 13 K to 600 K. For the sake of comparison, a TL glow curve has been recorded with charging at 273 K, cooling down to 213 K with the same heating ramp. In these experiments, the signals were recorded by a CCD camera (Roper Pixis 100) coupled to a visible monochromator (Acton Spectra Pro, Princeton Instruments, 300 grooves per mm, centred at 600 nm).
2.3.
Theoretical calculations.
The density functional theory (DFT) calculations of the structural and electronic properties of Sr1-x/2Al2-xSixO4 (x = 0, 0.2 and 0.5)
were performed using the CASTEP module of Materials Studio 201748 package and the GGA-PBE functionals.49 The ionic core
electrons were replaced by on-the-fly ultrasoft pseudopotentials implemented in the CASTEP with the following electronic configurations: [Kr] 4s2 4p6 5s2 for Sr, [Ne] 3s2 3p1 for Al, [Ne] 3s2
3p2 for Si and [He] 2s2 2p4 for O.50 Relativistic effects were taken
into account at the level of the Koelling-Harmon approximation of the Dirac equation.44 The plane-wave basis energy cut-off was
chosen as 630.0 eV and k-point grids were chosen as 3×2×2 for x = 0 and 2×2×2 for x = 0.2 and 0.5. The convergence parameters were as follows: total energy tolerance 5.0×10⁻⁶ eV/atom,
maximum force tolerance 0.01 eV/Å, maximum stress component 0.02 GPa and maximum displacement 5.0×10⁻⁴ Å.
3. Results and discussion
3.1.
Crystal structure and morphology.
The nature of the crystallized singly-doped and co-doped samples was first checked by X-ray diffraction, see Figure 1(a). For the x = 0 sample, the crystalline phase was obtained directly by cooling from the melt which was attributed to the cooling rate of aerodynamic levitation (ca. 300-500 °C per second) which is not high enough to ensure glass formation of SrAl2O4. The resulting
crystalline phase can be indexed by the monoclinic polymorph of SrAl2O4 (PDF 01−076−7488), without any additional trace of
Eu2O3 nor Dy2O3. For 0 < x < 0.1, partial crystallization was
obtained by cooling from the melt (some unwanted crystallization could not be avoided). However, unlike the x = 0 material, after the subsequent heat treatment, both monoclinic and hexagonal polymorphs are formed, with an increasing ratio of hexagonal polymorph when the x value increases. The two crystalline structures are represented on Figure 1(b) and (c) respectively. From XRPD patterns comparison, it is clear that the Si substitution for Al (and the associated Sr vacancy increase) promotes the hexagonal polymorph stabilization, as demonstrated by the increasing content of hexagonal polymorph as x increases (ICSD 259261, 259262 and 259263).42 Finally, for
higher Si contents (x 0.1), glass formation was possible and polycrystalline ceramics could be obtained via full glass crystallization after subsequent thermal treatment. No trace of monoclinic-SrAl2O4 polymorph, Eu2O3, nor Dy2O3 phases could be
observed for these compositions. A shift of the diffraction peaks towards higher diffraction angles is observed all along the series, which can be explained by lattice contraction along the substitution of Al3+ (0.39 Å) by a smaller cation Si4+ (0.26 Å) and
the increase of Sr2+ vacancies.52 In these SrAl2O4:Eu2+,Dy3+
materials, Eu2+ and Dy3+ are expected to substitute for Sr2+.
Indeed, these rare earth cations have excessive large radius difference with Al3+, well beyond the limit of the Hume-Rothery
atomic substitution rule. Moreover, no amorphous phase could be observed from X-ray diffraction and electron microscopy, suggesting that full crystallization occurs in these materials.
As reported for their Eu2+ singly doped counterparts, the
ceramic samples show good transparency in the visible range (see Figure 2).42 Note that the x = 0.1 sample is not shown here as glass
crystallization could not be performed without the appearance of
Fig. 1. (a) X-ray powder diffraction (XRPD) patterns of Sr1-x/2Al2-xSixO4:Eu2+,Dy3+ ceramics obtained with the melt quenching technique followed by a second heat treatment stage. The x = 0 sample crystallized directly from the melt. Samples with 0 < x < 0.1 partially crystallized from the melt whereas glasses were obtained for 0.1 x 0.5 compositions. After the second heat treatment stage all the samples are completely crystallized. The x = 0 sample corresponds to the monoclinic polymorph whereas the 0.1 x 0.5 compositions crystallize in the pure hexagonal polymorph. (b) Monoclinic SrAl2O4 and (c) hexagonal Sr0.8Al1.6Si0.4O4 crystal lattices in which Sr, Al, Si, O atoms and vacancies are represented by green, light blue, dark blue, red and white spheres, respectively.
Fig. 2. (a) Spectral dependence of the transmittance of the as elaborated h-SASO samples. (b) Photographs of the corresponding transparent ceramics. The scale bar is in cm scale (the small samples are 1.6 mm thick whereas the x = 0.5 sample is 2.2 mm thick).
cracks for this composition. This can be linked to the small size (diameter of 1 mm) of the initial glass beads, which makes very difficult the crystallization process control of these samples. The observed yellow tint of the ceramics can be linked with the blue absorption of Eu2+ observed until ca. 450 nm. Above this region,
the transparency of the samples is very high in the visible range, reaching 83 % for Sr0.9Al1.8Si0.2O4:Eu2+,Dy3+ (see Figure 2(a)).
From a glass forming point of view, it can be observed that the synthesis temperature (temperature used to vitrify each composition) decreases when the Si-content (x) increases (see Fig. S1). As the glass formation is eased when the Si-content (x) increases, it is thus possible to elaborate the x = 0.5 glass composition using a commercial furnace (synthesis temperature of about 1750°C using a Pt/Rh crucible), enabling much larger scale samples to be synthesized (the size of the x = 0.5 sample presented figure 2(b) was limited by size of our platinum crucible).
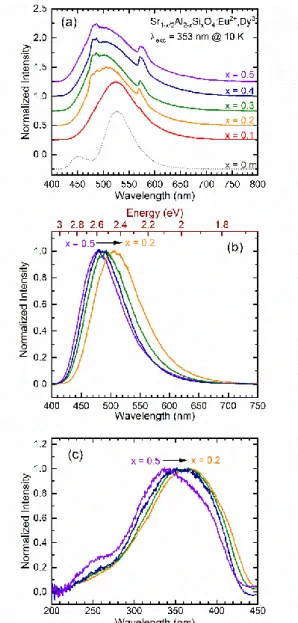
3.2. Photoluminescence properties
As previously established on monoclinic-SrAl2O4:Eu2+,Dy3+
materials elaborated via different methods, two broad PL bands arising from the two distinct Sr crystallographic sites appear at low temperature on the x = 0 sample: one blue and one green located at ca. 450 nm and 530 nm respectively (Figure 3(a)).45,53
Unlike this well studied material, the hexagonal Sr1-x/2Al 2-xSixO4:Eu2+,Dy3+ (x>0) compounds show one broad band and two
relatively narrow bands, see Figure 3(a). The main band appears much broader compared to the monoclinic material, ranging from
ca. 420 nm to 700 nm. Due to its broad shape and spectral
position, the central broad band can be related to the Eu2+
emission. This broad band evolves as x increases. Indeed, increasing the Si substitution for Al and the Sr vacancies content induces a shift of the Eu2+ signal towards higher energies. It is not surprising that the Eu2+ emission band changes with the counter cation nature (Al3+ and Si4+) as its emission arises from the 4f65d1
→ 4f7 transition and d orbitals are known to be sensitive to the
local environment, due to several effects such as crystal field splitting and centroid shift.54
To go further, photoluminescence measurements have been performed at low temperature (10 K) on Eu2+ singly doped
h-SASO samples with different compositions (x varying from 0.2 to 0.5). The Eu2+ singly doped hexagonal Sr0.95Al1.9Si0.1O4 (x = 0.1)
ceramic has not been studied here, as the glass precursor could not be prepared without Dy3+ (no single Eu-doped glass could be
formed by ADL). The resulting emission spectra, presented in Figure 3(b), exhibit a broad band with an asymmetric shape. As previous structural investigations of the h-SASO materials revealed the existence of five different Sr crystallographic sites, Eu2+ emission arising from multiple Eu2+ centers can be expected.
Actually, to compensate positively charged defects induced by Si4+
substitution for Al3+ (SiAl°), Sr vacancies (VSr’’) are formed in
selective Sr sites (two of the five different Sr sites). Therefore, it appears reasonable to observe an asymmetric broad Eu2+
emission as the Eu2+ emissions arising from emitters in different
Sr sites may overlap.
Still, a clear blue shift of the Eu2+ emission band can be clearly
seen as x increases. This blue shift may result from several effects such as the counter cation effect (Al3+ and Si4+), the effect of VSr’’
and its increase with Si content, the decrease of Eu2+ population
in specific sites. The origin of the observed blue shift will be further discussed on the basis of a semi-empirical model.
Fig. 3.(a) Normalized emission spectra (λexc = 353 nm) of hexagonal Sr 1-x/2Al2-xSixO4: 1 % Eu2+, 2 % Dy3+ (x ranging from 0.1 to 0.5) recorded at 10 K. Monoclinic SrAl2O4:Eu2+,Dy3+ emission recorded in the same conditions is also displayed for comparison. (b) Emission spectra of the Eu2+ singly doped samples recorded at 10 K plotted with energy scale. (c) RT excitation spectra of the co-doped samples.
Fig. 4. Temperature dependence of the Sr1-x/2Al2-xSixO4:Eu2+,Dy3+ normalized integrated PL intensity (λexc = 353 nm).
Journal Name ARTICLE
On the contrary, the narrow bands located at ca. 488 and 573 nm (Figure 3(a)) show the same spectral position and shape independently from the sample composition (x value). Given their shapes, spectral positions and consistency with the host, they can be attributed to Dy3+ 4f-4f transitions: 4F9/2 → 6H15/2 and 4F9/2 → 6H13/2 (488 and 573 nm respectively). In order to validate this
assumption, the Dy3+ doping content has been varied in the x = 0.5
sample (from 0 % to 5 % of Dy3+). On the resulting PL spectra (Fig.
S2), the sharp signal contribution is absent for the 0 % Dy3+
doping content but its intensity rises for the samples ranging from 0.25 % to 5 % Dy3+. It is thus reasonable to attribute the sharp
lines to Dy3+ emission. Moreover, the Dy3+ content variation
appears to have no effect on the large band related to Eu2+.
Interestingly, the intensity of the Dy3+ band tends to increase
compared to the Eu2+ emission as the Si content (x) increases. This
is in good agreement with the fact that the Eu2+ emission shifts
towards lower wavelengths with the Si-content. Indeed, due to the blue shift, the Eu2+ 4f65d → 4f7 emission is more overlapped
with the absorption bands of Dy3+6H15/2 → 4F9/2 and 6H15/2 → 4I15/2
transitions making the Eu2+ to Dy3+ energy transfer more efficient,
as schematized in Fig. S3. The apparition and increase of the Dy3+
emission peaks, combined with the Eu2+ blue shift lead to an
interesting colour change from green to light blue (for x = 0.1 and x = 0.5 respectively).
The co-doped h-SASO excitation spectra, presented in Figure 3(c), appear to be constituted of one broad band with a hump at
ca. 250 nm. It can be attributed to overlapped 4f7 → 4f65d1
excitations of Eu2+. Moreover, the excitation spectra show the
same blue shift as x increases, which can be assigned to the variation of the Eu2+ neighbourhood when Si4+ substitutes for Al3+
and creates Strontium vacancies. As several Eu2+ sites are
expected in this material, the PLE spectra of h-SASO 0.5 taken at different λem have been analysed (Fig. S4). The Eu2+ excitation
spectra recorded at different emissions (λem = 440 nm and λem =
600 nm) show very distinct shapes, evidencing that Eu2+ cations
occupy several different sites in the material. On the other hand, PLE spectrum monitoring the Dy3+ emission (λem = 744 nm (Dy3+: 4F9/2 → 6F11/2,6H9/2)) has been plotted (see the PL/PLE plot of the
x = 0.5 compound in Fig. S5). The obtained Dy3+ excitation
spectrum is nearly stackable tothe Eu2+ excitation revealing an
energy transfer from Eu2+ to Dy3+. Only very weak intensity
contribution can be found at ca. 453 nm due to the Dy3+: 6H15/2 → 4F9/2 transition. It is worth noticing that this charging band is not
observed during the luminescence excitation of Eu2+, even with
higher Dy3+ contents (Fig. S6). This reveals that no reversible
energy transfer can be observed in these materials.
To get insights on the Eu2+ excitation shift with the materials
composition, a semi-empirical model has been studied (see Supporting Information S7). In this model, the Eu2+ redshift is
explained as a combination of the crystal field splitting and the centroid shift. As previously defined by P. Dorenbos and studied in the supplementary information, the crystal field splitting in our materials should depend on the average Eu-O distances and the centroid shift on the effective Eu-O distances as well as on the spectroscopic polarizability.55–58
The evolution of the effective and average Eu-O bond distances has been calculated based on structural information gained from synchrotron powder diffraction data, but no clear evolution of this bond distances could be depicted (see Fig. S8). Using this model, the crystal field splitting, assumed to only depend on bond lengths in our system, cannot explain the observed blue shift of the excitation spectra. Besides the Eu2+
bond distances, the centroid shift variation is also dependent of the spectroscopic polarizability (αsp) that is proportional to the
inverse electronegativity value. The evolution of the spectroscopic polarizability has been studied based on the Allred-Rochow electronegativity scale (see Fig. S9) and shows a constant decrease along the solid solution, which is consistent with the observed variation toward higher energy of the centroid shift.
Experimental luminescence quenching energy determination combined with band gap theoretical calculations can be useful to
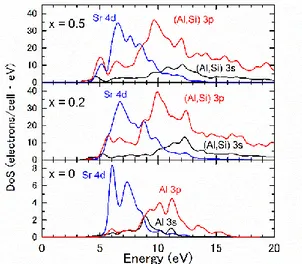
Fig. 5. Hexagonal Sr1-x/2Al2-xSixO4 density of states (from top to bottom, x = 0, 0.2 and 0.5).
Fig. 6. (a) Persistent luminescence spectra of monoclinic x = 0 (bottom) and hexagonal x = 0.1 to x = 0.5 (top) with λexc = 365 nm for 5 min. (b) CIE coordinates of the persistent emission of the Sr1-x/2Al2-xSixO4 doped with 1 % Eu2+ and 2 % Dy3+. (c) Pictures of the transparent ceramics taken after switching off the 365 nm excitation.
get insights on the evolution of the host band gap energy, and its relative position regarding the traps and recombination centres energy positions which are of major importance to study the trapping and de-trapping properties.
The thermal quenching of the Eu2+ emission, that may provide
information about the energy difference between the Eu2+ excited
state and the bottom of the conduction band, has been investigated. Figure 4 shows the integrated Eu2+ peak area of Sr 1-x/2Al2-xSixO4:Eu2+ (x ranging from 0.2 to 0.5) as a function of the
sample temperature. It can be observed that the thermal quenching decreases when x increases. Indeed, the temperature at which the emission intensity is divided by two compared to the low temperature intensity, i.e. the quenching temperature (T1/2),
varies from ca. 210 K to 295 K (for x = 0.2 to 0.5 respectively). Assuming that, as previously reported59 the relaxation towards
the conduction band is responsible for thermal quenching, the energy difference between the excited Eu2+ 5d state and the
conduction band may increase with the Si substitution for Al. Even though DFT calculations cannot provide accurate band gap energy values, it can be useful to depict a general tendency. For the hexagonal SrAl2O4 and Sr1-x/2Al2-xSixO4 materials, the
P6322 and P6̅2c space groups have been used respectively, the
related lattices are displayed in Figure 1(b) and (c). As presented in Fig. S10, along the Sr1-x/2Al2-xSixO4 solid solution, a general
decrease of the band gap energy can be obtained. Figure 5 displays the relative orbitals contribution to the conduction band versus Si content. It can be observed that in the case of pure hexagonal SrAl2O4, the bottom of the conduction band is mainly
composed of Sr 4d orbitals. Along the solid solution, an increasing contribution of (Al,Si) 3p orbitals appears. The bottom of the conduction band nature will further be used to discuss on the trap level position evolution.
3.3. Afterglow properties
Despite its interesting luminescence properties that enable to tune the Sr1-x/2Al2-xSixO4 materials emission, Dy3+ was originally
used as a co-dopant aiming at obtaining new materials with enhanced persistent luminescence properties, as it is the best co-dopant reported for this purpose regarding monoclinic SrAl2O4:Eu2+.6,7,9,11 Figure 6(a) displays the afterglow emission
spectra of h-SASO x co-doped samples. For x = 0 monoclinic material, the well-known broad green band persistent luminescence is observed. In the case of the hexagonal phase, as for x = 0.1, the signal appears broadened. Then, similarly to steady state PL, the afterglow emission shifts towards lower
wavelengths along the solid solution. Again, this shift is due to structural changes in the Eu2+ surrounding. Interestingly, while
keeping the same Dy3+ content in the materials, persistent
emission of Dy3+ is also observable. Then, in the same way as
observed for PL, the Dy3+ emission becomes more and more
pronounced as the Si content increases, in particular at 573 nm. The interesting point here is that the combination of these two phenomena leads to the afterglow colour change in the studied samples. The Eu2+ emission goes from green to blue and is
combined to the increasing Dy3+ persistent emission in a yellow
range, which overall results in a light blue persistent emission as the Si content increases. This is perfectly illustrated by the afterglow CIE (Commission Internationale de l’Eclairage) diagram reported in Figure 6(b). The observable colour shift of the materials persistent emission is displayed on the picture (see Figure 6(c)) on which the samples with x ≥ 0.4, presents light blue persistent luminescence. Therefore, the glass crystallization synthesis process appears to be of great interest for possible further developments of large-scale transparent materials with tuneable persistent luminescence properties.
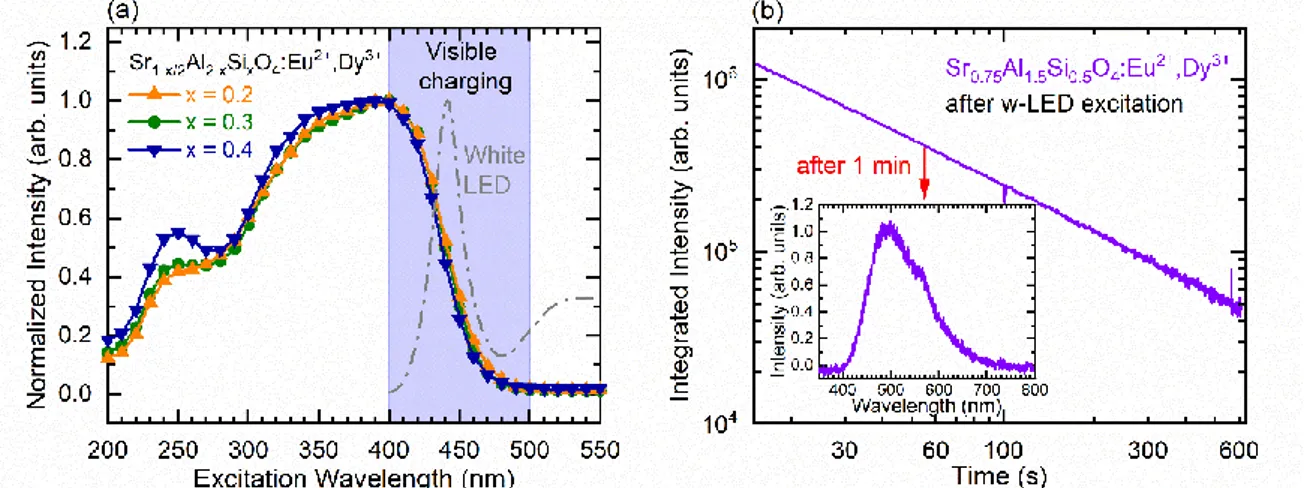
In the previous section, the persistent luminescence spectra have been recorded after charging using UV light. Afterwards, persistent excitation spectra, presented in Figure 7 (a), have been studied in order to find excitation wavelength ranges that enable persistent luminescence emission. In particular, the possibility to use visible light to charge persistent luminescence was attentively investigated. In the studied materials, all the persistent luminescence excitation spectra exhibit a large band extending up to 500 nm with a maximum at about 400 nm and a shoulder at about 250 nm. This observation reveals an interesting possible charging of the light blue persistent luminescence by exciting the transparent materials with blue light. The shape of the afterglow excitation spectra is remarkably similar to the steady state excitation spectra of the samples. Indeed, increasing x leads to a very slight blue shift of the excitation band as well as an increase of the UV band. This clearly indicates that the charging pathway goes through the Eu2+ 4f → 5d excitation bands. To evaluate the
possible visible light activation of persistent luminescence in h-SASO 0.5, persistent luminescence spectra and glow curves have been measured after one-minute excitation using a typical smartphone white LED. The integrated afterglow decay curve, as well as the related afterglow spectra, are displayed in Figure 7(b). Interestingly, the light blue afterglow remains for minutes, even after this white LED charging with relatively weak irradiation power and time. This behaviour could be of major interest for further indoor security signage applications.
Fig. 7. (a) Persistent luminescence excitation spectra (λem = 488 nm for x = 0.2 and λem = 478 nm for x > 0.2). (b) Persistent luminescence decay of the x = 0.5 sample after mobile phone w-LED charging. The persistent emission spectrum is dis-played in the inset.
Journal Name ARTICLE
The persistent luminescence decay curves of the co-doped Sr 1-x/2Al2-xSixO4 materials are displayed in Figure 8(a). Even though
the monoclinic SrAl2O4:Eu2+,Dy3+ material, prepared with the
same experimental method, shows the highest radiance decay, the decay profiles of all the samples are in a same order of magnitude. This indicates the efficient persistent luminescence properties of the Sr1-x/2Al2-xSixO4:Eu2+,Dy3+ ceramics.
Interestingly, a higher Si4+ for Al3+ substitution content leads to a
more intense persistent luminescence signal. This means that the material with the higher Si content enables a more favourable charge de-trapping at room temperature. The comparison of Eu2+
and Dy3+ persistent decays, plotted in Fig. S11, shows that the Dy3+
persistent decay follows the same slope as Eu2+. It reveals that
they might follow the same persistent luminescence mechanism. After being un-trapped, the charges may recombine on Eu2+
excited state and a partial energy transfer to Dy3+ can happen.
The most common analysis technique used to study persistent luminescence materials and charge trapping is thermoluminescence. Low temperature thermoluminescence of the studied materials are presented in Figure 8(b) and (c) while the thermoluminescence glow curves of the h-SASO x = 0.5 sample recorded after charging at 273 K and 13 K is presented in Figure S12. Comparison of the TL intensities between low and room temperature charging evidences the thermal activation of the persistent luminescence charging as previously reported58
whereas the comparison of glow curves shape gives insights on the complete trap depth distribution as seen in figure 8. Indeed, charging at 273 K, the observation of shallow traps is vanished, making difficult the full traps comparison in the different samples as expressed in figures 8(b)-(c). TL intensity of the different samples around room temperature appears to be in good agreement with their related afterglow decay curves. Looking at the TL glow curves shape reported figure 8; it can be observed that at least two kinds of traps at different depths are involved in the persistent luminescence mechanism. Indeed, for all samples, two broad bands can be distinguished. As the Si content increases, the TL bands shift towards higher temperatures, and in this case become closer to room temperature, which is of large interest from persistent luminescence applications point of view. The shift of the TL peaks towards higher temperatures reveals an increase of the activation energy of the involved traps. This means that in the classic case where electrons are trapped close to the conduction band, the energy of the lowest conduction band level should increase regarding the traps levels. This is in good agreement with the thermal quenching studied previously in samples containing different Si contents and also provides important clues for mechanism determination. The thermoluminescence glow curve of the powdered SrAl2O4:Eu2+,Dy3+ sample, obtained with the ADL method,
displayed in Fig. S13, is relatively narrow and centred around 275 K. Therefore, the involved traps are indeed less energy dispersed than those of h-SASO 0.5. These features can explain that the persistent luminescence decay of the powdered SrAl2O4:Eu2+,Dy3+
sample is initially more intense (in the first seconds) but also steeper compared to the h-SASO 0.5 one, as observed in Fig. 8 (a). Nevertheless, the role of Dy3+ in the charge trapping mechanism
is intriguing. In order to gain deeper insights on the traps nature, samples with different Dy3+ contents (from 0 % to 5 %) have been
prepared and studied in a similar way. Firstly, both TL peaks vary when the Dy3+ doping content varies. Interestingly, it is noticeable
that the two TL peaks are observable with all different Dy3+
doping contents, even when the sample is only doped by Eu2+
(single doping). As no additional peak appears when Dy3+ is
added, this means that Dy3+ should not behave as a direct trap. On
the other hand, the low temperature glow peak increases drastically when Dy3+ is added. This reveals that Dy3+ may
stabilize the shallow traps. Moreover, this low temperature glow peak appears to shift towards higher temperatures as the Dy3+
content increases. This means that the related trap depth increases when Dy3+ is added, revealing a higher energy stability
of the involved defects. This result is in agreement with the persistent luminescence mechanism proposed by Clabau et
al.9,60,61 where hypothesis of the defect nature according to the
reducing atmosphere used for samples preparation could be some oxygen vacancies. This is also in good agreement with previous works of J. Hölsä and co-workers in which experimental and theoretical results highlighted the importance of intrinsic oxygen vacancies in the room temperature persistent luminescence mechanism and the ability of RE3+ co-dopant to
increase the storage capability.62–65
In the SrAl2O4 case, the localized energy levels created by oxygen
vacancies can be seen as an empty aluminium sp3 orbital. From a
molecular orbital point of view, it can be seen as the transition
from [AlO4]5- (Td) to [AlO3]4- (C3v), leading to a splitting of the Al Fig. 8. (a) Comparison of the radiance decay curves and (b) thermoluminescence of Sr1-x/2Al2-xSixO4 transparent ceramics doped with 1%Eu2+ and 2% Dy3+ after λexc = 365 nm for 5 min at 13 K. For sake of comparison, the radiance decay curve of the monoclinic SrAl2O4 doped and prepared with the same process is presented. Notice that experiments were done on powder samples. (c) Thermoluminescence glow curves of Sr0.75Al1.5Si0.5O4:Eu2+ with different Dy3+ doping contents (0, 0.25, 0.5, 1, 2.5 and 5 %) λexc = 365 nm for 5 min at 13 K.
3p antibonding energy level, which can be seen as the LUMO.66,67
Along the solid solution, part of [AlO4]5- tetrahedron are replaced
by [SiO4]4- tetrahedron. As the Si-O bond strength is generally
larger compared to Al-O one due to its higher electronegativity, this may induce a higher energy level splitting between the 6a1*
stabilized and 4e* not stabilized level, i.e. a higher trap depth, that is indeed observed on the main trap peak position on the thermoluminescence glow curves.
On the other hand, the TL intensity of the peak close to room temperature decreases. In a practical point of view, this evidences less intense decay curves and persistent luminescence intensity when Dy3+ increases. This has been confirmed with persistent
glow curves (Fig. S14) in which the intensity of the glow curves decreases with the Dy3+ doping concentration. Still, the intensity
of the glow curves of the different samples is in the same order of magnitude, as previously observed for TL intensities. This reveals that the incorporation of more defect-stabilizing doping ion, enables slightly deeper trap depths, suitable for room temperature relaxation that can significantly improve the persistent intensity of studied transparent ceramic phosphors. This is promising insight in improving the afterglow performance of studied samples.
4. Conclusions
Transparent persistent phosphors belonging to the hexagonal Sr 1-x/2Al2-xSixO4:Eu2+,Dy3+ solid-solution were obtained by full glass
crystallization. The synthesis conditions, using (i) a double CO2
laser heating system coupled to an aerodynamic levitation to ensure glass forming and then (ii) a single heat treatment to perform full crystallization, enable to obtain transparent ceramic monoliths for a large composition range, from x = 0.1 to x = 0.5. In addition, glass formation of the Eu2+, Dy3+ co-doped
Sr0.75Al1.5Si0.5O4 composition (x = 0.5) can be achieved in a regular
commercial furnace using a platinum/rhodium crucible. It is therefore possible to scale up the process and synthesize large transparent ceramic pieces. The Sr1-x/2Al2-xSixO4:Eu2+,Dy3+
ceramics demonstrate a colour shift varying from green to light blue (from x = 0.1 to x = 0.5) from both steady state photoluminescence and persistent luminescence measurements. This colour change is assigned to a blue shift of the Eu2+ 5d → 4f
emission and to the appearance of Dy3+ emission lines. In addition
to this colour evolution, materials with increasing Si contents exhibit longer persistent decays. Persistent luminescence excitation results show that a broad range of wavelength, extending from UV to blue/green light, can effectively charge the persistent materials and that charging with low power white LEDs, as those available in mobile phones, is sufficient to observe the blueish white persistent emission for several tens of minutes. Finally, the temperature dependence of photoluminescence, thermoluminescence and DFT calculations provide insights about the evolution of the persistent luminescence properties as the Si content increases and the trap depths become deeper hence closer to optimal trap depth position for persistent luminescence.
Eu2+,Dy3+ doped Sr1-x/2.A2-xSixO4 fulfil all the three criteria
(transparency and the related volume effect, tuneable persistent luminescence, possible charging with visible light) to be suitable for night lighting applications. However, an enhancement of persistent intensity is still required to move towards commercial development, and our results suggest that promising improvements by suitable codopants can be realized.
Conflicts of interest
There are no conflicts of interest to declare.
Acknowledgements
The French Research Council is acknowledged for financial support within PSL, the ANR, ANR-18-CE08-0012 PERSIST and CNRS PICS Program. J. Xu, K. Asami and S. Tanabe acknowledge financial supports by the Grant-in-Aid for JSPS Fellows (No. 18F18051) and JSPS Grant-in-Aid for Scientific Research on Innovative Areas ‘‘Mixed anion’’ (No. JP16H6441). A. J. Fernández-Carrión thanks the National Natural Science Foundation of China (No. 21850410458) for the financial support.
References
1. Matsuzawa, T. A New Long Phosphorescent Phosphor with High Brightness, SrAl[sub 2]O[sub 4]:Eu[sup 2+],Dy[sup 3+]. Journal of
The Electrochemical Society 143, 2670 (1996).
2. Hisako Takasaki, Tanabe, S. & Hanada, T. Long-Lasting Afterglow Characteristics of Eu, Dy Codoped SrO-Al2O3 Phosphor. Journal of
the Ceramic Society of Japan 322–326 (1996).
3. Katsumata, T., Nabae, T., Sasajima, K. & Matsuzawa, T. Growth and characteristics of long persistent SrAl2O4- and CaAl2O4-based phosphors crystals by a floatting zone technique.
4. Nakanishi, T. et al. Fabrication of Eu:SrAl2O4-based glass ceramics using Frozen sorbet method. Journal of the Ceramic Society of Japan 119, 609–615 (2011).
5. Peng, T. et al. Combustion synthesis and photoluminescence of SrAl2O4:Eu,Dy phosphor nanoparticles. Materials Letters 58, 352– 356 (2004).
6. Zhang, T. & Su, Q. Rare-earth materials for use in the dark. Journal
of the Society for Information Display 8, 27 (2000).
7. Aitasalo, T. et al. Persistent luminescence phenomena in materials doped with rare earth ions. Journal of Solid State Chemistry 171, 114–122 (2003).
8. Aitasalo, T. et al. Annihilation of the persistent luminescence of MAl2O4:Eu2+ by Sm3+ co-doping. Radiation Measurements 38, 515–518 (2004).
9. Clabau, F. et al. Mechanism of Phosphorescence Appropriate for the Long-Lasting Phosphors Eu 2+ -Doped SrAl 2 O 4 with Codopants Dy 3+ and B 3+. Chemistry of Materials 17, 3904–3912 (2005). 10. Niittykoski, J. et al. Effect of boron substitution on the preparation
and luminescence of Eu2+ doped strontium aluminates. Journal of
Alloys and Compounds 374, 108–111 (2004).
11. Aitasalo, T. et al. Low temperature thermoluminescence properties of Eu2+ and R3+ doped CaAl2O4. Journal of Alloys and Compounds 380, 4–8 (2004).
12. Aitasalo, T., Hölsä, J., Jungner, H., Lastusaari, M. & Niittykoski, J. Thermoluminescence Study of Persistent Luminescence Materials: Eu 2+ - and R 3+ -Doped Calcium Aluminates, CaAl 2 O 4 :Eu 2+ ,R 3+.
The Journal of Physical Chemistry B 110, 4589–4598 (2006).
13. Korthout, K. et al. Luminescence and x-ray absorption
measurements of persistent SrAl 2 O 4 :Eu,Dy powders: Evidence for valence state changes. Physical Review B 84, (2011). 14. Ueda, J., Nakanishi, T., Katayama, Y. & Tanabe, S. Optical and
optoelectronic analysis of persistent luminescence in Eu 2+ -Dy 3+ codoped SrAl 2 O 4 ceramic phosphor: Optical and optoelectronic analysis of persistent luminescence in Eu 2+ -Dy 3+ codoped SrAl 2 O 4 ceramic phosphor. Phys. Status Solidi C 9, 2322–2325 (2012). 15. Xu, J. & Tanabe, S. Persistent luminescence instead of
phosphorescence: History, mechanism, and perspective. Journal of
Luminescence 205, 581–620 (2019).
16. Van den Eeckhout, K., Smet, P. F. & Poelman, D. Persistent Luminescence in Eu2+-Doped Compounds: A Review. Materials 3, 2536–2566 (2010).
Journal Name ARTICLE
17. Van den Eeckhout, K., Poelman, D. & Smet, P. Persistent Luminescence in Non-Eu2+-Doped Compounds: A Review.
Materials 6, 2789–2818 (2013).
18. Ueda, J., Kuroishi, K. & Tanabe, S. Yellow persistent luminescence in Ce 3+ –Cr 3+ -codoped gadolinium aluminum gallium garnet transparent ceramics after blue-light excitation. Applied Physics
Express 7, 062201 (2014).
19. Xu, J., Ueda, J., Kuroishi, K. & Tanabe, S. Fabrication of Ce3+–Cr3+ co-doped yttrium aluminium gallium garnet transparent ceramic phosphors with super long persistent luminescence. Scripta
Materialia 102, 47–50 (2015).
20. Boutinaud, P., Sarakha, L. & Mahiou, R. NaNbO 3 :Pr 3+ : a new red phosphor showing persistent luminescence. J. Phys.: Condens.
Matter 21, 025901 (2009).
21. Boutinaud, P. et al. About red afterglow in Pr 3+ doped titanate perovskites. J. Phys. D: Appl. Phys. 42, 045106 (2009). 22. Li, L. et al. Tunable Trap Depth for Persistent Luminescence by
Cationic Substitution in Pr3+:K&-xNaxNbO3 Perovskites. 2629– 2639 (2019).
23. Maldiney, T. et al. The in vivo activation of persistent
nanophosphors for optical imaging of vascularization, tumours and grafted cells. Nature Mater 13, 418–426 (2014).
24. Allix, M. et al. Considerable Improvement of Long-Persistent Luminescence in Germanium and Tin Substituted ZnGa 2 O 4.
Chemistry of Materials 25, 1600–1606 (2013).
25. Castaing, V. et al. Persistent Luminescence of ZnGa2O4:Cr3+ Transparent Glass Ceramics: Effects of Excitation Wavelength and Excitation Power. 5114–5120 (2017).
26. Pan, Z. et al. Facilitating Low-Energy Activation in the Near-Infrared Persistent Luminescent Phosphor Zn1+xGa2-xSnxO4:Cr3+ via Crystal Field Strength Modulations. 8347–8358 (2020). 27. https://www.bbc.com/news/technology-27021291.
28. https://www.huffpost.com/entry/glow-in-dark-bike-path-lane-sun-poland_n_57fd0732e4b068ecb5e1d57b.
29. Zhuang, Y., Ueda, J. & Tanabe, S. Multi-color persistent
luminescence in transparent glass ceramics containing spinel nano-crystals with Mn 2+ ions. Applied Physics Letters 105, 191904 (2014).
30. Xu, J., Tanabe, S., Sontakke, A. D. & Ueda, J. Near-Infrared Multi-Wavelenghts Long Persistent Luminescence of Nd3+ Ion Through Persistent Energy Transfer in Ce3+, Cr3+ Co-Doped Y3Al2Ga3O12 for the First and Second Bio-Imaging Windows. 081903 (2015). 31. Castaing, V. et al. Persistent Energy Transfer in ZGO:Cr3+,Yb3+ a
New Strategy to Design Nano Glass-Ceramics Featuring Deep Red and Near Infrared Persistent Luminescence. Physical Chemistry
Chemical Physics 19458–19468 (2019).
32. Gandhi, A. S., Saravanan, A. & Jayaram, V. Containerless processing of ceramics by aerodynamic levitation. Materials Science and
Engineering: A 221, 68–75 (1996).
33. Allix, M. et al. Highly Transparent BaAl 4 O 7 Polycrystalline Ceramic Obtained by Full Crystallization from Glass. Adv. Mater. 24, 5570– 5575 (2012).
34. Alahraché, S. et al. Perfectly Transparent Sr 3 Al 2 O 6 Polycrystalline Ceramic Elaborated from Glass Crystallization. Chem. Mater. 25, 4017–4024 (2013).
35. Al Saghir, K. et al. Transparency through Structural Disorder: A New Concept for Innovative Transparent Ceramics. Chem. Mater. 27, 508–514 (2015).
36. Saghir, K. A. Transparent ceramics by full crystallization from glass: application to strontium aluminosilicates. 314.
37. Boyer, M. et al. Enhanced Transparency through Second Phase Crystallization in BaAl 4 O 7 Scintillating Ceramics. Crystal Growth &
Design 16, 386–395 (2016).
38. Boyer, M. et al. Transparent polycrystalline SrREGa 3 O 7 melilite ceramics: potential phosphors for tuneable solid state lighting. J.
Mater. Chem. C 4, 3238–3247 (2016).
39. Boyer, M. et al. First transparent oxide ion conducting ceramics synthesized by full crystallization from glass. J. Mater. Chem. A 5276–5289 (2018).
40. Ma, X. et al. Pressureless glass crystallization of transparent yttrium aluminum garnet-based nanoceramics. Nat Commun 9, 1175 (2018).
41. Bertrand, A. et al. Scalable and Formable Tellurite-Based
Transparent Ceramics for Near Infrared Applications. 1482 (2016). 42. Fernandez-Carrion, A. J. et al. Local Disorder and Tunable
Luminescence in Sr 1– x /2 Al 2– x Si x O 4 (0.2 ≤ x ≤ 0.5) Transparent Ceramics. Inorganic Chemistry 56, 14446–14458 (2017). 43. Wisniewski, W., Fernández-Carrión, A. J., Schöppe, P., Rüssel, C. &
Allix, M. Oriented nucleation and crystal growth in SrO–Al 2 O 3 –SiO 2 tectosilicate glasses. CrystEngComm 20, 3455–3466 (2018). 44. Shinozaki, K., Honma, T., Affatigato, M. & Komatsu, T. Long
Afterglow in Hexagonal SrAl2O4:Eu2+ , Dy3+ Synthesized by Crystallization of Glass and Solidification of Supercooled Melts. 286–289 (2016).
45. Poort, S. H. M., Blokpoel, W. P. & Blasse, G. Luminescence of Eu2+ in barium and strontium aluminate and gallate. Chemistry of Materials 7, 1547–1551 (1995).
46. Winborne, D. A., Nordine, P. C., Rosner, D. E. & Marley, N. F. Aerodynamic levitation technique for containerless high temperature studies on liquid and solid samples. MTB 7, 711–713 (1976).
47. Weber, J. K. R. The Containerless Synthesis of Glass: The Containerless Synthesis of Glass. International Journal of Applied
Glass Science 1, 248–256 (2010).
48. Clark, S. J. et al. First principles methods using CASTEP. Zeitschrift
für Kristallographie - Crystalline Materials 220, (2005).
49. Perdew, J. P., Burke, K. & Ernzerhof, M. Generalized Gradient Approximation Made Simple. Phys. Rev. Lett. 77, 3865–3868 (1996).
50. Vanderbilt, D. Soft self-consistent pseudopotentials in a generalized eigenvalue formalism. Phys. Rev. B 41, 7892–7895 (1990). 51. Koelling, D. D. & Harmon, B. N. A technique for relativistic
spin-polarised calculations. Journal of Physics C 10, 3107 (1977). 52. Shannon, R. D. Revised Effective Ionic Radii and Systematic Studies
of Interatomic Distances in Halides and Chalcogenides. 751–767 (1976).
53. Schulze, A.-R. & Buschbaum, Hk. M. Zur Verbindungsbildung von MeO: M2O3. IV. Zur Struktur von monoklinem SrAl2O4. Zeitschrift
für anorganische und allgemeine Chemie 475, 205–210 (1981).
54. Dorenbos, P. Energy of the first 4f7→4f65d transition of Eu2+ in inorganic compounds. Journal of Luminescence 104, 239–260 (2003).
55. Dorenbos, P. Relation between Eu 2 and Ce 3 f d-transition energies in inorganic compounds. J. Phys.: Condens. Matter 15, 4797–4807 (2003).
56. Dorenbos, P. Crystal field splitting of lanthanide 4fn215d-levels in inorganic compounds. Journal of Alloys and Compounds 4 (2002). 57. Dorenbos, P., Andriessen, J. & van Eijk, C. W. E. 4 f n−1 5 d centroid
shift in lanthanides and relation with anion polarizability, covalency, and cation electronegativity. Journal of Solid State
Chemistry 171, 133–136 (2003).
58. Botterman, J., Joos, J. J. & Smet, P. F. Trapping and detrapping in SrAl 2 O 4 : Eu , Dy persistent phosphors: Influence of excitation wavelength and temperature. Phys. Rev. B 90, 085147 (2014). 59. Dorenbos, P. Thermal quenching of Eu 2+ 5d–4f luminescence in
inorganic compounds. Journal of Physics: Condensed Matter 17, 8103–8111 (2005).
60. Clabau, F. et al. On the phosphorescence mechanism in
SrAl2O4:Eu2+ and its codoped derivatives. Solid State Sciences 9, 608–612 (2007).
61. Clabau, F. et al. Fluorescence and phosphorescence properties of the low temperature forms of the MAl2Si2O8:Eu2+ (M=Ca, Sr, Ba) compounds. Journal of Solid State Chemistry 181, 1456–1461 (2008).
62. Carlson, S. et al. X-ray absorption study of rare earth ions in Sr2MgSi2O7:Eu2+,R3+ persistent luminescence materials. Optical
Materials 31, 1877–1879 (2009).
63. Hölsä, J. et al. Valence and environment of rare earth ions in CaAl2O4:Eu2+,R3+ persistent luminescence materials.
Spectrochimica Acta Part B: Atomic Spectroscopy 65, 301–305
(2010).
64. Brito, H. F. et al. Optical energy storage properties of
Sr2MgSi2O7:Eu2+,R3+ persistent luminescence materials. J Therm
65. Hölsä, J., Laamanen, T., Lastusaari, M. & Novák, P. Isolated Defects in Sr2MgSi2O7: A DFT Study. Physics Procedia 29, 76–85 (2012). 66. Clabau, F. Phosphorescence : mécanismes et nouveaux matériaux.
(2005).
67. Lecointre, A. Mécanisme de luminescence persistante de nouveaux types de marqueurs pour l’imagerie optique in vivo. (2010).