HAL Id: hal-01011243
https://hal.archives-ouvertes.fr/hal-01011243
Submitted on 30 Jun 2014
HAL is a multi-disciplinary open access
archive for the deposit and dissemination of
sci-entific research documents, whether they are
pub-lished or not. The documents may come from
teaching and research institutions in France or
abroad, or from public or private research centers.
L’archive ouverte pluridisciplinaire HAL, est
destinée au dépôt et à la diffusion de documents
scientifiques de niveau recherche, publiés ou non,
émanant des établissements d’enseignement et de
recherche français ou étrangers, des laboratoires
publics ou privés.
A QUALITY ASSESSMENT PROTOCOL FOR
FREE-VIEWPOINT VIDEO SEQUENCES
SYNTHESIZED FROM DECOMPRESSED DEPTH
DATA
Emilie Bosc, Philippe Hanhart, Patrick Le Callet, Touradj Ebrahimi
To cite this version:
Emilie Bosc, Philippe Hanhart, Patrick Le Callet, Touradj Ebrahimi.
A QUALITY
ASSESS-MENT PROTOCOL FOR FREE-VIEWPOINT VIDEO SEQUENCES SYNTHESIZED FROM
DE-COMPRESSED DEPTH DATA. Fifth International Workshop on Quality of Multimedia
Experi-ence (QoMEX), Jul 2013, Klagenfurt, Germany. pp.100-105, �10.1109/QoMEX.2013.6603218�.
�hal-01011243�
A QUALITY ASSESSMENT PROTOCOL FOR FREE-VIEWPOINT VIDEO SEQUENCES
SYNTHESIZED FROM DECOMPRESSED DEPTH DATA
Emilie Bosc
1, Philippe Hanhart
2, Patrick Le Callet
1, Touradj Ebrahimi
21
LUNAM Universit´e, Universit´e de Nantes, IRCCyN UMR CNRS 6597, Nantes, France
2
Multimedia Signal Processing Group, EPFL, Lausanne, Switzerland
ABSTRACT
In this paper, the analysis of a subjective quality experiment consisting in assessing the quality of free-viewpoint video sequences generated from decompressed depth data is pre-sented. In the absence of a dedicated subjective assessment protocol for the evaluation of such 3D systems, a subjective quality assessment methodology is proposed for the context of MVD compression. The proposed methodology includes the assessment of free-viewpoint video sequences generated from decompressed depth data and from view synthesis pro-cesses. The proposed methodology is meant to assess the per-formances of depth map compression and view synthesis al-gorithms.
Index Terms— Multiview video plus depth, quality eval-uation, view synthesis, compression, subjective assessment protocol
1. INTRODUCTION
With the growing interest for stereoscopic 3D imaging [1], the Video Coding Experts Group (VCEG) and Moving Picture Experts Group (MPEG) have joined their efforts to develop new 3D video formats and coding standards. Among the nu-merous possible 3D scene representations [2] is the multiview video plus depth (MVD) format. This format consists of mul-tiple texture views and associated depth maps acquired at dif-ferent viewpoints of the represented scene. Although the his-tory of stereoscopic video sequences dates back from the last century, the subjective quality assessment protocols that are essential to evaluate new 3D viewing systems are not stan-dardized yet. This is very likely to be due to the complexity brought by 3D and the numerous possible 3D applications. The most popular applications are 3D television (3DTV) and free-viewpoint television (FTV). 3DTV provides a depth feel-ing thanks to an appropriate 3D display. FTV allows the user to interactively control the viewpoint of the scene.
Considering the demand for high-quality visual content, the success of 3D video applications is closely related to its ability to provide viewers with a high quality level of visual experience. While many efforts have been dedicated to visual quality assessment in the last twenty years, some issues still remain unsolved in the case of 3D video. The assessment of
3D contents arises different issues:
- Quality assessment of synthesized views. 3DTV and FTV are likely to require view synthesis, which is often performed via Depth-Image-Based Rendering (DIBR). This process can induce new types of artifacts. Since view synthesis is fun-damental for both 3DTV and FTV, the quality assessment of synthesized views is crucial.
- Specific distortions in DIBR. Artifacts in DIBR are mainly geometric distortions. These distortions are different from those commonly encountered in video compression and that are assessed by usual evaluation methods. Most video coding standards rely on Discrete Cosine Transform, which results in specific artifacts (some of them are described in [3]). These artifacts are often scattered over the whole image, whereas DIBR related artifacts are mostly located around the disoc-cluded areas. Thus, since most of the usual objective quality metrics were initially designed to address specific usual dis-tortions, they may not be suitable to assess the quality of DIBR synthesized views [4, 5].
- Use case and visualization scenario. The evaluation of DIBR systems is a difficult task because the type of evalua-tion differs depending on the context of use. Different factors are involved in the different 3D imaging applications. A ma-jor discriminatory factor is the stereopsis phenomenon (the fusion process of left and right images by the human visual system), exploited by 3DTV systems. Psycho-physiological mechanisms are induced but they are not completely under-stood. An FTV application is not necessarily used in con-junction with a stereoscopic display as FTV can be watched in a 2D context. Consequently, the quality assessment proto-cols differ as they address the quality of synthesized views in two different contexts (2D and stereoscopic visualization). It is obvious that stereoscopic impairments (such as cardboard effect, crosstalk, keystone, flickering depth, picket-fence, etc. as described in [6]), which occur in stereoscopic conditions, are not assessed in 2D conditions. Also, distortions detected in 2D conditions may not be perceptible in stereoscopic con-ditions.
- Assessment factors. Depending on the use case, except for the conventional image quality, new assessment factors can be considered such as comfort, naturalness, and depth perception [7].
- Clear definition of assessment factors. Even though a training session is usually performed before each subjective quality assessment test, subjects are generally non-expert. In addition, they may not be familiar with simulated stereo-scopic viewing. Therefore, there is a risk of collecting erro-neous results due to the novelty of the media display, which may not always be taken into account in these subjective quality assessment methodologies. The assessment factors need to be clearly defined to avoid confusion during the rat-ing procedure.
- Need for no-reference metric. Another limitation of usual objective metrics concerns the need for non-reference quality metrics. In particular use cases, such as FTV, references are unavailable because the generated viewpoint is virtual. In other words, there is no ground truth allowing a full compar-ison with the distorted view. Though, assessment tools are required to evaluate the quality of the synthesized views.
The International Telecommunication Union has recently released a new recommendation, ITU-R BT.2021, for the as-sessment of stereoscopic 3DTV systems [8]. This recommen-dation is mostly an extension for 3DTV of the well known recommendation ITU-R BT.500 [9], which was established for 2D television. The recommendation includes a subset of four methods from ITU-R BT.500, namely the Single-Stimulus (SS), Double Single-Stimulus Continuous Quality Scale (DSCQS), Stimulus-Comparison (SC), and Single Stimulus Continuous Quality Evaluation (SSCQE) methods. Accord-ing to ITU-R BT.2021, the picture quality, depth quality, and visual comfort of stereoscopic imaging technologies should be assessed. However, this recommendation does not address the specific issue of synthesized views. Therefore, subjective quality assessment of 3D contents represented in the video plus depth or MVD formats, and, as a consequence, of virtual synthesized views, has been conducted according to methods used for the assessment of conventional 2D contents. For example, Hewage et al. [10] have used the Double Stimulus Continuous Quality Scale (DSCQS) method to evaluate the quality of stereoscopic video sequences that were synthesized from video plus depth video sequences. Recently, the Double Stimulus Impairment Scale (DSIS) has been used to evaluate the responses of the MPEG Call for Proposals on 3D Video Coding Technology [9]. The evaluations have been per-formed on both stereoscopic and multiview auto-stereoscopic displays. The displayed 3D contents were synthesized via DIBR from a limited number of input views represented in the MVD format.
In this paper, a subjective assessment protocol of the im-pact of depth compression on perceived image quality in a free-viewpoint television scenario is proposed. This study considers depth maps compression only (and not color view compression, as in a classical scenario) as it has been shown that depth compression has a critical impact on the quality of synthesized views. The proposed protocol is expected to enable the evaluation of different types of depth coding
dis-tortions.
In the remainder of the paper, the proposed methodology used in this case study to evaluate the performance of dif-ferent compression algorithms is presented in Section 2. In Section 3, an analysis of the obtained results, as for valida-tion of the reliability of the methodology, is given. Finally, concluding remarks are given in Section 4.
2. EXPERIMENTAL PROTOCOL
In this section, the proposed experimental protocol for assess-ing the performances of different codassess-ing methods in the con-text of MVD data compression is presented.
2.1. Material
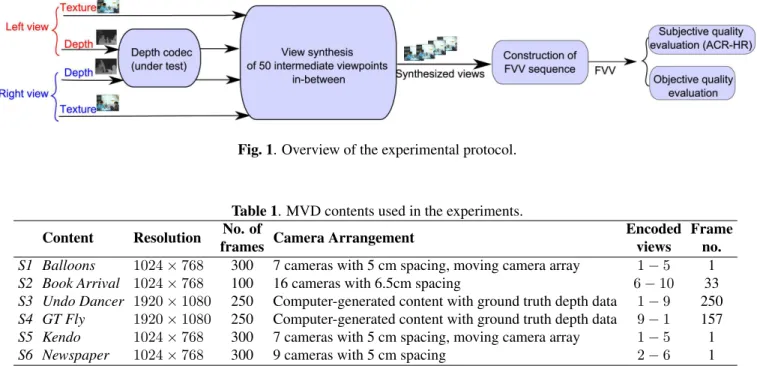
This experimental protocol involved the generation and the quality assessment of synthesized views in a FTV scenario. Only the depth maps were encoded as for an example of eval-uation of depth coding algorithms. Depth coding only is tar-geted and not color coding as in the “real” use case because the goal is to provide an assessment protocol able to under-line the impact of depth coding only on the synthesized views. The general scheme followed in this experiment is depicted in Figure 1. From a given MVD sequence, two different view-points at one time instant t (also referred to as key frames in the following) were considered. The associated depth maps were encoded through seven depth map codecs under test. From the decoded depth maps, fifty intermediate viewpoints (equally separated) were generated in-between the two con-sidered viewpoints. A sequence of 100 frames (at 10 fps) was built from the 50 intermediate virtual frames to simulate a smooth camera motion from left to right and from right to left. This experimental protocol is expected to reveal the dis-tortion specificity of each compression strategy. Depth map codecs under test are labeled from C1 to C7, where C1 to C4 are state-of-the-art coding algorithms:
- C1: 3D-HEVC Test Model, 3D-HTM 0.4 [11], inter-view prediction and View Synthesis Optimization enabled. - C2: Multiview Video Coding (MVC), JM 18.4 [12]. - C3: HEVC Test Model, HM 6.1 [13].
- C4: JPEG2000, Kakadu implementation [14].
- C5: based on [15], a lossless-edge depth map coding based on optimized path and fast homogeneous diffusion. - C6: based on [16], this algorithm exploits the correlation
with color frames.
- C7: Z-LAR-RP [17], a region-based algorithm.
All coding algorithms were used in intra coding mode. Three quantization parameters were selected for each depth map codec under test according to the visual quality of the ren-dered views. This procedure was motivated by the need to cover a wide range of categories in the visual quality scale to properly assess each codec under test. Six MVD contents
Fig. 1. Overview of the experimental protocol.
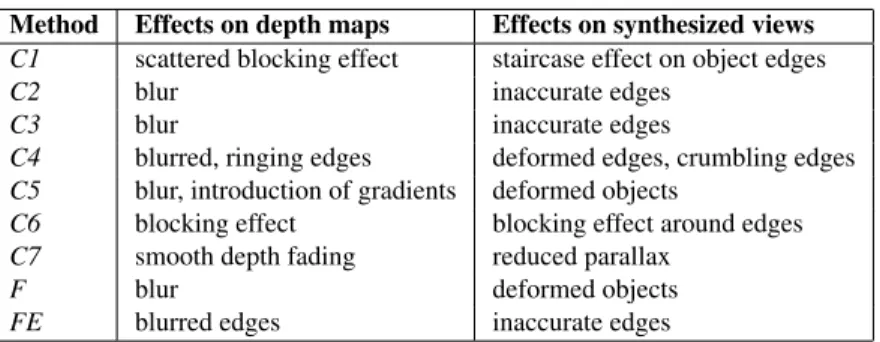
Table 1. MVD contents used in the experiments.
Content Resolution No. of Camera Arrangement Encoded Frame
frames views no.
S1 Balloons 1024 × 768 300 7 cameras with 5 cm spacing, moving camera array 1 − 5 1 S2 Book Arrival 1024 × 768 100 16 cameras with 6.5cm spacing 6 − 10 33 S3 Undo Dancer 1920 × 1080 250 Computer-generated content with ground truth depth data 1 − 9 250 S4 GT Fly 1920 × 1080 250 Computer-generated content with ground truth depth data 9 − 1 157 S5 Kendo 1024 × 768 300 7 cameras with 5 cm spacing, moving camera array 1 − 5 1 S6 Newspaper 1024 × 768 300 9 cameras with 5 cm spacing 2 − 6 1
were used in these experiments: Book Arrival, Newspaper, Kendo, and Balloons are real scenes; and GT Fly and Undo Dancerare synthetic scenes. The characteristics of the con-tents are summarized in Table 1. The concon-tents and the key frames were selected for their availability and amount of depth. The encoded viewpoints are given in Table 1. Two additional methods were also included to increase the vari-ety of distortions: low pass filtered depth maps (noted F) and depth maps with low-pass filtered applied on edges only (noted FE). Table 2 provides our observations regarding the specific distortions of each method, when using a coarse quantization. First column indciates the effects of coarse compression on depth maps. Second column indicates the re-sulting effects on views synthesized from this decompressed depth data. The depth compression related artifacts mostly affect the strong depth gradients (object edges) which results in flickering around the object edges in the synthesized se-quence. Two different synthesis modes were considered. The synthesis process was performed through the 3D-HTM 0.4 renderer, also referred to as VSRS-1D-Fast, which is the view synthesis algorithm used by the Joint Collaborative Team on 3D Video Coding Extension Development (JCT-3V) at the time of writing this paper. Two different modes for the view synthesis, referred to as VS1 and VS2 in the rest of the paper, were considered:
- VS1: Blended Mode disabled. All pixels visible in the closer reference view are copied to the virtual view, and only hole areas are filled from the farther reference view. - VS2: Blended Mode enabled. A weighted blending based
on the baseline distance is used for hole filling. So pixels from the reference camera that are closer to the virtual view are assigned a higher weight.
2.2. Assessment conditions
The ACR-HR [18] methodology was used to assess 276 FVV sequences. The ACR-HR methodology [18] consists in pre-senting each stimulus only once to the observers, who are asked to rate the quality of the stimuli using a five-level qual-ity scale (5: Excellent; 4: Good; 3: Fair; 2: Poor; 1: Bad). The reference version of each stimulus is included in the test procedure and rated like any other stimulus. This is referred to as a “hidden reference condition”. The subjective evaluations were conducted in an ITU conforming test environment. The stimuli were displayed on a Panasonic BT-3DL2550 screen (1920×1080p), and according to ITU-T BT.500 [9]. Twenty-seven naive observers participated in the subjective quality evaluation test into two 30-minutes sessions. All subjects un-derwent a screening to examine their visual acuity, color vi-sion, and stereo vision. Four subjects were detected as out-liers and all their scores were removed from the results.
3. RESULTS
In this section, the results of statistical analyses of the ob-tained subjective scores are provided. Mean opinion scores (MOS) and differential mean opinion score (DMOS) were computed between each stimulus and its corresponding (hid-den) reference. As recommended in VQEG multimedia Test Plan [19], the DMOS were computed on a per subject per processed stimulus (PS) basis. The corresponding reference version of the stimulus (SRC) was used to compute an off-set version of the DMOS value for each PS following the expres-sion:
Method Effects on depth maps Effects on synthesized views C1 scattered blocking effect staircase effect on object edges
C2 blur inaccurate edges
C3 blur inaccurate edges
C4 blurred, ringing edges deformed edges, crumbling edges C5 blur, introduction of gradients deformed objects
C6 blocking effect blocking effect around edges C7 smooth depth fading reduced parallax
F blur deformed objects
FE blurred edges inaccurate edges
Table 2. Impact of coarse quantization on data quality.
Since it can be difficult to interpret in details the DMOS values, we suggest to rely on statistical tools for further under-standing. From the raw subjective scores, a statistical analy-sis was performed using principal component analyanaly-sis (PCA) and analysis of variance (ANOVA). Indeed, the ANOVA al-lows to know if differences between the means of the con-sidered groups are significant (i.e., due to influence of view synthesis mode, content features, or compression algorithm) or simply due to chance. The goal of the PCA is to express the pattern of similarity of the observations (i.e., compression al-gorithm generating the same perceived quality, etc.) as points in maps. The results of the PCA are shown in Figure 2 to Fig-ure 4. In these figFig-ures, each point represent a stimulus. The points in Figure 2, Figure 3, and Figure 4 have different colors according to the view synthesis mode, content, and depth map compression algorithm, respectively. The first two compo-nents of the PCA resumed59.6% of the total inertia, i.e., the total variance of the dataset (the first axis resumed 54.1% of the total inertia with an eigenvalue of 12.44 while the second resumed 5.53% of the total inertia with an eigenvalue of 1.27). Our observations showed that the stimuli obtaining the lowest DMOS (left part) are opposed to those obtaining the highest DMOS (right part). The confidence ellipses for the popula-tion means are plotted for each category. These confidence ellipses are plotted to visualize the variability of the popu-lation means (i.e., the centers of gravity). Non-overlapping ellipses indicate that groups are significantly different. The results are discussed in the following subsections.
3.1. View synthesis modes
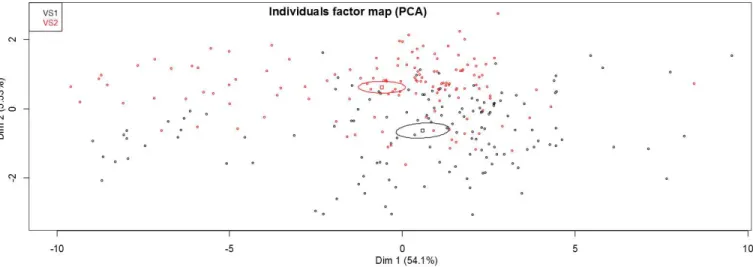
The individual factor map from the PCA according to the view synthesis mode is shown in Figure 2. The confidence el-lipses indicate whether the categories (VS1 and VS2) are sig-nificantly different from each other. It can be observed that although the ellipses centroids are close to each other, they are diametrically opposed. VS1’s ellipse centroid is located in the right part of the graph, which indicates that VS1 generally obtained higher DMOS values and thus the perceived quality was higher. These results show that the proposed assessment methodology allows the evaluation of different view synthesis algorithms.
3.2. Content characteristics
The individual factor map from the PCA according to the content is shown in Figure 3. A clear distinction between Undo Dancer and the other contents of the dataset can be observed. The ellipse centroid is located in the left part of the graph, which indicates that Undo Dancer generally ob-tained the lowest DMOS values. This content was computer-generated and contains a human being dancing. Therefore, it was assumed that subjects are sensitive to human beings rep-resentations and may rate sequences with low scores if these representations are not realistic enough. In fact, in the con-sidered content, the motion of the human body may not be faithful enough even in the original sequence. So, a bias may have been introduced by these conditions. The importance of content selection choices when evaluating visual quality is pointed out by this observation.
The results of the ANOVA are given in Table 3. Contents Ballonsand Kendo have equal means according to ANOVA and it can be also observed that their confidence ellipses cross each other on the PCA plot (see Figure 3). Contents GT Fly and Newspaper have equal means according to ANOVA.
Table 3. Results of the ANOVA test. p-value: 0 - F-value: 491.41 - Legend:↑: superior, ↓: inferior, o: statistically equivalent. Reading: Line “1” is statistically superior to column “2”.
S1 S2 S3 S4 S5 S6 S1 ↑ ↑ ↓ o ↓ S2 ↓ ↑ ↓ ↓ ↓ S3 ↓ ↓ ↓ ↓ ↓ S4 ↑ ↑ ↑ ↑ o S5 o ↑ ↑ ↓ ↓ S6 ↑ ↑ ↑ o ↑
3.3. Depth map coding algorithms
The individual factor map from the PCA according to the depth map compression algorithm is shown in Figure 4. The location of the ellipses centroid can provide a ranking of the methods performances, based on the PCA: the location of C7 centroid suggests that the artifacts induced by C7 were the less disturbing ones. The results of the ANOVA are given in
Fig. 2. PCA plot with graphical emphasis on the view synthesis modes.
Fig. 3. PCA plot with graphical emphasis on the sequences.
Table 4 to improve the interpretation of the results. C1 is sta-tistically equivalent to state-of-the-art coding algorithms (C2 to C4). C6 and C7, which are based on the same scheme ba-sis, obtain similar means. An interesting remark lies in the fact that FE obtains equal means compared to three state-of-the-art methods (C1, C2, and C4) and to C5, which suggests that the artifacts induced by FE were rated similarly to these methods. These results show that the proposed experimental protocol (assessment of FVV generated from decompressed depth data) allows the evaluation of different depth map com-pression algorithms.
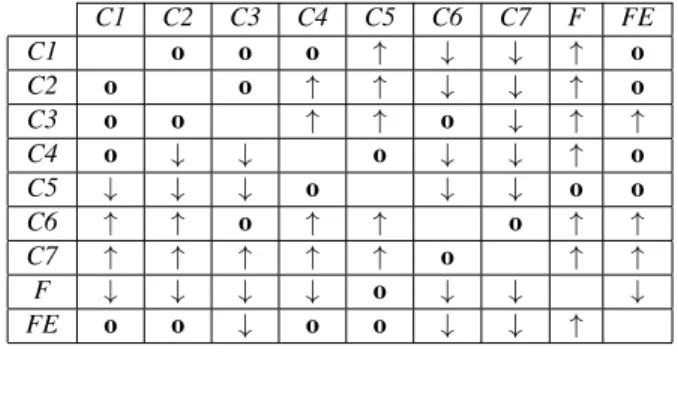
Table 4. Results of the ANOVA test. p-value: 2.39×10−56
- F-value: 36.07 -Legend:↑: superior, ↓: inferior, o: statistically equivalent. Reading: Line “1” is statistically superior to column “5”.
C1 C2 C3 C4 C5 C6 C7 F FE C1 o o o ↑ ↓ ↓ ↑ o C2 o o ↑ ↑ ↓ ↓ ↑ o C3 o o ↑ ↑ o ↓ ↑ ↑ C4 o ↓ ↓ o ↓ ↓ ↑ o C5 ↓ ↓ ↓ o ↓ ↓ o o C6 ↑ ↑ o ↑ ↑ o ↑ ↑ C7 ↑ ↑ ↑ ↑ ↑ o ↑ ↑ F ↓ ↓ ↓ ↓ o ↓ ↓ ↓ FE o o ↓ o o ↓ ↓ ↑ 4. CONCLUSION
In this paper, a subjective quality assessment methodology for evaluating 3D-systems performance in the context of MVD compression was presented. In particular, the proposed methodology includes the assessment of free-viewpoint video sequences generated from decompressed depth data and from view synthesis processes. The generated free-viewpoint video sequences were rated according to an ACR-HR protocol. This experimental protocol was expected to reveal the distortion specificity of each compression strategy. Though only image quality was rated in this case study, the analysis of the results of this case study showed that the proposed protocol can be considered as a reliable quality assessment methodology for the evaluation of depth map compression and view synthe-sis algorithms. To extend our work, this methodology will be applied for evaluating other quality factors brought by 3D in future investigations. The proposed protocol could be also extended to stereoscopic viewing conditions through the assessment of stereoscopic free-viewpoint video sequences.
5. ACKNOWLEDGMENTS
This work is supported by the French ANR-PERSEE project no ANR-09-BLAN-0170 and the Swiss National Founda-tion for Scientific Research (FN 200021-143696-1). We also would like to thank the first Qualinet Summer School for giving us the opportunity to carry out this study.
6. REFERENCES
[1] A. Kubota, A. Smolic, M. Magnor, M. Tanimoto, T. Chen, and C. Zhang, “Multiview imaging and 3DTV,” IEEE Signal Pro-cessing Magazine, vol. 24, no. 6, pp. 10, 2007.
[2] A. Smolic, K. Mueller, N. Stefanoski, J. Ostermann, A. Gotchev, G. B Akar, G. Triantafyllidis, and A. Koz, “Coding algorithms for 3DTV-a survey,” IEEE transactions on circuits and systems for video technology, vol. 17, no. 11, pp. 1606– 1620, 2007.
[3] M. Yuen and H. R. Wu, “A survey of hybrid MC/DPCM/DCT video coding distortions,” Signal Processing, vol. 70, no. 3, pp. 247–278, 1998.
[4] P. Hanhart and T. Ebrahimi, “Quality assessment of a stereo pair formed from decoded and synthesized views using objec-tive metrics,” in 3DTV-Conference: The True Vision - Capture, Transmission and Display of 3D Video (3DTV-CON), 2012. [5] E. Bosc, R. Pepion, P. Le Callet, M. Koppel, P. Ndjiki-Nya,
M. Pressigout, and L. Morin, “Towards a new quality metric for 3-d synthesized view assessment,” IEEE Journal of Se-lected Topics in Signal Processing, vol. 5, no. 7, pp. 1332– 1343, Nov. 2011.
[6] M Meesters, W Ijsselsteijn, and P Seuntiens, “A survey of perceptual evaluations and requirements of three dimensional TV,” IEEE Transactions on Circuits And Systems for Video Technology, vol. 14, no. 3, pp. 381–391, Mar. 2004.
[7] W. Chen, J. Fournier, M. Barkowsky, and P. Le Callet, “Quality of experience model for 3DTV,” San Francisco, California, USA, Jan. 2012.
[8] ITU-T BT.2021, “Subjective methods for the assessment of stereoscopic 3DTV systems,” International Telecommunica-tion Union, Aug. 2012.
[9] ITU-T BT.500, “Methodology for the subjective assessment of the quality of television pictures,” International Telecommuni-cation Union, Jan. 2012.
[10] C.T.E.R. Hewage, S.T. Worrall, S. Dogan, S. Villette, and A.M. Kondoz, “Quality evaluation of color plus depth map-based stereoscopic video,” IEEE Journal of Selected Topics in Signal Processing, vol. 3, no. 2, pp. 304–318, Apr. 2009.
[11] 3D-HTM [Online]. http://hevc.hhi.fraunhofer.de/. [12] JM [Online]. http://iphome.hhi.de/suehring/tml/. [13] HM [Online]. http://hevc.hhi.fraunhofer.de/. [14] Kakadu [Online]. http://www.kakadusoftware.com/.
[15] J. Gautier, O. Le Meur, and C. Guillemot, “Efficient depth map compression based on lossless edge coding and diffusion,” in Picture Coding Symposium (PCS), 2012, pp. 81–84.
[16] F. Pasteau, C. Strauss, M. Babel, O. D´eforges, and L. B´edat, “Adaptive colour decorrelation for predictive image codecs,” Proc. of EUSIPCO 2011, pp. 1–5, 2011.
[17] E. Bosc, Compression of Multi-View-plus-Depth (MVD) data: from perceived quality analysis to MVD coding tools design-ing, Ph.D. thesis, INSA de Rennes, Oct. 2012.
[18] ITU-T P.910, “Subjective video quality assessment methods for multimedia applications,” International Telecommunica-tion Union, April 2008.
[19] VQEG, “Final report from the video quality experts group on the validation of objective models of multimedia qualiy assess-ment, phase 1,” 2008.