Publisher’s version / Version de l'éditeur:
Vous avez des questions? Nous pouvons vous aider. Pour communiquer directement avec un auteur, consultez la première page de la revue dans laquelle son article a été publié afin de trouver ses coordonnées. Si vous n’arrivez pas à les repérer, communiquez avec nous à [email protected]. Questions? Contact the NRC Publications Archive team at
[email protected]. If you wish to email the authors directly, please see the first page of the publication for their contact information.
https://publications-cnrc.canada.ca/fra/droits
L’accès à ce site Web et l’utilisation de son contenu sont assujettis aux conditions présentées dans le site LISEZ CES CONDITIONS ATTENTIVEMENT AVANT D’UTILISER CE SITE WEB.
Conference on Empirical Methods in Natural Language Processing (EMNLP
2005) [Proceedings], 2005
READ THESE TERMS AND CONDITIONS CAREFULLY BEFORE USING THIS WEBSITE.
https://nrc-publications.canada.ca/eng/copyright
NRC Publications Archive Record / Notice des Archives des publications du CNRC :
https://nrc-publications.canada.ca/eng/view/object/?id=9a85aa3d-1412-49f9-a03e-af0ea3c260f9 https://publications-cnrc.canada.ca/fra/voir/objet/?id=9a85aa3d-1412-49f9-a03e-af0ea3c260f9
NRC Publications Archive
Archives des publications du CNRC
This publication could be one of several versions: author’s original, accepted manuscript or the publisher’s version. / La version de cette publication peut être l’une des suivantes : la version prépublication de l’auteur, la version acceptée du manuscrit ou la version de l’éditeur.
Access and use of this website and the material on it are subject to the Terms and Conditions set forth at
Semantic Similarity for Detecting Recognition Errors in Automatic
Speech Transcripts
National Research Council Canada Institute for Information Technology Conseil national de recherches Canada Institut de technologie de l'information
Semantic Similarity for Detecting
Recognition Errors in Automatic Speech
Transcripts *
Inkpen, D., and Désilets, A.
October 2005
* published at the Conference on Empirical Methods in Natural Language Processing (EMNLP 2005). October 6-8, 2005. Vancouver, British Columbia, Canada. NRC 48278.
Copyright 2005 by
National Research Council of Canada
Permission is granted to quote short excerpts and to reproduce figures and tables from this report, provided that the source of such material is fully acknowledged.
Semantic Similarity for Detecting Recognition Errors in Automatic
Speech Transcripts
Diana Inkpen
Alain Désilets
School of Information Technology and Engineering Institute for Information Technology University of Ottawa National Research Council of Canada Ottawa, ON, K1N 6H5, Canada Ottawa, ON, K1AOR6, Canada
[email protected] [email protected]
Abstract
Browsing through large volumes of spoken audio is known to be a challenging task for end users. One way to alleviate this prob-lem is to allow users to gist a spoken audio document by glancing over a transcript generated through Automatic Speech Rec-ognition. Unfortunately, such transcripts typically contain many recognition errors which are highly distracting and make gist-ing more difficult. In this paper we present an approach that detects recognition errors by identifying words which are semantic outliers with respect to other words in the transcript. We describe several variants of this approach. We investigate a wide range of evaluation measures and we show that we can significantly reduce the number of errors in content words, with the trade-off of losing some good content words.
1
Introduction
Spoken audio documents are becoming more and more common place due to the rising popularity of technologies such as: video and audio conferenc-ing, video web-casting and digital cameras for the consumer market. Unfortunately, speech docu-ments are inherently hard to browse because of their transient nature. For example, imagine trying to locate the audio segment in the recording of a 60-minute meeting, where John talked about pro-ject X. Typically, this would require fast forward-ing through the audio by some amount, then listening and trying to remember if the current
ment was spoken before or after the desired seg-ment, then fast-forwarding or backtracking by a small amount, and so on.
One way to make audio browsing of audio docu-ments more efficient is to allow the user to navi-gate through a textual transcript that is cross-referenced with corresponding time points into the original audio (Nakatani et al. 1998; Hirschberg et
al. 1999). Such transcripts can easily be produced with Automatic Speech Recognition (ASR) sys-tems today. Unfortunately, such transcripts typi-cally contain recognition errors that make them hard to browse and understand. Although Word Error Rates (WER) of the order of 20% can be achieved for broadcast quality audio, the WER for more common situations (ex: less-than-broadcast quality recordings of meetings) is typically in the order of 50% or more.
The work we present in this paper aims at auto-matically identifying recognition errors and remov-ing them from the transcript, in order to make gisting and browsing of the corresponding audio more efficient. For example, consider the follow-ing portion of a transcript that was produced with the Dragon NaturallySpeaking speech recognition system from the audio of a meeting:
“Weenie to decide quickly whether local for large expensive plasma screen aura for a bunch of smaller and cheaper ones and Holland together”
Now consider the following filtered transcript where recognition errors were automatically blot-ted out using our proposed algorithm:
“ ... to decide quickly whether ... large expensive plasma screen ... for a bunch of smaller and cheaper ones and ... together”
We believe that transcripts like this second one may be more efficient for gisting and browsing the
content of the original audio whose correct
tran-script is:
“We need to decide quickly whether we will go for a large expensive plasma screen or for a bunch of smaller and cheaper ones and tile them together.”
Our approach to filtering recognition errors is to identify semantic outliers. By this, we mean words that do not cohere well semantically with other words in the transcript. More often than not, such outliers turn out to be mistranscribed words. We present several variants of an algorithm for identifying semantic outliers, and evaluate them in terms of how well they are able to filter out recog-nition errors.
2
Related Work
Hirschberg et al. (1999), and Nakatani et al. (1998) proposed the idea of using automatic transcripts for gisting and navigating audio documents. Text-based summarization techniques on automatic speech transcription have also been used. For ex-ample, the method of Désilets et al. (2001) was found to produce accurate keyphrases for transcrip-tions with Word Error Rates (WER) in the order of 25%, but performance was less than ideal for tran-scripts with WER in the order of 60%. With such transcripts, a large proportion of the extracted key-phrases included serious transcription errors. Ink-pen and Désilets (2004) presented an experiment that filters out errors in keywords extracted from speech, by identifying the keywords that are not semantically close to the rest of the keywords.
Semantic similarity measures were used for many tasks. Two examples are: real-word error correction (Budanitsky and Hirst, 2000) and an-swering synonym questions (Turney, 2001), (Jarmasz and Szpakowicz, 2003).
There is a lot of research on confidence meas-ures for identifying errors in speech recognition output. Most papers on this topic use information that is internal to the ASR system, generated by the decoder during the recognition process. Examples are likelihood ratios derived by a Viterbi decoder (Gillick et al., 1997), measures of competing words at a word boundary (Cox and Rose, 1996), word score densities in N-best lists, and various acoustic and phonetic features. Machine learning techniques were used to identify the best combina-tions of features for classification (Chase, 1997) (Schaaf and Kemp, 1997) (Ma et al., 2001)
(Skantze and Edlund, 2004) (Zhou and Meng, 2004) (Zhou et al., 2005). Some of these methods achieve good performance, although they use dif-ferent test sets and report difdif-ferent evaluation measures from the set we enumerate in Section 6.
In our work, we use information that is external to the ASR system, because new knowledge seems likely to help in the detection of semantic outliers. In this respect, the work of Cox and Dasmahapatra (2000) is closest to ours. They compared the accu-racy of a measure based on Latent Semantic Analysis (LSA) (Landauer and Dumais, 1997) to an ASR-based confidence measure, and found that the ASR-based measure (using N-best lists) outper-formed the LSA approach. While the N-best lists approach was better at the high-Recall end of the spectrum, the LSA was better at the high-Precision end. They also showed that a hybrid combination of the two approaches worked best. Our work is similar to the LSA-based part of Cox and Dasma-hapatra, except that we use Point-wise Mutual
Information (PMI) instead of LSA. Because PMI
scales up to very large corpora, it has been shown to work better than LSA for assessing the semantic similarity of words (Turney, 2001). Another dis-tinguishing feature is that Cox and Dasmahapatra only looked at transcripts with moderate WER, whereas we additionally evaluate the technique for the purpose of doing error filtering on transcripts with high WER, which are more typical of non-broadcast conversational audio.
3
The Data
We evaluated our algorithms on a randomly se-lected subset of 100 stories from the TDT2 English Audio corpus. We conducted experiments with two types of automatically-generated speech tran-scripts. The first ones were generated by the NIST/BBN time-adaptive speech recognizer and have a moderate WER (27.6%), which is represen-tative of what can be obtained with a speaker-independent ASR system tuned for the Broadcast News domain. In the rest of this paper, we refer to these moderate accuracy transcripts as the BBN
dataset. The second set of transcripts was obtained
using the Dragon NaturallySpeaking speaker-dependent recognizer. Their WER (62.3%) was much higher because the voice model was not trained for speaker-independent broadcast quality audio. These transcripts approximate the type of
high WER seen in more casual less-than-broadcast quality audio. We refer to these transcripts as the
Dragon dataset.
4
The method
Our algorithm tries to detect recognition errors by identifying and filtering semantic outliers in the transcripts. In other words, it declares as recogni-tion errors all the words with low semantic similar-ity to other words in the transcript. The algorithm focuses on content words, i.e., words that do not appear in a list of 779 stopwords (including closed-class words, such as prepositions, articles, etc.). The reason to ignore stopwords is that they tend to co-occur with most words, and are therefore se-mantically coherent with most words. The basic algorithm for determining if a word w is a recogni-tion error is as follows.
1. Compute the neighborhood N(w) of w as the
set of content words that occur before and after w in a context window (including w itself).
2. Compute pair-wise semantic similarity scores
S(wi, wj) between all pairs of words wi ≠ wj
(in-cluding w) in the neighborhood N(w), using a se-mantic similarity measure. Scale up those S(wi, wj)
by a constant so that they are all non-negative, and the smallest one is 0.
3. For each wi in the neighborhood N(w)
(includ-ing w), compute its semantic coherence SC(wi).
by “aggregating” the pair-wise semantic similari-ties S(wi, wj) of wi with all its neighbors (wi≠ wj)
into a single number.
4. Let SCavg be the average of SC(wi) over all wi in
the neighborhood N(w).
5. Label w as a recognition error if SC(w) <
K·SCavg, where K is a parameter that allows us to
control the amount of error filtering (K% of the average semantic coherence score). Low values of K mean little error filtering and high values of K mean a lot of error filtering.
We tested a number of variants of Steps 1-3. For Step 1, we experimented with two ways of com-puting the neighborhood N(w). The first approach was to set N(w) to be all the words in the transcript (the All variant). The second neighborhood ap-proach was to set N(w) to be the set of 10 content
words before and after w in the transcript (the
Window variant).
For Step 2 we experimented with two different measures for evaluating the pair-wise semantic similarities S(wi, wj). The first measure used a
hand-crafted dictionary (the Roget variant) whereas the second one used a statistical measure based on a large corpus (the PMI variant).
For Step 3 we experimented with different schemes for “aggregating” the pair-wise semantic similarities S(wi, wj) into a single semantic
coher-ence number SC(wi) for a given word wi. The first
aggregation scheme was simply to average the SC(wi) values (the AVG variant). Note that with
this scheme, we filter words that do not cohere well with all the words in the neighborhood N(w). This might be too aggressive in the case of the All variant, especially for longer or multi-topic audio documents. Therefore, we investigated other ag-gregation schemes that only required words to co-here well with a subset of the words in N(w). The second aggregation scheme was to set SC(wi) to
the value of the most similar neighbor in N(w) (the
MAX variant). The third aggregation scheme was
to set SC(wi) to the average of the 3 most similar
neighbors in N(w) (the 3MAX variant).
Thus, there are altogether 2x2x3 = 12 possible configurations of the algorithm. In the rest of this paper, we will refer to specific configurations us-ing the followus-ing namus-ing scheme:
Step1Variant-Step2Variant-Step3Variant. For example,
All-PMI-AVG means the configuration that uses the All variant of Step 1, the PMI variant of Step 2, and the AVG variant of step 3.
It is worth noting that all configurations of this algorithm are computationally intensive, mainly because of Step 2. However, since our aim is to provide transcripts for browsing audio recordings, we do not have to correct errors in real time.
5
Choosing a semantic similarity measure
Semantic similarity refers to the degree with which two words (two concepts) are related. For example, most human judges would agree that paper and
pencil are more closely related than car and
toothbrush. We use the term semantic similarity in this paper in a more general sense of semantic
re-latedness (two concepts can be related by their context of use without necessarily being similar).
There are three types of semantic similarity measures: dictionary-based (lexical taxonomy structure), corpus-based, and hybrid. Most of the dictionary-based measures use path length in WordNet – for example (Leacock and Chodorow, 1998), (Hirst and St-Onge, 1998). The corpus-based measures use some form of vector similarity. The cosine measure uses frequency counts in its vectors and cosine to compute similarity; the sim-pler methods use binary vectors and compute coef-ficients such as: Matching, Dice, Jaccard, and Overlap. Examples of hybrid measures, based on WordNet and small corpora, are: Resnik (1995), Jiang and Conrath (1997), Lin (1998). All diction-ary-based measures have the disadvantage of lim-ited coverage: they cannot deal with many proper names and new words that are not in the diction-ary. For WordNet-based approaches, there is the additional issue that they tend to work well only for nouns because the noun hierarchy in WordNet is the most developed. Also, most of the WordNet-based measures do not work for words with differ-ent part-of-speech, with small exceptions such as the extended Lesk measure (Banerjee and Peder-sen, 2003).
We did a pre-screening of the various semantic similarity measures in order to choose the one measure of each type (dictionary-based and cor-pus-based) that seemed most promising for our task of detecting semantic outliers in automatic speech transcripts. The dictionary-based ap-proaches that we evaluated were: the WordNet-based measure by Leacock and Chodorow (1987), and one other dictionary-based measure that uses the Roget thesaurus. The Roget measure (Jarmasz and Szpakowicz, 2003) has the advantage that it works across part-of-speech. The corpus-based measures we evaluated were: (a) the cosine meas-ure based on word co-occurrence vectors (Lesk, 1969), (b) a new method that computes the Pearson correlation coefficient of the co-occurrence vectors instead of the cosine, and (c) a measure based on point-wise mutual information. We computed the first two measures on the 100-million-words Brit-ish National Corpus (BNC)1, and the third one on a much larger-corpus of Web data (one terabyte) accessed through the Waterloo Multitext system (Clarke and Terra, 2003). The reason for using corpora of different sizes is that PMI is the only
1
http://www.natcorp.ox.ac.uk/index.html
one of the three corpus-based approaches that scales up to a terabyte corpus.
We describe here in detail the PMI corpus-based measure, because it is the most important for this paper. The semantic similarity score between two words w1 and w2 is defined as the probability of
seeing the two words together divided by the prob-ability of each word separately: PMI(w1,w2) = log
[P(w1,w2) / (P(w1)·P(w2))] = log [C(w1,w2)⋅N /
(C(w1)⋅C(w2))], where C(w1,w2), C(w1), C(w2) are
frequency counts, and N is the total number of words in the corpus. Such counts can easily and efficiently be retrieved for a terabyte corpus using the Waterloo Multitext system.
In order to assess how well the semantic similar-ity measures correlate with human perception, we use the set of 30 word pairs of Miller and Charles (1991), and the 65 pairs of Rubenstein and Goode-nough (1965). Both used humans to judge the simi-larity. The Miller and Charles pairs were a subset of the Rubenstein and Goodenough pairs. Note that both of those sets were limited to nouns that ap-peared in the Roget thesaurus, and they are there-fore favorably biased towards dictionary-based approaches. Table 1 shows the correlation of 5 similarity measures for the Rubenstein and Goode-nough (R&G) and Miller and Charles (M&C) data-set. Note that although there are many WordNet-based semantic similarity measures, we only show correlations for Leacock and Chodorow (L&C) because it was previously shown to be better corre-lated (Jarmasz and Szpakowicz, 2003). We do not show figures for hybrid measures either because the same study showed L&C to be better.
Table 1: Correlation between human assigned and various machine assigned semantic similarity scores.
Dictionary-based Corpus-based
L&C Roget Cos. Corr. PMI
M&C 0.821 0.878 0.406 0.438 0.759
R&G 0.852 0.818 0.472 0.517 0.746
We see that the WordNet-based L&C measure based (Leacock and Chodorow, 1998 and the Ro-get measure (Jarmasz and Szpakowicz, 2003) both achieve high correlations but the two vector cor-pus-based measures (Cosine and Pearson Correla-tion) achieve much lower correlation. The only corpus-based measure that does well is PMI, probably because of the much larger corpus.
We decided to experiment with two of the meas-ures (one corpus-based and one thesaurus based) for computing the semantic similarity of word pairs in Step 2 of the algorithm described in Sec-tion 3. The two measures are: PMI computed on the Waterloo terabyte corpus and the Roget-based measure. These two seem the most promising given the nature of our task and the correlation fig-ures reported above.
6
Evaluation Measures
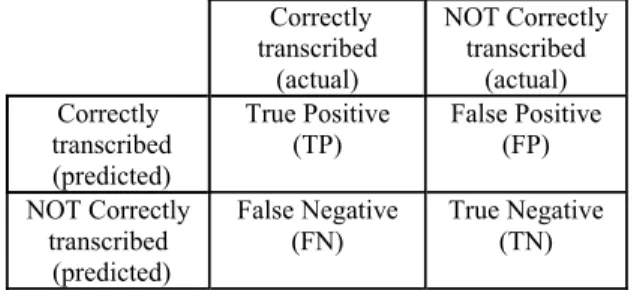
We use several evaluation measures to determine how well our algorithm works for identifying se-mantic outliers. As summarized in Table 2, the task of detecting recognition errors can be viewed as a classification task. For each word, the algorithm must predict whether or not that word was tran-scribed correctly.
Table 2: Recognition error detection can be seen as a classifi-cation task. Correctly transcribed (actual) NOT Correctly transcribed (actual) Correctly transcribed (predicted) True Positive (TP) False Positive (FP) NOT Correctly transcribed (predicted) False Negative (FN) True Negative (TN)
Note that we decide if a word is actually cor-rectly transcribed or not by using the alignment of an automatic transcript with the manual transcript. A standard evaluation tool (sclite2) computes WER by counting the number of substitutions, deletions, and insertions needed to align a reference tran-script with a hypothesis file. It also marks the words that are correct in automatic transcript (the hypothesis file). The rest of the words are the ac-tual recognition errors (the insertions or substitu-tions). The deletions – words that are absent from the automatic transcript – cannot be tagged by the confidence measure.
We define the following performance measures in order to evaluate the improvement of the filtered transcripts compared to the initial transcripts: 1. Word error rate in the initial transcript and in the filtered transcript. These measures can be com-puted with and without stopwords (for which our
2
http://www.nist.gov/speech/tools/
algorithm does not apply). Note that WER without stopwords could be slightly lower than traditional WER mostly because content words tend to be rec-ognized more accurately than stopwords (Désilets
et al. 2001). When filtering out semantic outliers, there will be gaps in the filtered transcript, there-fore the general WER might not improve because it penalizes heavily the deletions.
2. Content word error rate (cWER). This is the error rate in an automatic transcript (initial or fil-tered) from the point of view of the confidence measure, for the content words only. It penalizes the words in the automatic transcripts that should not be there, but not any missing words (no dele-tions are penalized). In the case of a transcript fil-tered by our algorithm, it excludes not only the stopwords, but also the filtered words. We com-puted cWER with sclite without penalizing for the gaps created by the filtered words.
3. The percentage of lost good content words
(%Lost). This is the percentage of correctly
rec-ognized content words which are lost in the proc-ess of filtering out recognition errors, defined as: %Lost = 100 * FN / (TP + FN). We could also compute the percent of discarded words, without regard if they should have been filtered out or not. D = (TN + FN) / (TP + FP + TN + FN).
4. Precision (P), Recall (R) and F-measure.
Pre-cision is the proportion of truly correct words
con-tained in the list of content words which the algorithm labeled as correct. Recall is the propor-tion of truly correct content words that the algo-rithm was able to retain. F-measure is the geometric mean of P and R and expresses a trade-off between those two measures. P = TP / (TP + FP); R = TP / (TP + FN); F = 2PR / (P+R).
7
Results
We ran various configurations of the algorithm described in Section 4 on the 100 story sample from the TDT2 corpus. This section discusses the results of those experiments. We studied the Preci-sion-Recall (P-R) curves for various configurations of our algorithm over the 100 stories, for the two types of transcripts: the BBN and Dragon datasets. Figures 1 and 2 show an example for each dataset. Each point on a P-R curve shows the Precision and Recall for one value of K in {0, 20, 40, 60, 80,
100, 120, 140, 160, 180, 200}. Points on the left correspond to aggressive filtering (high values of K), whereas points on the right correspond to leni-ent filtering (low values of K).
First, we looked at the relative merits of the two semantic similarity measures (PMI and Roget) for Step 2. Figures 1 and 2 plot the P-R curves for the All-PMI-AVG and All-Roget-AVG configurations. The graphs clearly indicate that PMI performs bet-ter, especially for the high WER Dragon dataset. So PMI was used in the rest of the experiments.
Next, we looked at the variants for setting up the neighborhood N(w) in Step 1 (All vs. Window). The three P-R curves for All-PMI-X and Window-PMI-X for all aggregation approaches X in {AVG, MAX, 3MAX} are not shown here because they were similar to the P-PMI curves from Figures 1 and 2, for the BBN dataset and for the Dragon dataset, respectively. The Window variant was marginally better for X=MAX on both datasets, as well as for X=3MAX on the BBN dataset. In all other cases, the Window and All variants per-formed approximately the same.
Next, we looked at the different schemes for ag-gregating the pair-wise similarity scores in Step 3 (AVG, MAX, 3MAX). By plotting the P-R curves for AVG, MAX, and All-PMI-3MAX for both datasets we obtained again curves similar to the P-PMI curves from Figures 1 and 2. It seemed that AVG performs slightly better for high Recall, the difference being more marked when there is no windowing or when we are work-ing on the Dragon dataset. The 3MAX and MAX variants seemed to be slightly better at high Preci-sion with acceptable Recall values, with 3MAX being always equal or very slightly better than MAX. In an audio gisting and browsing context Precision is more important than Recall, therefore we can choose 3MAX.
Having established Window-PMI-3MAX as one of the better configurations, we now look more closely at its performance.
Figures 3 and 4 show how the content word er-ror rate (cWER), the percentage of lost good words (%Lost), and the F-measure vary as we apply more and more aggressive error filtering (by increasing K) to both datasets. We see that our semantic out-lier filtering approach is able to significantly re-duce the number of transcription errors, while losing some correct words. For example, with the
0.4 0.5 0.6 0.7 0.8 0.9 1 0 0.2 0.4 0.6 0.8 1 Recall P reci s ion P-PMI P-Roget
Fig 1: P-R curves of PMI vs. Roget (with All and AVG) on the BBN dataset. Each P-R point corresponds to a different value of the threshold K (high Recall for low values of K, high Precision for high values of K).
0.4 0.5 0.6 0.7 0.8 0.9 1 0 0.2 0.4 0.6 0.8 1 Recall P reci s ion P-PMI P-Roget
Fig 2: P-R curves of PMI vs. Roget (with All and AVG) on the Dragon dataset
0 20 40 60 80 100 0 20 40 60 80 100 120 140 160 180 200 K (threshold) c W E R / % lo s t / F cWER-BBN %Lost-BBN F-measure
Fig.3. Content Words Error Rate (cWER), %Lost good key-words (%Lost) and F-measure as a function of the filtering level K for the Window-PMI-3MAXconfiguration on the BBN dataset. 0 20 40 60 80 100 0 20 40 60 80 100 120 140 160 180 200 K (threshold) c W E R / % lo s t / F cWER-Dragon %Lost-Dragon F-measure
Fig.4. Content Words Error Rate (cWER), %Lost good key-words (%Lost) and F-measure as a function of the filtering level K for the Window-PMI-3MAX configuration on the Dragon dataset.
moderately accurate BBN dataset, we can reduce cWER by 50%, while losing 45% of the good con-tent words (K=100). For the low accuracy Dragon dataset, we can reduce cWER by 50%, while los-ing 50% of the good content words (K=120). We can choose lower thresholds, for smaller reduction in cWER but smaller percent of lost good content words. Even small reductions in cWER are impor-tant, especially for less-than-broadcast conditions where WER is initially very high.
In general, we were not able to show an im-provement in WER computed in a standard way (item 1 in Section 6), because of the high penalty due to deletions for both filtered semantic outliers and lost good content words. The percent of lost good words is admittedly too high, but this seems to be the case for speech error confidence measures (which do not remove the words tagged as incor-rect). Also, for the purpose of audio browsing and gisting, we believe that fewer errors even with loss of content are preferable for intelligibility.
Comparing our results to those reported by Cox and Dasmahapatra (2000) our PMI-based measure seems to performs better than their LSA-based measure, judging by the shape of the Precision-Recall curves. (For example, at Precision=90%, they obtained Recall=12%, whereas we obtain 20%. At Precision=80%, they obtain Recall=50%, whereas we get Recall=100%.) Note however that their results and ours are not completely compara-ble since the experiments used different audio cor-pora (WSJCAM0 vs. TDT2), but those two corpora seem to exhibit similar initial WERs (the WER appears to be around 30% for WSJCAM0; the WER is 27.6% for our BBN dataset). Also, it is worth noting the LSA measure was computed based on a corpus that was very similar to the au-dio corpus used to evaluate the performance of the measure (both were Wall Street Journal corpora). If one was to evaluate this measure on audio from a completely different domain (ex: news in the sci-entific or technical domain), one would expect the performance to drop significantly. In contrast, our PMI measure was computed based on a general sample of the World Wide Web, which was not tailored to the audio corpus used to evaluate its performance. Therefore, our numbers are probably more representative of what would be experienced with audio corpora outside of the Wall Street Jour-nal domain.
8
Conclusion and Future Work
We presented a basic method for filtering recogni-tion errors of content words from automatic speech transcripts, by identifying semantic outliers. We described and evaluated several variants of the ba-sic algorithm.
In future work, we plan to run our experiments on other datasets when they become available to us. In particular, we want to experiment with multi-topic audio documents where we expect more marked advantages for windowing and alter-native aggregation schemes like MAX and 3MAX. We plan to explore ways to scale up other corpus-based semantic similarity measures to large tera-byte corpora. We plan to explore more approaches to detecting semantic outliers, for example cluster-ing or lexical chains (Hirst and St-Onge, 1997).
The most promising direction is to combine our method with confidence measures that use internal information from the ASR system (although the internal information is hard to obtain when using an ASR as a black box, and it could be recognizer-specific). A combination is likely to improve the performance, with the PMI-based measure contrib-uting at the high-Precision end and the internal ASR measure contributing to the high-Recall end of the spectrum. To increase Recall we can also identify named entities and not filter them out. Some named entities could have high semantic similarity with the text if they are frequently men-tioned in the same contexts in the Web corpus, but some names could be common to many contexts.
Another future direction will be to actually cor-rect the errors instead of just filtering them out. For example, we might look at the top N speech recog-nizer hypotheses (for a fairly large N like 1000) and choose the one that maximizes semantic cohe-sion. A final direction for research is to conduct experiments with human subjects, to evaluate the degree to which filtered transcripts are better than unfiltered ones for tasks like browsing, gisting and searching audio clips.
Acknowledgments
We thank the following people: Peter Turney and his col-leagues for useful feedback; Gerald Penn for feedback on earlier versions of this paper; Egidio Terra and Charlie Clarke for giving us permission to use the Multitext System, the NRC copy; Mario Jarmasz and Stan Szpakowicz for sharing their code for the Roget similarity measure; Aminul Islam for the
correlation figures and the correlative measure. Our research is supported by the Natural Sciences and Engineering Research Council of Canada, University of Ottawa, IBM Toronto Cen-tre for Advanced Studies, and the National Research Council.
References
Alexander Budanitsky and Graeme Hirst. 2001. Semantic distance in WordNet: An experimental, application-oriented evaluation of five measures. Workshop on
Word-Net and Other Lexical Resources, NAACL 2001, Pitts-burgh, PA, USA, 29-34.
Satanjeev Banerjee, and Ted Pedersen. 2003. Gloss overlaps as a measure of semantic relatedness. In Proceedings of the
Eighteenth International Joint Conference on Artificial In-telligence (IJCAI’03), Acapulco, Mexico.
Charlie Clarke and Egidio Terra. 2003. Passage retrieval vs. document retrieval for factoid question answering. ACM
SIGIR’03, 327-328.
Stephen Cox and Srinandan Dasmahapatra. 2000. A Semanti-cally-Based Confidence Measure for Speech Recognition,
Int. Conf. on Spoken Language Processing, Beijing, China, vol. 4, 206-209.
Stephen Cox and R.C. Rose. 1996. Confidence Measures for the SWITCHBOARD Database. IEEE Conf. on Acoustics,
Speech, and Signal Processing, 511-515.
Lin Chase. 1997. Word and Acoustic Confidence Annotation for Large Vocabulary Speech Recognition, Proceedings of
Eurospeech'97, Rhodes, Greece, 815-818.
Alain Désilets, Berry de Brujin, and Joel Martin. 2001. Ex-tracting keyphrases from spoken audio documents.
SIGIR’01 Workshop on Information Retrieval Techniques for Speech Applications, 36-50.
Diana Inkpen and Alain Désilets. 2004. Extracting semanti-cally-coherent keyphrases from speech. Canadian
Acous-tics, 32(3):130-131.
L.Gillick, Y.Ito, and J.Young. 1997. A Probabilistic Approach to Confidence Estimation and Evaluation. IEEE Conf. on
Acoustics, Speech, and Signal Processing, 266-277. Julia Hirschberg, Steve Whittaker, Donald Hindle, Fernando
Pereira, Amit Singhal. 1999. Finding information in audio: a new paradigm for audio browsing and retrieval.
Proceed-ings of the ESCA ETRW Workshop, 26-33.
Graeme Hirst and David St-Onge. 1998. Lexical chains as representations of context for the detection and correction of malapropisms. In: C. Fellbaum (editor), WordNet: An
electronic lexical database and some of its applications, The MIT Press, Cambridge, MA, 305-332.
Mario Jarmasz and Stan Szpakowicz. 2003. Roget's thesaurus and semantic similarity, Proceedings of the International
Conference RANLP-2003 (Recent Advances in Natural Language Processing), Borovets, Bulgaria, 212-219. Jay J. Jiang and David W. Conrath. 1997. Semantic similarity
based on corpus statistics and lexical taxonomy. In
Pro-ceedings of the International Conference on Research in Computational Linguistics (ROCLING X), Taiwan.
Thomas Landauer and Susan Dumais. 1997. A solution to Plato’s problem: representation of knowledge.
Psychologi-cal Review 104: 211-240.
Claudia Leacock and Martin Chodorow. 1998. Combining local context and WordNet similarity for word sense identi-fication. In C. Felbaum (editor), WordNet: An Electronic
Lexical Database, MIT Press, Cambridge, MA, 264-283. M.E. Lesk. 1969. Word-word associations in document
re-trieval systems. American Documentation 20(1): 27-38. Dekang Lin. 1998. An information-theoretic definition of
similarity. In Proceedings of the 15th International Confer-ence of Machine Learning.
Changxue Ma, Mark A. Randolph, and Joe Drish. 2001. A support vector machines-based rejection technique for speech recognition. Proceedings of ICASSP'01, Salt Lake City, USA, vol. 1, 381-384.
Lidia Mangu and M. Padmanabhan. 2001. Error corrective mechanisms for speech recognition. Proceedings of
ICASSP'01, Salt Lake City, USA, vol. 1, 29-32.
George A. Miller and W.G. Charles. 1991. Contextual corre-lates of semantic similarity, Language and Cognitive
Proc-esses, 6(1):1-28.
Christine Nakatani, Steve Whittaker, Julia Hirshberg. 1998. Now you hear it, now you don’t: Empirical Studies of Au-dio Browsing Behavior. Proceedings of the Fifth
Interna-tional Conference on Spoken Language Processing, (SLP’98), Sydney, Australia.
Philip Resnik. 1995. Using information content to evaluate semantic similarity. In Proceedings of the 14th Joint Inter-national Conference of Artificial Intelligence, Montreal, Canada, 448-453.
Herbert Rubenstein and John B. Goodenough. 1965. Contex-tual correlates of synonymy. Communications of ACM, 8(10): 627-633.
Thomas Schaaf and Thomas Kemp. 1997. Confidence meas-ures for spontaneous speech recognition, in Proceedings of
ICASSP’97, Munich, Germany, vol. II, 875-878.
Gabriel Skantze and J. Edlund. 2004. Error detection on word
level. In Proceedings of Robust 2004, Norwich.
Peter D. Turney. 2001. Mining the Web for synonyms: PMI-IR versus LSA on TOEFL, Proceedings of the Twelfth
European Conference on Machine Learning (ECML-2001), Freiburg, Germany, 491-502.
Lina Zhou, Jinjuan Feng, Andrew Sears, Yongmei Shi. 2005. Applying the Naïve Bayes Classifier to Assist Users in De-tecting Speech Recognition Errors. Procs. of the 38th
An-nual Hawaii International Conference on System Sciences).
Z.Y. Zhou and Helen M. Meng, 2004. A Two-Level Schema for Detecting Recognition Errors, Proceedings of the 8th
International Conference on Spoken Language Processing (ICSLP), Korea.