Prolonged and unprolonged complex febrile seizures differently
affect frontal theta brain activity
Thébault-Dagher, F.1,2,3, Deguire, F.1,2,3, Knoth, I.S.3, Lafontaine, M.-P.1,2,3, Barlaam F.3, Côté, V. 1,2,3, Agbogba, K.3,4, Lippé, S.1,2,3
1 Department of Psychology, Université de Montréal, 2 Centre de recherche en neuropsychologie et cognition, Université de Montréal, 3 CHU Sainte-Justine Research Center, Université de Montréal, 4 École de technologie supérieure, Université du Québec
Epilepsy Research (2020), 159, 106217, DOI : 10.1016/j.eplepsyres.2019.106217
Highlights
• We found abnormal brain activity to a habituation paradigm after complex FS • Children with prolonged FS show brain hyperactivity to a habituation paradigm • Children with multiple and focal FS show impaired neural habituation
• Opposite patterns depending on FS type suggests different underlying mechanisms • Abnormal activity could impact FS characteristics, including cognitive prognosis
2 Abstract
Objective: Studies have identified persistent cognitive and functional deficits, which could be linked to each other, in children with complex febrile seizures (FS). Our aim was to investigate differences in brain activity in children with a history of complex FS, through a study paradigm associated with the development of learning capacities and using electroencephalographic (EEG) signal. To further increase our understanding of these differences, complex FS were studied separately depending on their type.
Method: EEG was recorded in 43 children with past FS. Brain activity associated with auditory learning was investigated using a habituation paradigm, in which repetition suppression (RS) is typically found following stimulus repetition. Auditory stimuli were repeated three times, and each presentation were analysed separately in the time-frequency (TF) domain. A mixed-analysis of variance was used to assess differences in spectral power between stimulus repetition and FS type (simple vs complex prolonged; CP vs complex unprolonged; CUP).
Results: Repetition effects were found in the 3-6 Hz during 150-600ms time window after stimulus onset at frontal sites (F(2, 40)=5.645, p=0.007, η2p=0.220). Moreover, an interaction effect between stimulus repetition and FS type (F(4, 80)=2.607, p=0.042, η2p=0.115) was found. Children with CP FS showed greater increase in spectral power in response to the first stimulus presentation, while children with CUP FS failed to show a RS pattern.
Significance: Our results show distinct abnormalities in brain activity to a habituation paradigm. We argue that these changes suggest children with CP FS may be hyperexcitable, while children with CUP FS show impaired habituation processes. Still, these differences may be associated with other clinical features linked to complex FS as well. Hence, the role of these differences in complex FS incidence and prognosis should be the subject of future studies.
Keywords: repetition suppression; habituation; neural attenuation; time-frequency; convulsion; epilepsy.
3 1. Introduction
Febrile Seizures (FS) are fever-induced seizures in young children without prior afebrile seizures, neurological insults or central nervous system infections (American Academy of Pediatrics, 2011). They are the most common pediatric seizures, affecting 2 to 5% of preschool-aged children (International League Against Epilepsy, 1993; Offringa et al., 1994). Simple FS are generally benign and associated with normal cognitive prognosis (Leaffer et al., 2013; Offringa et al., 1994; Patel et al., 2015; Verity et al., 1998; Verity et al., 1993). However, mild but lasting cognitive impairments and functional abnormalities are found in those with complex FS, which are FS episodes characterised as more than one seizure during the febrile illness, and/or focal features, and/or ≥ 10 minutes seizure duration (Berg and Shinnar, 1996). Specifically, learning, memory, and executive function deficits have been identified in school-aged children with prior history of complex FS (Hesdorffer et al., 2011; Martinos et al., 2012; Schiottz‐Christensen and Bruhn, 1973; Visser et al., 2012). Furthermore, children with past complex FS show different brain activity to that of healthy controls, as measured through electroencephalography (EEG) (Kipp et al., 2010; Lippé et al., 2009). Interestingly, it has been suggested that these changes in brain activity could be associated with the observed cognitive deficits.
We aimed to further our understanding of differences in brain activity in children with complex FS, using a repetition suppression (RS) paradigm in EEG, which could be associated with future impaired learning capacities. RS refers to a decreased response to repeated stimulus presentation, as opposed to novel stimulus presentation (Nordt et al., 2016). It has been described as the neural correlate of habituation, or progressive loss of interest for familiar stimuli, which plays an important part in stimulus-specific learning and increased processing speed in early childhood (Dobbins et al., 2004; Grill-Spector et al., 2006; Turk-Browne et al., 2008). Hence, it is frequently used to study perceptual learning in developmental studies, as an automatic process without the need for overt behavioral responses (Gotts et al., 2012; Nordt et al., 2016). RS effects have been described in most brain areas and have been documented using multiple neuroimaging techniques, including EEG, across development (Kim, 2017; Nordt et al., 2016). For instance, reduced amplitude of event-related potentials and reduced blood-oxygen-level dependant response to repeated auditory stimuli has been shown in young infants and neonates and described as correlates of perceptual learning (Dehaene-Lambertz and
4
Dehaene, 1994; Dehaene-Lambertz et al., 2010; Dehaene-Lambertz and Pena, 2001). Additionally, we targeted RS responses specifically in slow EEG rhythms (i.e. theta and delta). In adults, theta oscillations are strongly linked to learning and memory (Buzsáki and Draguhn, 2004; Lega et al., 2012). In early childhood, slow frequencies maturation is associated with the development of both learning and executive functions (Orekhova et al., 1999; Stroganova and Orekhova, 2013; Stroganova et al., 1998; Summerfield et al., 2011). Importantly, while studies of cortical rhythms associated with possible cognitive deficits in human FS populations are lacking, rodent studies suggest theta alterations may be associated with spatial learning deficits specific to early-life seizures (Karnam et al., 2009). Studies of slow brain rhythms such as theta have been recommended to assess the link between FS and cognitive impairments (Roper, 2016).
Most studies of cognitive and functional differences in children with complex FS have focussed on complex prolonged (CP) FS, which have been historically classified as more severe (Hesdorffer et al., 2012). Still, studies show cognitive impairments in school-aged children with past complex FS of all types, compared to simple FS (Tsai et al., 2015). Furthermore, distinct hippocampal abnormalities have been found in children with complex unprolonged (CUP; focal and/or multiple) FS that may lead to future cognitive deficits (VanLandingham et al., 1998). Finally, as risk factors and prognosis for prolonged and complex UP FS differ (Berg and Shinnar, 1996; Sapir et al., 2000), patterns in brain activity notably associated with the development of learning processes could differ as well in children with all subtypes of complex FS. Hence, our goal was to investigate functional differences in brain activity associated with the development of auditory learning, through time-frequency (TF) analyses of RS patterns in slow EEG frequencies, according to FS type. We hypothesized that children with CP and CUP FS would show EEG spectral patterns in response to repeated auditory stimulation that is different from children with past simple FS, and from each other. Different abnormalities in the brain activity pattern underlying auditory learning following subtypes of complex FS would deepen our understanding of mechanisms involved.
5 2. Material and methods
2.1 Participants
We recruited a convenience sample of children between 10 and 24 months of age as they were admitted to the emergency department of a tertiary care, university affiliated pediatric Hospital (CHU Sainte-Justine) following a first FS episode according to the American Academy of Pediatrics definition (American Academy of Pediatrics, 2011). Recruitment was conducted from August 2015 to May 2018. Recruited children were otherwise healthy, exclusion criteria were gestational age at birth of less than 34 weeks, history of health-related problems that could affect cognitive and neurological development, abnormal neurological exam following FS diagnosis (e.g. epileptiform activity) or suspicions of developmental delay. Studies suggest non-acute hippocampal abnormalities, which have also been shown to affect learning abilities, can be observed as early as two weeks following complex FS (Grünewald et al., 2001). Hence, most visits were planned after that time-point. Visits were planned during the day and parents were asked to postpone a visit if their child were sick or had an unusually bad night of sleep, to ensure optimal collaboration during the EEG recording.
The date of every FS episodes and seizure duration, quantity and features were drawn from participants’ medical files by a Doctoral student in Neuropsychology specialized in seizure disorders. If applicable, results from neurological exams were obtained. Children were classified as being either in the simple FS group (isolated, <10 minutes, and generalized), CP FS group, using the 10 minutes seizure duration cut-off for prolonged FS notably supported by Hesdorffer et al. (2011), or the CUP FS group, being children who either had multiple seizures during the febrile illness, focal features, or both (Berg and Shinnar, 1996). A diagnosis for focal FS was given based on partial seizure presentation. Children with more than one FS episode were put in one of the complex subgroups if at least one of the episodes had complex features. They were put specifically in the CP subgroup if at least one of the episodes was of prolonged duration. Groups of children with simple, CP and CUP FS had similar age, sex, and socio-economical (SES) distributions.
As there is a strong body of literature supporting unaltered functional, structural and cognitive development in children with simple FS (Baumann and Duffner, 2000; Shinnar and Glauser, 2002), the simple FS group served as a comparative “control” group, with similar life experience and genetic background as children with complex FS (Vestergaard and Christensen,
6
2009) to children with past complex FS. Still, preliminary analyses were conducted to confirm control-like EEG auditory learning responses in children with simple FS. A number of healthy control participants equivalent to the number of children with simple FS available for analyses was recruited through social medias. Children with simple FS and healthy controls were aged and sex matched and had similar SES and developmental quotient distribution when tested. Healthy controls were recruited based on the same exclusion criteria as children with FS, plus having no history of FS.
The study was approved by the CHU Sainte-Justine Research Ethics Board. Legal guardians gave verbal consent at the time of recruitment, as well as written, informed consent when arriving in the evaluation room. They were free to withdraw their participation at any time. Families were given a 30$ compensation to cover travel costs.
2.2 Participants’ developmental characteristics
Sociodemographic information and medical history were provided by the parents using an in-house questionnaire. To confirm normal development in participating children and to assess how developmental characteristics relates to brain activity, cognitive development was assessed during the laboratory visit using the Bayley-Scales of Infant and Toddler Development
– Third Edition (BSID; Bayley and Reuner, 2006). Furthermore, adaptive behaviors were
assessed through the Adaptive Behavior Assessment System – Second Edition (Ages 0-5; Harrison and Oakland, 2003) filled out by the participating parent.
2.3 Data acquisition 2.3.1 Apparatus
Evaluations took place in an electrically shielded, dark soundproof experimental chamber at the CHU Sainte-Justine. Stimuli were presented via E-Prime 2.0 (Psychology Software Tools Inc. Pittsburgh, PA, USA) using a Dell Optiplex 790 PC. Sounds were presented through two speakers (BX5a, M-Audio; Cumberland, RI, USA) located laterally at approximately 30cm from the participant’s ears. Visual stimuli were presented on a screen located at a viewing distance of approximately 60cm.
2.3.2 Stimuli and design
Analyses were conducted on repeated stimuli featured in a phonemic oddball task adapted from Basirat et al. (2014). The overall task was composed of audio-visual stimuli of a woman (pictured in Figure 1) or a man alternating in the articulation of the vowels [a] and [i]. While the
7
task evaluates auditory learning, visual features served to maximize attention. The onset of each auditory vowel coincided with a 200ms visual stimulus showing the person from the neck up with their mouth fully opened. Following the end of the vowel, two frames of 60ms each showing the person with their mouth gradually closing were presented, thus animating the pronunciation of the vowels. Then there was a 280ms frame showing the same person with their mouth closed, followed by the onset of the next vowel, for a total stimulus duration of 600ms.
Figure 1. Experimental design.
Description. Task composed of audio-visual stimuli of a woman (pictured) or a man articulating the vowels [a] (pictured) and [i] (not analysed). Audio stimuli lasted 200ms in synchrony with a picture of the person with their mouth fully open (first frame), then following the end of the sound were two frames of 60ms each showing the mouth gradually closing, and a 280ms frame showing the person with their mouth fully closed. Overall stimulus duration was 600ms. The audio-visual stimuli of the vowel [a] was repeated three times per trial.
The task had two phases; a learning phase composed of 16 “standard” trials respecting a specific [aaai] rule, and a test phase composed of 64 “standard” trials and 16 “deviant” trial following a [aaaa] rule. The order of “standard” and “deviant” trials was pseudo-randomized and fixed across participants, making sure no “deviant” trials would follow each other. The novel stimuli [i] enabled a rebound of signal to non-adapted levels, thus allowing investigation of neural adaptation on the repeated stimulus [a] across numerous trials (Nordt et al., 2016). To assess auditory RS, the first three [a] of each “standard” and “deviant” trial (referred to as a1, a2, and a3), were analysed. All trials from the learning and test phase, apart from those directly
8
following a “deviant” trial, were included in the analyses. Hence, 80 trials were available for pre-processing.
2.3.3 Procedure
Children were seated on their parent’s lap throughout the experiment. High-density scalp EEG was recorded continuously using a 128-channel HydroCel Geodesic Sensory Net System (Electrical Geodesics System Inc., Eugene, OR, USA). Signal was acquired and processed by a G4 Macintosh computer using NetStation EEG Software, Version 4.5.4 (Electrical Geodesics System Inc., Eugene, OR, USA). Data was acquired at a 1000 Hz sampling rate. Impedances were maintained under 40 kΩ (Tucker, 1993), and the vertex was used as reference during recording.
2.4 Processing and analyses 2.4.1 EEG signal processing
Off-line pre-processing was carried out using BrainVision Analyser software, version 2.0 (Brain Products, Munich, Germany). Data were digitally filtered with a lower bound of 0.5 Hz, a 60 Hz selective “notch” filter and a 100 Hz lowpass filter. Twenty-eight electrodes containing muscular artefacts, around the neck and face of the participants, were removed for all participants. Channels were visually inspected, and abnormally noisy or flat channels were removed and interpolated with topographically surrounding channels. Blink artefacts and saccadic eye movement were removed using a semi-automatic independent component analysis (ICA (Plank, 2013); details are shown in Appendix A). Data was then re-referenced to an average reference. EEG signal was segmented into 3500ms epochs (-1000 to 2500ms in relation to first stimulus onset), encompassing all stimulus repetitions per trial, thus providing us with an equal number of epochs per stimulus presentation. Algorithmic artefact marking of voltage exceeding ± 100 μV was followed by visual inspection of segmented data, in which epochs with significant artefacts were rejected manually. Participants contributing less than 30 epochs were excluded from analyses.
To allow for individual analyses of each stimulus repetition, epochs were further segmented into three 800ms epochs based on each stimulus presentation, with 200ms prior and 600ms following stimulus onset. More precisely, the epoch for a1 was -200 – 600ms, the epoch for a2 400 – 1200ms and the epoch for a3 1000 – 1800ms, always in relation to first stimulus onset.
9 2.4.2 Spatial principal component analysis
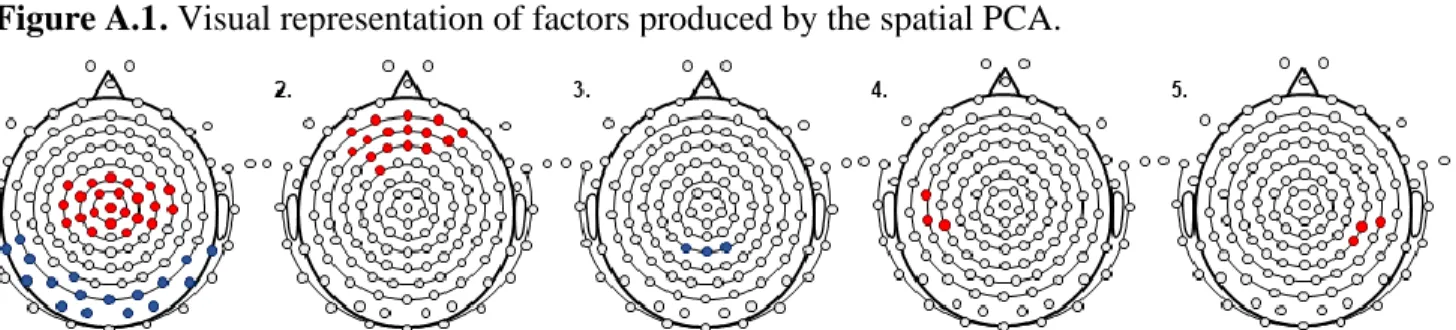
A principal component analysis (PCA) was used to identify spatial regions of interest (ROIs) relevant for the task as performed by our sample (Rigoulot et al., 2008; Spencer et al., 1999, 2001). A spatial PCA was carried out using a Varimax Rotation on IBM SPSS, Version 25 (IBM, Armonk, NY, USA) with 99 channels as dependent variables, participants and stimulus presentation (3) as observations (Spencer et al., 2001). Specifics of the spatial PCA factor loadings are shown in Appendix A. The spatial PCA yielded 6 factors. The first factor explained over 74% of data variance and was thus the prime focus of our analyses. It showed two spatial clusters; a positive fronto-central cluster and a negative occipito-parietal cluster. To test our hypothesis on auditory learning in slow EEG frequencies, analyses were conducted on the fronto-central ROI only, which comprises 23 channels, notably including C3, Cz, and C4 (Figure 2, 1st graph). The fronto-central ROI was chosen as it is coherent with past developmental studies, showing that increased responses in fronto-central slow frequencies are associated with learning in early childhood (Orekhova et al., 1999; Stroganova et al., 1998; Summerfield et al., 2011).
Figure 2. Regions produced by the spatial PCA and chosen region of interest.
Description. Visual representation of factors (1 to 5) produced by the spatial principal component analysis (PCA). Positive clusters are shown in black, negative clusters are shown in grey. The chosen region of interest (ROI) as part of our analyses is the fronto-central positive cluster shown in factor 1.
10 2.4.3 Time-frequency analysis
Time-frequency (TF) analyses were used as they provide temporal information on the activity of specific frequency bands. Data were exported to MATLAB 6.1 (The MathWorks Inc., Natick, MA) using BrainVision solutions and analysed with the EEGLAB version 14.0.0 toolbox (Delorme and Makeig, 2004). To avoid overlap between segments, a padding technique was implemented, in which the first spectral power value of each segment was added for the 600ms period before and the last spectral power value for the 600ms period after the segment, thus increasing its length to 1800ms. For the channels of the chosen fronto-central ROI, epochs were analysed in the TF domain with complex Gaussian Morlet’s wavelets (Tallon-Baudry and Bertrand, 1999) and then averaged across trials and channels. This convolution provided TF power maps for each stimulus repetition 𝑀(𝑡, 𝑓) = 𝑊 × 𝑆 = ∫ 𝑊(𝑡 − 𝑎 𝑏𝑡 ⁄ , 𝑓)𝑆(𝑡). 𝑑𝑡, where
S is the EEG signal as a function of time, W is the complex Morlet’s wavelet, and a and b are
the translation and dilatation parameters. Lastly, M(t, f) is a matrix of complex values given for time (t) and frequency (f). Each stimulus repetition was then represented by an Event Related Spectral Perturbation (ERSP) plot (Makeig, 1993), using the amplitude and phase given by Morlet’s wavelet transformation as 𝑃(𝑡, 𝑓) = 10 𝑙𝑜𝑔10(|𝑀(𝑡, 𝑓)|2), where |𝑀(𝑡, 𝑓)|2 is the squared absolute value for every complex vector of a TF map, the logarithmic transformation converts values in decibels and thus P(t,f) denotes TF power in terms of decibels. ERSP plots show mean log deviations from baseline power, averaged across participants. Investigated frequencies started at 3 Hz. Baseline correction was achieved by computing the mean power of all three stimulus presentations (a1, a2, and a3). This mean was subtracted from each time and frequency points of interest to show variations in EEG activity. ERSP plots were used to define a time-frequency window (TFW) in slow frequencies in which EEG activity showed greater variations.
2.4.4 Statistical analyses
To test our hypothesis, a mixed-design analysis of variance (ANOVA) was used to assess differences in spectral power in the TFW between 1) each stimulus repetition, 2) FS type, and 3) the interaction between stimulus repetition and FS type. All a posteriori analyses used to interpret and specify main effects and interaction effects were conducted only when the mixed-ANOVA showed effects to be either significant or large (Dahiru, 2008).
11
1) Main effect of stimulus repetition on spectral power was interpreted using differences in mean spectral power in the TFW between stimulus presentations (planned contrasts; a1 vs a2, a1 vs a3);
2) Main effect of FS type on spectral power was specified using a multivariate ANOVA (MANOVA) assessing differences in mean spectral power for each stimulus
presentation between FS type (simple vs CP vs CUP);
3) The interaction between stimulus repetition and FS type was first interpreted using a MANOVA assessing differences in spectral power changes (a1 - a2, a1 - a3) between study groups (3). These analyses were used to investigate which type of FS
significantly differed from each other in terms of spectral power changes. Finally, univariate repeated measures ANOVAs were applied for each FS type separately to assess differences in spectral power in the TFW per stimulus presentation (planned contrast; a1 vs a2, a1 vs a3), thus showing the specific pattern of responses in each group (Howell, 2009).
Prior to our main analyses, preliminary analyses were conducted to evaluate how the brain activity of children with simple FS relates to that of matched healthy controls. Steps 2) and 3) of the previously described statistical model were used, however only groups of children with simple FS and healthy controls were compared.
Finally, supplementary analyses were conducted to assess how clinical characteristics of FS relate to RS effects, using Pearson’s bivariate correlations between spectral power differences (a1 - a2, a1 - a3), and both age at first FS and time since the last FS episode to verify how these variables may interact with our hypothesis.
Statistical analyses were carried out using IBM SPSS for Windows, Version 25.0 (IBM, Armonk, NY, USA). Whole sample and group normality were assessed using the Shapiro-Wilk test. No outliers, as defined by |Z score| ≥ 3, were found per study groups nor in the overall sample. Homogeneity of variance was assessed using the FMax test. Sphericity was assessed using Mauchly’s test. Analyses were performed on complete cases, statistical significance was defined as a two-sided alpha level of ≤ 0.05, and Bonferroni corrections for multiple testing, adjusted for intercorrelation (Sankoh et al., 1997), were applied on alpha levels when needed. One-way ANOVA and Chi-Square tests of independence were carried out to examine
12
differences in participants’ characteristics, such as sex, age at testing, cognitive development, adaptive behaviors, between study groups to ensure comparability. Pearson’s bivariate correlations and Student’s T-Test were conducted to verify if participants’ sex and age at testing did not significantly influence spectral power or differences in spectral power between stimulus repetition used in the planned contrasts, thus possibly confounding our results. Lastly, Pearson’s bivariate correlations were also conducted to verify how spectral power and differences in spectral power between stimulus relates to cognitive development. Assumptions necessary to conduct all analyses were verified and satisfied.
3. Results
3.1 Descriptive statistics
Of the 108 children identified for recruitment, seven did not meet the inclusion criteria after verification (e.g. epilepsy, cancer diagnosis, inconclusive FS diagnosis). Fifty-four families declined to participate, mostly for lack of interest and/or residing far from CHU Sainte-Justine. Hence, 47 children were recruited for participation. Following exclusion of participants contributing less than 30 epochs per stimulus presentation (n = 4), data from 43 children was analysed in this study (Median age = 17.10 months, Interquartile Ratio; IQR = 14.50 – 21.73). On average, each child contributed 63/80 (Standard Deviation; SD = 13) epochs to the analyses. Children were then classified into three study groups: those with simple FS (n = 23, Median age = 19.10 months, IQR = 15.73 – 22.00), those with CP FS (n = 9, Median age = 14.13, IQR = 11.44 – 21.37), and those with CUP FS (n = 11, Median age = 16.57 months, IQR = 14.77 – 21.40). Participants’ characteristics per group and group differences are shown in Table 1. Importantly, there were no significant group differences on age, sex and SES distribution or developmental characteristics, thus supporting comparability between study groups.
FS clinical characteristics per study group are featured in Table 1 as well. No significant group differences on age at first FS or time since the last FS and EEG recording were found (p > 0.1). Mean age at first FS for the whole sample was 14.89 months (SD = 4.03). Most evaluations were planned at least 2 weeks after the FS event and average time between the last FS episode and the testing was 2.02 months (SD = 1.42). Finally, children in the CP FS group showed higher FS recurrence than those with simple and CUP FS (p < 0.01).
13 Table 1. Descriptive statistics and group differences.
Simple (n = 23) CP (n = 9) CUP (n = 11)
na M(SD) na M(SD) na M(SD) p
Participants’ characteristics
Age at testing, months 23 18.80(4.19) 9 16.00(4.68) 11 17.54(3.90) 0.24
Sex 0.70
Female 14 4 6
Male 9 5 5
Gestational age at birth 0.75
Term 16 6 10
Late preterm 1 0 1
Parental civil status 0.62
Together 17 6 1
Single-parent 1 0 0
Family income 0.37
<40 000$CA per year 2 0 0
≥40 000$CA per year 14 5 10
Maternal education, years 17 16.00(2.83) 6 16.17(3.06) 11 17.55(3.11) 0.39 Paternal education, years 16 15.94(3.45) 6 15.83(2.48) 11 16.91(3.08) 0.70 Cognitive skills, PR 23 55.35(21.42) 9 70.33(24.68) 11 66.61(24.68) 0.18 Adaptive behaviors, PR 16 45.19(23.63) 5 50.00(24.01) 11 50.82(28.04) 0.83 Clinical characteristics Quantity of FS episodes 0.01 1 22 5 8 2 1 1 1 3 0 0 2 4 0 1 0 5 0 2 0 FS typeb n.a. Simple 23 0 0 Focal 0 1 4 Multiple 0 1 8 Prolonged 0 9 0 (FSE) (0) (5) (0)
Seizure duration, minutes 22 2.24(1.58) 9 22.56(12.60) 11 2.32(1.76) n.a. Age at first FS, months 23 15.99(4.03) 9 12.84(3.91) 11 14.25(3.64) 0.11 Time since last FS, months 23 2.28(1.68) 9 1.42(0.90) 11 1.98(1.06) 0.31 Description. Descriptive statistics (Mean, M; standard-deviation, SD) for participants’ characteristics and clinical features. Group differences were computed with one-way ANOVAs and Chi-square tests of independence, alpha levels are represented as p-values and embolden when significant. CP = complex prolonged, CUP = complex unprolonged; PR = percentile rank; FS = febrile seizures; FSE = febrile status epilepticus. aMissing values account
for n inconsistency, bTotal number adds over 43 because of overlap (one child had both focal and multiple seizures,
14 3.2 Time-frequency maps
ERSP plots from the selected fronto-central ROI for the whole FS sample are shown in Figure 3. They show mean log deviations from baseline mean power for each stimulus presentation, from 3 to 50 Hz. Based on Figure 3, a TFW in slow frequencies was chosen for analysis. These frequency bands showed the most prominent changes in brain activity compared to baseline on stimulus presentation for both a1 and a2, approximately 150ms post-stimulus presentation until the onset of the next stimulus. Meanwhile, overall activity at a3 was in the neutral range. Hence, the TFW used in our analyses covered the 150 to 600ms post-stimulus time-period and frequencies from 3 to 6 Hz. It is shown in Figure 3 in the dotted rectangle. When considering the whole sample, the chosen TFW shows an increase in spectral power compared to baseline levels following a1, and a decrease in spectral power compared to baseline levels following a2. Finally, the TFW following a3 suggest a less steep decrease, with spectral power values being close to baseline levels.
Figure 3. Time-frequency maps.
Description. Event Related Spectral Perturbation (ERSP) plot per stimulus presentation (a1, a2, a3) for the whole
study sample. Mean log deviations from baseline mean power (i.e. average on all trials and stimulus presentation) are presented as a heat map. The selected time-frequency window (TFW) is shown in the dotted rectangle.
Analyses conducted on spectral power and differences (a1 - a2, a1 - a3) in spectral power in the selected TFW show no significant differences or relationship with participants’
15
characteristics such as sex or age at testing (p ≥ 0.146), thus these variables should not confound our results. Finally, similar analyses revealed small (Cohen, 1988) and non-significant relationship between spectral power and cognitive development, as assessed using the BSID (|r| ≤ 0.200, p ≥ 0.199). Concerning differences in spectral power, small (Cohen, 1988) positive and, once again, non-significant relationship between cognitive development and the difference between a1 and a2 (r = 0.162, p = 0.301), and a1 and a3 (r = 0.174, p = 0.263) were uncovered. 3.3 Preliminary analyses : control-like brain activity in children with simple FS
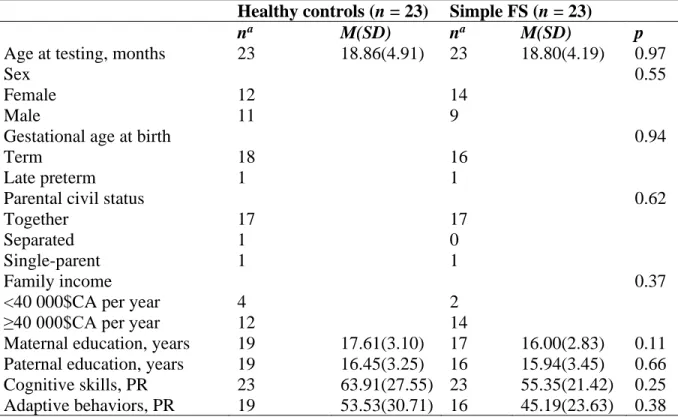
As part of preliminary analyses, the 23 children from the simple FS group were compared to 23 healthy controls (Median age = 18.73 months, IQR = 14.93 – 23.47). Participants characteristics for the healthy controls group, compared to that of the simple FS group, is shown in Appendix A (Table A.2). Importantly, no significant group differences in age, sex, SES distribution and developmental characteristics were found between children with simple FS and healthy controls (p ≥ 0.11), thus ensuring comparability between groups.
There was a non-significant moderate effect (Cohen, 1988) of study groups on spectral power throughout the experiment (p = 0.052, η2p = 0.083), suggesting spectral power averaged
across stimulus repetition for both groups may slightly differ. Hence, differences in spectral power on each stimulus repetition between study groups were specified through a MANOVA, for which significance was corrected at p ≤ 0.033. Mean spectral power per study groups is shown in Appendix A (Figure A.2). No significant differences in spectral power between study groups were found on first (p = 0.962, η2
p < 0.001, Difference = 0.008, 95% Confidence Interval; CI = -0.335 – 0.352), second (p = 0.311, η2
p = 0.023, Difference = 0.209, 95%CI = -0.202 –
0.620), or third stimulus presentation (p = 0.524, η2p = 0.009, Difference = 0.133, 95%CI =
-0.285 – 0.552). Importantly, all alpha-levels for between group differences were large and all effect sizes were small, while raw differences observed between study groups for the overall experiment (0.028) and on each stimulus presentation are notably small considering the type of data observed. Hence, despite low alpha-levels for the main effect of study groups on spectral power, these results do not support differences between groups neither throughout the whole experiment, nor per stimulus repetition. Lastly, no significant interaction was found between stimulus repetition and study groups (p = 0.594, η2p = 0.012). Importantly, the effect size for
16
Overall, these results do not support differences in the pattern of brain activity between children with simple FS and healthy controls. Notably, the raw group differences found were considerably small, as well as being non-significant. These preliminary analyses reinforce the use of children with simple FS as a “control” group with typical development, yet similar life history and probable common genetic background as children with complex FS.
3.4 Main analyses: differences in activity depending on stimulus repetition and FS type All statistics from the mixed-ANOVA model and its planned comparisons are reported in Table 2 and in-text. When alpha-levels were significant and / or when the effect size for the difference was large (η2p ≥ 0.140), subsequent MANOVAs, univariate ANOVAs and multiple
comparisons were conducted and are reported.
Figure 4. Stimulus repetition, febrile seizure type and interaction on spectral power.
Description. Average spectral power per stimulus presentation for the whole sample (A) and per febrile seizure (FS) type (compared in B, separated in C). Mean values are shown as “x” and median values are represented by the midline of the boxes. Second quartile is represented by the boxes, whiskers indicate outside variability, and data with values over 1.5 standard deviation (SD) are plotted. CP = complex prolonged; CUP = complex unprolonged. t = 0.05 < p ≤ 0.09, * = p ≤ 0.05; ** = p ≤ 0.01, *** = p ≤ 0.001.
17
Table 2. Effect of stimulus repetition and FS type on spectral power.
dfm, dfr F pa η2p Difference(95%CI) Stimulus repetition, main effect 2, 80 22.837 <0.001 0.363
a1 vs a2 1, 40 40.010 <0.001 0.500 1.130(0.769–1.490)
a1 vs a3 1, 40 17.827 <0.001 0.308 0.683(0.356–1.010)
FS type, main effect 2, 40 5.645 0.007 0.220
a1 differences 2, 40 4.389 0.019 0.180 Simple vs CP 0.070b -0.421(-0.878–0.036) Simple vs CUP 0.110 0.345(-.081–0.771) CP vs CUP 0.005 0.766(0.243–1.288) a2 differences 2, 40 0.458 0.636 0.022 a3 differences 2, 40 3.608 0.036c 0.153 Simple vs CP 0.079b 0.392(-0.047–0.831) Simple vs CUP 0.184 -0.274(-0.683–0.135) CP vs CUP 0.011 -0.666-1.167–-0.164)
Stimulus repetition x FS type, interaction effect 4, 80 2.607 0.042 0.115 a1 vs a2 2, 40 2.276 0.116 0.102 a1 vs a3 2, 40 5.294 0.009 0.209 Simple vs CP 0.041b 0.813(0.035–1.591) Simple vs CUP 0.093b -0.619(-1.344–0.107) CP vs CUP 0.002 -1.432(-2.321–-0.542)
Simple, repeated measures 2, 44 16.185 <0.001 0.424
a1 vs a2 1, 22 39.447 <0.001 0.642 1.070(0.717-1.423)
a1 vs a3 1, 22 14.587 0.001 0.399 0.618(0.282-0.954)
CP, repeated measures 2, 16 8.380 0.003 0.512
a1 vs a2 1, 8 9.507 0.015 0.543 1.677(0.423-2.931)
a1 vs a3 1, 8 9.901 0.014 0.553 1.431(0.382-2.480)
CUP, repeated measures 2, 20 3.206 0.062c 0.243
a1 vs a2 1, 10 4.202 0.068b 0.296 0.642(-0.056-1.339)
a1 vs a3 1, 10 <0.001 0.998 <0.001 -0.001(-0.679-0.678)
Description. Results of the mixed-ANOVA model and subsequent univariate ANOVAs and multiple comparisons assessing and describing the main effect of stimulus repetition and study groups, as well as their interaction on spectral power. dfm = degrees of freedom for the effect of the model; dfr = degrees of freedom of the residuals; CI
= confidence interval; a1 = first stimulus presentation; a2 = second stimulus presentation; a3 = third stimulus
presentation; FS = febrile seizures; CP = complex prolonged; CUP = unprolonged. a Bonferroni corrections with
adjustment for intercorrelation were applied to correct significance for univariate ANOVAs and multiple comparisons, as described in-text. Alpha levels that are statistically significant after correction are embolden in the table, b Contrasts are described in text because of low alpha levels and/or large effect size, despite not reaching
significance after correction, c Multiple comparisons and planned contrasts were executed and are described
because of low alpha levels and large effect size, despite the main analysis not reaching significance after correction.
18
3.3.1 Effects of stimulus repetition on spectral power
Mean spectral power per stimulus repetition for the whole study sample is shown in Figure 4A. The mixed-ANOVA revealed a significant effect of stimulus repetition on spectral power (p < 0.001, η2p = 0.363). Planned contrasts showed an increase in spectral power following a1
(M estimates = 0.534, SD estimates = 0.095), that significantly differed from decreased spectral power compared to baseline levels following a2 (M estimates = -0.595, SD estimates = 0.106), and a3 (M estimates = -0.149, SD estimates = 0.091). Effect sizes for the main effect and planned contrasts were large (Cohen, 1988).
3.3.2 Effect of febrile seizure type on spectral power
Between group comparisons per stimulus repetition are shown in Figure 4B. There was a significant large effect (Cohen, 1988) of FS type on spectral power throughout the experiment (p = 0.007, η2p = 0.220). To specify which FS type differed on which stimulus presentation,
differences were assessed through a MANOVA for which significance was corrected to p ≤ 0.033 for the univariate ANOVAs and p ≤ 0.027 for multiple comparisons. Analyses revealed differences between study groups on first stimulus presentation (p < 0.019, η2p = 0.180).
Multiple comparisons showed that children with CP FS showed a greater increase in spectral power in response to a1 (M estimates = 0.930, SD estimates = 0.192) than those with CUP FS (M estimates = 0.164, SD estimates = 0.173). Low-alpha levels, which did not reach statistical significance (p = 0.070), showed greater increase in children with CP FS compared to those with simple FS (M estimates = 0.509, SD estimates = 0.120). Similarly, while children with simple FS showed a greater increase in response a1 than those with CUP FS, this difference was not found to be significant.
There were no significant differences for a2 (p = 0.636, η2
p = 0.022), nor a3 following
correction for multiple comparisons (p = 0.036, η2p = 0.153). Owing to the near significant alpha
and large effect size (Cohen, 1988) for differences in response to a3, multiple comparisons a3 were described as well. They suggested children with CP FS showed decreased spectral power in response to a3 (M estimates = -0.501, SD estimates = 0.184), while those with CUP FS showed an increase (M estimates = 0.164, SD estimates = 0.166). Children with simple FS had a less steep decrease in spectral power in response to a3 (M estimates = -0.109, SD estimates = 0.115) compared to CP FS, still, they did not differ significantly from neither complex FS groups.
19
3.3.3 Interaction effect of stimulus repetition and febrile seizure type on spectral power There was a significant interaction between seizure duration and stimulus repetition (p = 0.042), meaning the pattern of spectral power in response to stimulus repetition differed between study groups. The effect size for the interaction (η2p = 0.115) was moderate (Cohen, 1988).
Specifically, the change from first to third stimulus presentation (a1 vs a3) was significantly different between FS type (p = 0.009, η2p = 0.209), while the change from first to second
stimulus presentation (a1 vs a2) was not (p = 0.116, η2p = 0.102).
For an in-depth interpretation of the interaction, differences in spectral power between a1 vs a3 according to FS type were investigated through an ANOVA, for which significance was corrected to p ≤ 0.017 for multiple comparisons. Changes from first to third stimulus presentation (a1 vs a3) were significantly greater in children with CP FS (M estimates = -1.431,
SD estimates = 0.326) compared to those with CUP FS (M estimates = 0.001, SD estimates =
0.295). Children with simple FS showed a difference (M estimates = -0.618, SD estimates = 0.204) that was less steep than children with CP FS and greater than children with CUP FS, although neither differences were found significant after correction for multiple comparisons. These group differences are shown in Figure 4B.
Finally, univariate repeated measures ANOVA were applied separately for each study group, using planned contrasts (a1 vs a2, a1 vs a3) to investigate specific patterns of responses per FS type (Howell, 2009). Significance was corrected at p ≤ 0.033 for each ANOVA. Separate patterns per FS groups are shown in Figure 4C. Analyses on children with simple FS (p < 0.001,
η2
p = 0.424) and on those with CP FS (p = 0.003, η2p = 0.512) show a significant effect of
stimulus repetition with a large effect size (Cohen, 1988). Although a large effect size was found for the CUP FS group as well, it was not significant (p = 0.062, η2
p = 0.243). More precisely,
both children with simple FS and CP FS showed an increase in power to a1, followed by a significant decrease at a2 (p ≤ 0.15) and a3 (p ≤ 0.14). Meanwhile, children with CUP FS show an increase at a1 followed by a near significant decrease on a2 (p = 0.068, η2p = 0.296), however
they barely show differences in spectral power between a1 and a3 (p = 0.998, η2p < 0.001). 3.4 Supplementary analyses
Pearson’s bivariate correlations revealed neither age at first FS (p ≥ 0.229), nor the time between the last FS episode and EEG recording (p ≥ 0.285) were significantly associated with spectral power differences included in the planned contrast (a1 - a2, a1 - a3).
20 4. Discussion
This study aimed at investigating functional abnormalities using EEG in children with history of complex FS, knowing that these abnormalities could be associated with the development of auditory learning capacities. Functional abnormalities were assessed using TF analyses of a stimulus repetition paradigm, focussing on fronto-central responses in slow frequencies. Our analyses on the overall sample showed a RS pattern, as suggested by brain responses in early-childhood in slow frequencies (3-6 Hz) that decreased in response to repeated stimuli. Although no significant differences after correction for multiple comparisons were found between children with simple FS and both complex FS groups, low alpha levels and large effect sizes suggest these results are still relevant (Dahiru, 2008). Using children with simple FS as a comparative sample with an overall control-like brain activity pattern, as confirmed through preliminary analyses, our analyses showed brain activity patterns in children with complex FS differs from normal patterns. Importantly, our results uncovered opposite brain activity patterns to a habituation task in children with CP and CUP FS. Precisely, children with CP FS showed a RS pattern marked by enhanced activity at first stimulus presentation, while children with CUP FS did not show a significant RS effect.
Descriptive and preliminary statistics suggest group differences in spectral power cannot be explained by developmental characteristics. Finally, our results did not support age at first FS and time between FS and testing to be associated with changes in spectral power throughout the experiment. These results echo past studies showing no changes in cognitive deficits through time in the first year following CP FS (Martinos et al., 2013). Interestingly, authors suggested that lack of relationship between the time since the FS and cognitive prognosis may signal premorbid abnormalities.
4.1 Overall FS sample shows the excepted RS pattern
Both the selected ROI (Orekhova et al., 1999; Stroganova et al., 1998; Summerfield et al., 2011) and TFW (Orekhova et al., 1999; Stroganova and Orekhova, 2013; Stroganova et al., 1998; Summerfield et al., 2011) were coherent with the literature. On average, the whole sample showed increased spectral power in response to the first stimulus presentation compared to baseline levels, followed by a steep decrease in spectral power in response to the second, and less steep decrease at third stimulus presentation. This pattern is in accordance with the traditional description of the RS pattern (Dehaene-Lambertz and Dehaene, 1994; Nordt et al.,
21
2016). Thus, our experimental task was successful at inducing a RS response in the overall sample. Children with simple FS, which served as a comparison group to those with complex FS, showed a clear RS pattern. Importantly, preliminary analyses show that both mean spectral power at each measurement time, as well as the overall RS pattern in children with simple FS reflects that of healthy, matched controls. RS has been supported as being the neural correlate of habituation, which is a form of implicit learning in early-childhood (Turk-Browne et al., 2008).
4.2 Distinct and opposite changes in brain activity in children with complex FS
An important and novel aspect of our study is that, while assessing changes in RS patterns following complex FS, we uncovered opposite patterns in children with CP and CUP FS. Prolonged FS and febrile Status Epilepticus have been the prime focus of studies assessing cognition and functional deficits following FS (Hesdorffer et al., 2011; Martinos et al., 2012; Nordli et al., 2012), yet, recent studies support children with all types of complex FS show cognitive impairment, as well as mild neurological abnormalities (Tsai et al., 2015; VanLandingham et al., 1998). Importantly, while clinical assessment may identify common premorbid characteristics and post-seizure consequences in all school-aged children with past complex FS, opposite brain activity patterns suggest both populations may present with different functional or structural abnormalities according to their FS type. Hence, these opposite patterns could be of significance to understand factors leading to complex FS and their prognosis, depending on complex FS type. Notably, considering the nature of the task used, we suggest that these opposite brain activity patterns could act as different underlying mechanisms associated with the cognitive impairments past studies have identified in children with different types of complex FS.
First, although children with CP FS show unaltered RS patterns, a much greater increase in spectral power in response to the first stimulus presentation was found compared to other study groups. Such increase may be indicative of brain hyperexcitability. Coherently, rodent models show that prolonged FS are associated with a permanent increase in hippocampal excitability (Chen et al., 2001; Chen et al., 1999; Dubé et al., 2000). Studies suggest the mechanisms underlying brain hyperexcitability lead to seizure vulnerability, as well as cognitive impairments (Brooks‐Kayal, 2011; Holmes, 2015; Uhlhaas and Singer, 2006). For instance, high-order cognitive processes (Riedel et al., 2003) and increased vulnerability to seizures
22
(Cornejo et al., 2007; Sanchez et al., 2001; Sogawa et al., 2001; Zhang et al., 2004) are involved with excitatory neurotransmission. Moreover, increased activity specifically in slow frequency bands has been described in people with epilepsy (Coutin-Churchman et al., 2003), as well as in people with executive deficits (Snyder and Hall, 2006). Therefore, brain hyperexcitability could be a common defect, contributing to both seizure susceptibility and, potentially, future cognitive impairments in this study group. Coherently, this group had higher seizure recurrence than children with simple and CUP FS. Studies suggest neurological and cognitive abnormalities uncovered after the first CP FS episode could be pre-existing and subsequently exacerbated by seizures (Martinos et al., 2013; Scott et al., 2006). Hence, brain hyperexcitability may be premorbid to the first CP FS episode, predisposing children to recurrent and prolonged seizures. Still, whether brain hyperexcitability was premorbid or the cause of CP FS is beyond the scope of this study and should be the subject of future research.
On the other hand, children with CUP FS were characterized by an impaired RS pattern. They showed persistent activation in response to familiar stimuli, suggesting that they continued to treat them as novel. RS has consistently been described as a neural correlate of learning through habituation, through sharpening stimulus representation in the brain (Turk-Browne et al., 2008; Wiggs and Martin, 1998). In that context, reduced signal could represent a more robust response carried out by fewer neurons, as opposed to a diffuse response in broad neural populations (Ranganath and Rainer, 2003). Interestingly, impaired neural habituation using other paradigms has been identified in adults with epilepsy and was suggested to be the cause of seizures (Rogozea et al., 1995). Still, although impaired RS should not lead to seizure vulnerability, future studies could investigate whether these alterations were premorbid. Meanwhile, alterations specific to theta oscillations may impact learning and memory mechanisms (Buzsáki and Draguhn, 2004). Hence, impaired RS and abnormal theta activity in children with CUP FS could indicate immature learning development in this population, echoing limited learning capacities shown in school-aged children with complex FS. Still, this hypothesis has yet to be empirically confirmed.
Whether the differences in brain activity we uncovered lead to future measurable cognitive deficits in children with complex FS cannot be confirmed through this study. Our own descriptive analyses did not support group differences regarding cognitive development. These results are coherent with studies showing no deficits on the cognitive scale of the BSID
23
following neither FS nor febrile Status Epilepticus (Ellenberg and Nelson, 1978; Hesdorffer et al., 2011). More importantly, we did not show relationships between differences in brain activity and cognitive development, supporting that learning capacities evaluated by the RS paradigm cannot be behaviorally measured using the BSID. The BSID is a broad measure of cognitive development that has poor predictive power on high-order cognitive functions (Anderson and Burnett, 2017). Yet, validated tools available to evaluate high-order cognitive functions in our age-range, that would corroborate our hypothesis of a link between differences in brain activity and cognitive prognosis, are lacking (Anderson and Reidy, 2012). Thus, although the changes in brain activity we reported have previously been associated to cognitive development and prognosis (Riedel et al., 2003; Turk-Browne et al., 2008), this hypothesis cannot be confirmed through our study.
Finally, factors other than FS type, that were not evaluated, may have influenced RS patterns. Notably, although we evaluated RS as an automatic response, overt attention may modulate the response pattern (Eger et al., 2004; Yi and Chun, 2005). Interestingly, attentional deficits have been identified in school-aged children with complex FS (Nilsson et al., 2019) and could have affected the RS pattern.
4.3 Study design and limits
This study was conducted on a total sample size large enough to find moderate effect sizes given our main hypothesis. However, unequal sample size lead to possible loss of statistical power. Furthermore, small sample size for complex FS groups and large variance in spectral power led to large confidence intervals. Hence, hypothesis and contrasts were, as much as possible, specified through past literature and confirmed through preliminary analyses to maximize statistical power. Assumptions necessary to conduct our analyses were satisfied, leading to interesting statistically significant and sound results. Lastly, although corrective measures and conservative alpha estimates were applied to limit false positives, such measures may have increased our chances of false negatives (Perneger, 1998). Thus, in accordance with statistical recommendations, data interpretation was not only based on statistical significance, but also on effect size (Dahiru, 2008), leading to results relevant to our hypothesis. Still, future studies with larger sample size are needed to investigate the impact of complex FS on other ROI or frequency bands.
24
A strength of our study was the use of children with simple FS as a comparison group. Studies show children with simple FS show unaltered neurological and cognitive development (Baumann and Duffner, 2000; Hesdorffer et al., 2011; Martinos et al., 2012; Schiottz‐ Christensen and Bruhn, 1973; Shinnar and Glauser, 2002; Visser et al., 2012). Children with simple FS provide a better normative sample to children with complex FS than healthy controls do. First, they may have similar genetic background, which includes increased risks of neurodevelopmental disorders (Vestergaard and Christensen, 2009). Moreover, they have similar history of minor illnesses and hospital visits which is not guaranteed using a healthy control group. Still, using preliminary analyses, we confirmed that children in our simple FS group showed mean spectral power per stimulus presentation and an overall RS pattern that was comparable to sex and age matched controls, thus supporting changes in brain activity should not be associated with a history of simple FS. Moreover, these preliminary analyses support the differences in pattern found in children with complex FS as abnormal. Nevertheless, as corrected analyses fail to identify differences between children with simple FS and complex subtypes, a greater and equal sample size could confirm this hypothesis.
Another asset from our study design was the investigation of changes activity in children with CP and CUP separately. As children with CP FS have been the prime focus of past studies on FS prognosis (Hesdorffer et al., 2011), our results on children with CUP FS provided valuable insights on a pattern of brain activity typically associated with auditory learning processes. However, due to small sample size and overlapping complex features, we were unable to study children with focal and multiple FS separately. Hence, future studies are needed to investigate distinct changes in brain activity in children with all subtypes of complex FS. Moreover, studies of neurological development following FS suggest stable, non-acute alterations in the months following the episode, which can however worsen as years pass (Farrow et al., 2006). Hence, since our evaluations were conducted relatively shortly after the episode, future studies should investigate if these functional alterations evolve with time, and how they may relate to worsened cognitive abilities.
Finally, some factors may limit the generalisability of our results. More precisely, although FS may be associated with increased neurodevelopmental disorders incidence, our exclusion criteria may limit the generalisability of our results to children that are either neurotypical or with milder deficits. Furthermore, high average SES in our studied families and
25
recruitment conducted in a large metropolitan area may impose further limits. Lastly, both environmental and personality factors could have led families to decline to participate or fully complete all questionnaires. These factors cannot be assessed, still they could have an impact on interpretation of the results.
5. Conclusion
There has been consistent evidence of mild cognitive deficits in high-order functions in school-aged children with complex FS. Functional differences in the brain activity of children with complex FS has been described as well, and researchers have suggested a link between these functional differences and the cognitive prognosis of complex FS. Our study supports the existence of differences in brain activity in children with complex FS. Importantly, our study shows distinct patterns depending on whether complex FS were prolonged or not, suggesting different structural and functional abnormalities depending on complex FS type. Although we suggest that these differences in brain activity could act as distinct underlying mechanisms associated with seizure vulnerability and cognitive prognosis in these populations, they could be linked to other clinical features of complex FS as well. Hence, the next steps would involve clarifying the link between the functional abnormalities we identified and their clinical impact on children with complex FS. Importantly, as our study shows functional differences are already present in the months after the first FS episode, a greater understanding of their role in complex FS characteristics and prognosis could lead to early clinical care. Notably, electrophysiological differences could be used as a predictive biomarker for complex FS prognosis.
26
References
American Academy of Pediatrics, 2011. Neurodiagnostic evaluation of the child with a simple febrile seizure. Pediatrics 127, 389.
Anderson, P.J., Burnett, A., 2017. Assessing developmental delay in early childhood—concerns with the Bayley-III scales. The Clinical Neuropsychologist 31, 371-381.
Anderson, P.J., Reidy, N., 2012. Assessing executive function in preschoolers. Neuropsychology Review 22, 345-360.
Basirat, A., Dehaene, S., Dehaene-Lambertz, G., 2014. A hierarchy of cortical responses to sequence violations in three-month-old infants. Cognition 132, 137-150.
Baumann, R.J., Duffner, P.K., 2000. Treatment of children with simple febrile seizures: the AAP practice parameter. Pediatric neurology 23, 11-17.
Bayley, N., Reuner, G., 2006. Bayley scales of infant and toddler development: Bayley-III. Harcourt Assessment, Psych. Corporation.
Berg, A.T., Shinnar, S., 1996. Complex febrile seizures. Epilepsia 37, 126-133.
Brooks‐Kayal, A., 2011. Molecular mechanisms of cognitive and behavioral comorbidities of epilepsy in children. Epilepsia 52, 13-20.
Buzsáki, G., Draguhn, A., 2004. Neuronal oscillations in cortical networks. Science 304, 1926-1929.
Chen, K., Aradi, I., Thon, N., Eghbal-Ahmadi, M., Baram, T.Z., Soltesz, I., 2001. Persistently modified h-channels after complex febrile seizures convert the seizure-induced enhancement of inhibition to hyperexcitability. Nature medicine 7, 331.
Chen, K., Baram, T.Z., Soltesz, I., 1999. Febrile seizures in the developing brain result in persistent modification of neuronal excitability in limbic circuits. Nature Medicine 5, 888-894.
Cohen, J., 1988. Statistical power analysis for the behavioral sciences, 2nd ed. Lawrence Erlbaum, New Jersey.
Cornejo, B.J., Mesches, M.H., Coultrap, S., Browning, M.D., Benke, T.A., 2007. A single episode of neonatal seizures permanently alters glutamatergic synapses. Annals of Neurology 61, 411-426.
27
Coutin-Churchman, P., Anez, Y., Uzcategui, M., Alvarez, L., Vergara, F., Mendez, L., Fleitas, R., 2003. Quantitative spectral analysis of EEG in psychiatry revisited: drawing signs out of numbers in a clinical setting. Clinical Neurophysiology 114, 2294-2306.
Dahiru, T., 2008. P-value, a true test of statistical significance? A cautionary note. Annals of Idaban posgraduate medicine 6, 21-26.
Dehaene-Lambertz, G., Dehaene, S., 1994. Speed and cerebral correlates of syllable discrimination in infants. Nature 370, 292.
Dehaene-Lambertz, G., Montavont, A., Jobert, A., Allirol, L., Dubois, J., Hertz-Pannier, L., Dehaene, S., 2010. Language or music, mother or Mozart? Structural and environmental influences on infants’ language networks. Brain and Language 114, 53-65.
Dehaene-Lambertz, G., Pena, M., 2001. Electrophysiological evidence for automatic phonetic processing in neonates. Neuroreport 12, 3155-3158.
Delorme, A., Makeig, S., 2004. EEGLAB: an open source toolbox for analysis of single-trial EEG dynamics including independent component analysis. Journal of neuroscience methods 134, 9-21.
Dobbins, I.G., Schnyer, D.M., Verfaellie, M., Schacter, D.L., 2004. Cortical activity reductions during repetition priming can result from rapid response learning. Nature 428, 316. Dubé, C., Chen, K., Eghbal-Ahmadi, M., Brunson, K., Soltesz, I., Baram, T.Z., 2000. Prolonged
febrile seizures in the immature rat model enhance hippocampal excitability long term. Annals of Neurology 47, 336.
Eger, E., Henson, R., Driver, J., Dolan, R.J., 2004. BOLD repetition decreases in object-responsive ventral visual areas depend on spatial attention. Journal of Neurophysiology 92, 1241-1247.
Ellenberg, J.H., Nelson, K.B., 1978. Febrile seizures and later intellectual performance. Archives of neurology 35, 17-21.
Farrow, T.F., Dickson, J.M., Grunewald, R.A., 2006. A six-year follow-up MRI study of complicated early childhood convulsion. Pediatric neurology 35, 257-260.
Gotts, S.J., Chow, C.C., Martin, A., 2012. Repetition priming and repetition suppression: A case for enhanced efficiency through neural synchronization. Cognitive Neuroscience 3, 227-237.
28
Grill-Spector, K., Henson, R., Martin, A., 2006. Repetition and the brain: neural models of stimulus-specific effects. Trends in Cognitive Sciences 10, 14-23.
Grünewald, R.A., Farrow, T., Vaughan, P., Rittey, C.D., Mundy, J., 2001. A magnetic resonance study of complicated early childhood convulsion. Journal of Neurology, Neurosurgery & Psychiatry 71, 638-642.
Harrison, P., Oakland, T., 2003. Adaptive behavior assessment system (ABAS-II). San Antonio, TX: The Psychological Corporation.
Hesdorffer, D., Benn, E., Bagiella, E., Nordli, D., Pellock, J., Hinton, V., Shinnar, S., 2011. Distribution of febrile seizure duration and associations with development. Annals of Neurology 70, 93-100.
Hesdorffer, D., Caplan, R., Berg, A., 2012. Familial clustering of epilepsy and behavioral disorders: evidence for a shared genetic basis. Epilepsia 53, 301-307.
Holmes, G.L., 2015. Cognitive impairment in epilepsy: the role of network abnormalities. Epileptic Disorders 17, 101-116.
Howell, D.C., 2009. Statistical methods for psychology. Cengage Learning.
International League Against Epilepsy, 1993. Guidelines for epidemiologic studies on epilepsy. Commission on Epidemiology and Prognosis, International League Against Epilepsy. Epilepsia 34.
Karnam, H.B., Zhou, J.-L., Huang, L.-T., Zhao, Q., Shatskikh, T., Holmes, G.L., 2009. Early life seizures cause long-standing impairment of the hippocampal map. Experimental neurology 217, 378-387.
Kim, H., 2017. Brain regions that show repetition suppression and enhancement: A meta‐ analysis of 137 neuroimaging experiments. Human brain mapping 38, 1894-1913. Kipp, K.H., Mecklinger, A., Becker, M., Reith, W., Gortner, L., 2010. Infant febrile seizures:
Changes in declarative memory as revealed by event-related potentials. Clinical Neurophysiology 121, 2007-2016.
Leaffer, E.B., Hinton, V.J., Hesdorffer, D.C., 2013. Longitudinal assessment of skill development in children with first febrile seizure. Epilepsy & Behavior 28, 83-87.
Lega, B.C., Jacobs, J., Kahana, M., 2012. Human hippocampal theta oscillations and the formation of episodic memories. Hippocampus 22, 748-761.
29
Lippé, S., Roy, M.S., Arcand, C., Scantlebury, M.H., Carmant, L., Lassonde, M., 2009. Altered EEG spectral activity and attentional behavioral deficits following prolonged febrile seizures: a pilot study. Epileptic Disorders 11, 10-19.
Makeig, S., 1993. Auditory event-related dynamics of the EEG spectrum and effects of exposure to tones. Electroencephalography & Clinical Neurophysiology 86, 283-293.
Martinos, M.M., Yoong, M., Patil, S., Chin, R.F., Neville, B.G., Scott, R.C., de Haan, M., 2012. Recognition memory is impaired in children after prolonged febrile seizures. Brain : a journal of neurology 135, 3153-3164.
Martinos, M.M., Yoong, M., Patil, S., Chong, W.K., Mardari, R., Chin, R.F., Neville, B.G., de Haan, M., Scott, R.C., 2013. Early developmental outcomes in children following convulsive status epilepticus: a longitudinal study. Epilepsia 54, 1012-1019.
Nilsson, G., Westerlund, J., Fernell, E., Billstedt, E., Miniscalco, C., Arvidsson, T., Olsson, I., Gillberg, C., 2019. Neurodevelopmental problems should be considered in children with febrile seizures. Acta Paediatrica.
Nordli, D.R., Jr., Moshe, S.L., Shinnar, S., Hesdorffer, D.C., Sogawa, Y., Pellock, J.M., Lewis, D.V., Frank, L.M., Shinnar, R.C., Sun, S., 2012. Acute EEG findings in children with febrile status epilepticus: Results of the FEBSTAT study. Neurology 79, 2180-2186. Nordt, M., Hoehl, S., Weigelt, S., 2016. The use of repetition suppression paradigms in
developmental cognitive neuroscience. Cortex 80, 61-75.
Offringa, M., Bossuyt, P.M., Lubsen, J., Ellenberg, J.H., Nelson, K.B., Knudsen, F.U., Annegers, J.F., El-Radhi, A.S.M., Habbema, J.D.F., Derksen-Lubsen, G., 1994. Risk factors for seizure recurrence in children with febrile seizures: a pooled analysis of individual patient data from five studies. The Journal of pediatrics 124, 574-584.
Orekhova, E.V., Stroganova, T.A., Posikera, I.N., 1999. Theta synchronization during sustained anticipatory attention in infants over the second half of the first year of life. International Journal of Psychophysiology 32, 151-172.
Patel, N., Ram, D., Swiderska, N., Mewasingh, L.D., Newton, R.W., Offringa, M., 2015. Febrile seizures. The British Medical Journal 351, h4240.
Perneger, T.V., 1998. What's wrong with Bonferroni adjustments. British medical journal 316, 1236-1238.
30
Plank, M., 2013. Downloads & support ocular correction ICA. Brain : a journal of neurology 49, 1-4.
Ranganath, C., Rainer, G., 2003. Cognitive neuroscience: Neural mechanisms for detecting and remembering novel events. Nature Reviews Neuroscience 4, 193.
Riedel, G., Platt, B., Micheau, J., 2003. Glutamate receptor function in learning and memory. Behavioral Brain Research 140, 1-47.
Rigoulot, S., Delplanque, S., Despretz, P., Defoort-Dhellemmes, S., Honoré, J., Sequeira, H., 2008. Peripherally presented emotional scenes: a spatiotemporal analysis of early ERP responses. Brain Topography 20, 216.
Rogozea, R., Florea-Ciociou, V., Hategan, D., 1995. Habituation of orienting reaction in therapy-resistant partial epilepsy. Revue Roumaine de Neurologie et Psychiatrie 33, 7-27. Roper, S.N., 2016. Early Life Seizures and Learning Impairment: Neither the Time nor the
Place. EBioMedicine 7, 19-20.
Sanchez, R.M., Koh, S., Rio, C., Wang, C., Lamperti, E.D., Sharma, D., Corfas, G., Jensen, F.E., 2001. Decreased glutamate receptor 2 expression and enhanced epileptogenesis in immature rat hippocampus after perinatal hypoxia-induced seizures. Journal of Neuroscience 21, 8154-8163.
Sankoh, A.J., Huque, M.F., Dubey, S.D., 1997. Some comments on frequently used multiple endpoint adjustment methods in clinical trials. Statistics in Medicine 16, 2529-2542. Sapir, D., Leitner, Y., Harel, S., Kramer, U., 2000. Unprovoked seizures after complex febrile
convulsions. Brain and Development 22, 484-486.
Schiottz‐Christensen, E., Bruhn, P., 1973. Intelligence, behaviour and scholastic achievement subsequent to febrile convulsions: an analysis of discordant twin‐pairs. Developmental Medicine & Child Neurology 15, 565-575.
Scott, R.C., King, M.D., Gadian, D.G., Neville, B.G., Connelly, A., 2006. Prolonged Febrile Seizures are Associated with Hippocampal Vasogenic Edema and Developmental Changes. Epilepsia 47, 1493-1498.
Shinnar, S., Glauser, T.A., 2002. Febrile seizures. Journal of Child Neurology 17, S44-S52. Snyder, S.M., Hall, J.R., 2006. A meta-analysis of quantitative EEG power associated with