an author's
https://oatao.univ-toulouse.fr/22764
https://doi.org/10.1016/j.sab.2019.01.008
Chide, Baptiste and Maurice, Sylvestre and Murdoch, Naomi and Lasue, Jérémie and Bousquet, Bruno and Jacob,
Xavier and Cousin, Agnès and Forni, Olivier and Gasnault, Olivier and Meslin, Pierre-Yves and Fronton, Jean-François
and Bassas-Portús, Marti and Cadu, Alexandre and Sournac, Anthony and Mimoun, David and Wiens, Roger C.
Listening to laser sparks: a link between Laser-Induced Breakdown Spectroscopy, acoustic measurements and crater
morphology. (2019) Spectrochimica Acta Part B: Atomic Spectroscopy, 153. 50-60. ISSN 0584-8547
Listening to laser sparks: a link between Laser-Induced Breakdown
Spectroscopy, acoustic measurements and crater morphology
Baptiste Chide
a,b,⁎, Sylvestre Maurice
b, Naomi Murdoch
a, Jérémie Lasue
b, Bruno Bousquet
c,
Xavier Jacob
d, Agnès Cousin
b, Olivier Forni
b, Olivier Gasnault
b, Pierre-Yves Meslin
b,
Jean-François Fronton
e, Marti Bassas-Portús
a, Alexandre Cadu
a, Anthony Sournac
a,
David Mimoun
a, Roger C. Wiens
faInstitut Supérieur de l'Aéronautique et de l'Espace (ISAE-SUPAERO), Université de Toulouse, 31400 Toulouse, France bIRAP-CNRS, Université Toulouse III, 31400 Toulouse, France
cUniversité de Bordeaux, CELIA, CNRS UMR 5107, 33400 Talence, France dIMFT – CNRS, Université Toulouse III, 31400 Toulouse, France eCentre National d'Etudes Spatiales (CNES), 31400 Toulouse, France fLos Alamos National Laboratory, Los Alamos, NM 87545, USA
Keywords: SuperCam Mars Microphone LIBS Acoustic Shock-waves Depth profile Crater morphology Ablated volume A B S T R A C T
In preparation for the SuperCam/Mars Microphone scientific investigation, the acoustic signal associated with the plasma formation during Laser-Induced Breakdown Spectroscopy (LIBS) experiment is studied with regard to the shot-to-shot evolution of the laser induced crater morphology and plasma emission lines. A set of geological targets are depth profiled using a specifically designed LIBS setup coupled with acoustic test bench under am-bient terrestrial atmosphere. Experiments confirm that the decrease of the acoustic energy as a function of the number of shots is well correlated with the target hardness/density and also demonstrate that the acoustic energy can be used as a remote tracer of the ablated volume of the target. Listening to LIBS sparks provides a new information relative to the ablation process that is independent from the LIBS spectrum.
1. Introduction
Laser-Induced Breakdown Spectroscopy (LIBS) is an analytical technique that can remotely measure abundances of chemical elements in fluids and solids. This fast, precise, accurate, and non-intrusive method allows LIBS to be used in multiple applications in the lab and in situ to monitor aerosols in gas, study the contamination of soils, probe the level of radioactive elements [1] and more recently, to help space exploration by the study of planetary surfaces, to name only a few.
The LIBS technique was used for the first time in planetary ex-ploration in 2012 as part of the ChemCam investigation onboard the NASA Curiosity rover [2,3]. Since landing at Gale crater, ChemCam has fired more than 600,000 laser shots on targets at distances of 1.5 m up to 9 m from the instrument. The typical measurement sequence consists of a series of 30 shots at the same point on a target. When firing the laser 150 times or more at the same location, ChemCam also has the capability to probe rocks at depth in order to study alteration rinds and coatings [4]. However, the evolution of the depth that is reached as a
function of the number of shots cannot be a priori determined on Mars from ChemCam measurements. The issue was briefly addressed in the laboratory only for two solid samples: a dolomite sandstone and a pressed pellet of Martian soil analog [5]. For these two types of target, the laser ablates ~400 μm after 300 shots with a rapid growth of the crater for the first 100 shots followed by a low ablative regime to reach the maximal depth. Nevertheless the number of targets tested and the small variety of there physical properties make difficult the extrapola-tion to other geological targets on Mars.
As an advancement of the ChemCam design, the SuperCam instru-ment suite selected for the NASA Mars 2020 rover will use LIBS but with the addition of Raman Spectroscopy and Visible and Infrared Reflectance Spectroscopy to determine the elemental composition and mineralogy of Mars soils and rocks [6]. The LIBS investigation will be supported by the Mars Microphone that will record LIBS shock-waves at distances up to 4 m [7]. The Mars Microphone and its associated elec-tronics were designed and tested to record audio signals from 100 Hz to 10 kHz, a bandwidth that includes LIBS shock-waves but also natural ⁎Corresponding author.
E-mail address:[email protected](B. Chide).
atmospheric phenomena such as wind [8].
In LIBS, a short, focused laser pulse interacts with the target under high irradiance condition (irradiance > 10 MW/mm2) over a small area (a 300 µm to 500 μm spot in diameter for SuperCam) leading to ma-terial vaporization. The resulting plasma expands into the surrounding gas, faster than the speed of sound and generates a shock-wave [9]. Number of previous studies have proved that the LIBS shock-wave carries relevant information about the amount of laser energy absorbed by the target (laser-matter interaction) and about the plasma plume expansion. By recording the LIBS shock-wave, Conesa et al. [10] showed that the acoustic energy follows linearly the laser irradiance starting from low levels. A slope change for higher irradiances is also believed to indicate different plasma formation dynamics suggesting that the shock-wave recording is an efficient tool to monitor the plasma formation and evolution. It has also been proved that the conversion efficiency between incident laser beam and shock-wave energy can be estimated using a blast-wave theoretical model [11,12]. Therefore, the study of the LIBS shock-wave gives insight into the coupling between the laser and the matter. Krasniker et al. [13] further extended this relationship between laser-matter interaction and the shock-wave ve-locity to characterize the physical matrix effect of the targeted sample. More specifically, Abdel-Salam et al. [14] established a correlation between shock-wave velocity and hardness of calcified tissues. As the laser-matter interaction governs the ablation process, Stauter et al. [15] proposed a calibration curve that links the ablation rate on the surface with the shock-wave velocity for a given laser fluence. Furthermore, under some controlled conditions in the laboratory, Chen and Yeung [16], Hrdlička et al. [17] concluded that acoustic data provide a useful tool to normalize LIBS spectra as it can be used to correct LIBS emission lines from shot-to-shot fluctuations. It is a critical step for field appli-cations where operational conditions can vary a lot.
Using multiple shots to penetrate into the sample allows a depth-profile analysis of the target composition. However, as a cavity forms, the characteristics of the laser-sample interactions change, modifying the pulse-to-pulse ablation rate [18]. Moreover, the confinement of the plasma within the cavity modifies its properties (temperature and electron density) with depth [19] and alters the LIBS emission signal [20]. The latter study also showed a modification of the shock-wave propagation geometry from a spherical front when the laser impact occurs on a surface, to a planar front when the laser impact occurs in a crater. This change of the acoustic signal with the depth was also seen by Grad and Možina [21] who used the acoustic energy as an indicator of the crater growth during a depth profile.
Very few publications attempt to correlate the acoustic signal of the laser-induced shock-wave during a depth profile with both the volume of the cavity and the LIBS emission spectra. Chaléard et al. [22] worked on a matrix effect correction method using the acoustic signal as a tracer of the ablated mass for several metallic targets in air at ambient pressure. Using a plasma temperature estimation and the acoustic signal as a normalization factor, this study presented a good correlation between the normalized copper line and the copper concentration (R2= 0.9996). The measurements were averaged over a series of 500 shots, but none of the following were analyzed: the shot-to-shot var-iations of the volume, the shot-to-shot varvar-iations of the acoustic signal and the shot-to-shot variations of emission lines' intensity. More re-cently, as part of the Mars Microphone test campaign, Murdoch et al. [8] characterized the behavior of the LIBS acoustic signal as a function of the number of laser shots in the same crater under a simulated Martian atmosphere at two different plasma-to-microphone distances. Although the decrease of the acoustic energy was attributed to the growth of the crater, its evolution was not monitored. Attempting to determine possible correlations between the acoustic signal and the plasma emission lines was not part of this experimental campaign ei-ther.
Our study compares for the first time the shot-to-shot evolution of the LIBS acoustic signal, the crater volume, and the line emission
intensities during LIBS depth-profile analysis on various geological targets. Although the application to SuperCam on Mars is the objective of the combined LIBS and microphone investigation, this initial study is conducted at ambient pressure to assess the relationships to be expected for these combined measurements. We propose a detailed diagnostic of the ablation process with the help of the LIBS shock-wave recording, and show to what extent acoustic measurements can add com-plementary information to LIBS analytical capabilities.
2. Experimental set-up 2.1. ChemCam replica
The LIBS capability of SuperCam is inherited from the ChemCam instrument onboard the Curiosity rover. To reproduce as closely as possible the instrument characteristics, the ChemCam Mast-Unit Engineering and Qualification Model is used in this study to ablate the targets analyzed with a 5 ns infrared laser pulse. The instrument is cooled to the laser’ optimal operating temperature of −10 °C to reach an energy deposited on the target of ~10 mJ which is of the same order of magnitude as the energy levels reached on Mars with ChemCam and expected for SuperCam. The LIBS spectra are collected at room tem-perature with the ChemCam Body-Unit Engineering Model. The spec-trometers' detectors are not time-gated and the overall plasma spectral emission (including emission lines and continuum emission) is in-tegrated over ~10 ms [23].
2.2. Acoustic test bench under Earth atmosphere
The ChemCam laser is fired inside a homemade anechoïc box de-signed to shield the acoustic signal from the clean room environmental noise and to avoid uncontrolled resonance modes (seeFig. 1(b, c)). The double walls of this 78 × 67 × 88 cm chamber are made of 22 mm thick medium-density fiberboard (750 kg/m3) panels which are sepa-rated by a commercial extruded polystyrene sound insulator 15 mm thick. The inner walls are covered by a pyramidal acoustic foam of polyurethane used to reduce echoes and reverberations inside the test bench. The total height of the foam is 80 mm. The entire test bench is operated under ambient pressure and temperature.
The 1067 nm laser is directed onto a folding mirror that reflects the beam downward through a circular glass window that is mounted on the top of the chamber and is transparent to both the laser beam and plasma light. The analyzed targets are placed on a horizontal foam support at the bottom of the chamber to prevent sound transmission through the structure. Targets are impacted at 0° incident angle by the laser (seeFig. 1(b)). The optical path length between the laser and the targets varies from 1783 mm to 1808 mm depending on the height of the target and its position on the foam support.
The cover of the anechoïc box is equipped with two microphones. First, a SuperCam Mars Microphone (Knowles Electret model EK-23132) from the same batch as the microphone flight model (see
Fig. 1(a)) is used. It is connected to a power supply that delivers 3.3 V needed to power the integrated preamplifier. The microphone sensi-tivity is 22.4 mV/Pa and there is no additional stage of amplification. The second microphone is a calibrated Bruel & Kjaer 41381
8 inch mi-crophone, negatively polarized and connected to a preamplifier. The sensitivity is 31.6 mV/Pa. The signals from the SuperCam and the re-ference microphones are acquired by a portable USB 16-bit oscilloscope (TiePie Handyscope HS4) at 200 kHz. The acquisition system allows continuous time series recordings with no limitation of duration. The two microphones are located on both sides of the window and point downwards to the middle of the sample support. The measured in-clination between the incident laser beam and the line of sight of both microphones does not exceed 20°. The two microphones are located at ~65 cm from the samples.
2.3. Sample preparation and experimental procedure
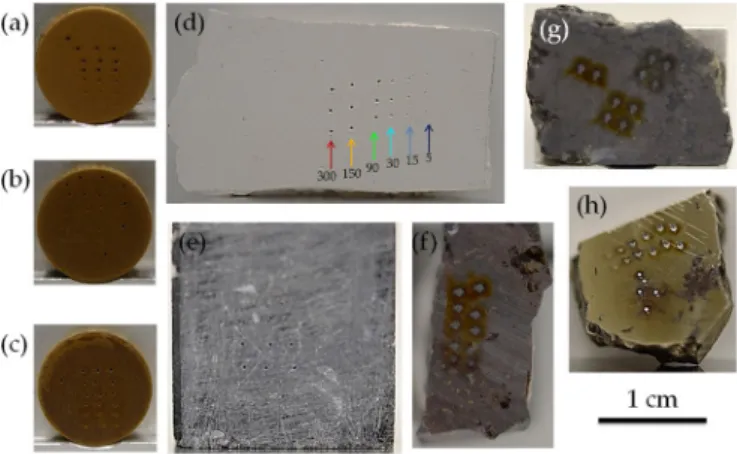
Eight homogeneous samples are prepared and selected to test the influence of basic rock properties with regards to LIBS acoustic signal. The number of targets is small on purpose, with the targets chosen to narrow the number of parameters influencing the laser-target coupling. Among them, three pressed pellets consisted of Johnson Space Center Mars 1 (JSC), a Martian soil simulant [24], sieved with a grain size smaller than 45 μm. These pellets are compacted with a load of 1 ton, 3 tons and 10 tons in order to reach an increasing level of hardness and density (seeFig. 2(a, b, c)). Two calcium-rich targets are also analyzed: a piece of solid calcium-sulfate plaster, referenced as gypsum hereafter, and a rectangular block of black marble (seeFig. 2(d, e)). The three remaining targets are iron-rich (seeFig. 2(f, g, h)): a piece of hematite, a piece of magnetite and a slice of the Chinga meteorite [25]. Hardness measurements were conducted with a Micro Vickers Hardness Tester (Buelher MVK H1) and a summary of the target physical properties is presented inTable 1. One can notice that the density varies the same way than hardness except for the meteorite which is the densest target but has an intermediate hardness.
The laser is fired at 3 Hz after an autofocus was performed in the center of each target. Then, we make series of LIBS pits with different total numbers of shots (5, 15, 30, 90, 150 and 300); each experimental condition is repeated 2 or 3 times depending on the target. LIBS craters obtained with different numbers of shots are annotated with colored
arrows inFig. 2(d). For the JSC pellets and gypsum, all the craters are clearly visible and well defined. The roughness of the black marble makes shallower pits harder to see with a eye. For the iron-rich targets, a halo related to oxidation effects highlights the contours of the craters [26].
2.4. LIBS spectra processing and wavelength calibration
In parallel with sound recording, LIBS spectra are acquired for every laser shot. The ChemCam Body-Unit has three spectrometers collecting the plasma light emission over the UV (240.1 nm–342.2 nm), violet (382.1 nm–469.3 nm), and visible plus near infrared (474 nm–906 nm) ranges [3]. Each spectrum goes through a processing pipeline similar to the one presented in Wiens et al. [23]: subtracting the average passive reflectance spectrum of the target, de-noising, and removing the con-tinuous baseline from Bremsstrahlung and recombination radiations. In Fig. 1. (a) Photos of the Mars Microphone flight model. (b) Schematic of the test bench under Earth atmosphere, MIC: Microphone, SCAM: SuperCam, EGSE: Electrical Ground Support Equipment, REF: reference, oscillo: oscilloscope. (c) Photo illustrating a sample impacted by the ChemCam laser inside the anechoïc box.
Fig. 2. Targets analyzed: (a) JSC-1 Mars simulant powder compacted by 1 ton of pressure, (b) JSC-1, 3 tons of pressure, (c) JSC-1, 10 tons of pressure, (d) gypsum, (e) black marble, (f) hematite, (g) magnetite and (h) Chinga (ataxite iron meteorite). The six craters resulting from an increasing number of shots (see the text for details) are annotated by colored arrows for (d). The scale is the same for all the pictures.
Table 1
Summary of all the samples used in the experiment and their physical prop-erties.
Target Type Density (g/cm3) Vickers Hardness
Gypsum Plaster slice 1.0 3
JSC-1t Pressed pellet 1.3 17
JSC-3t Pressed pellet 1.7 29
JSC-10t Pressed pellet 1.9 46
Black Marble Rock sugar 2.69 177
Magnetite Natural rock 4.75 767
Hematite Natural rock 4.33 1014
Chinga meteorite Slice 7.9 290
300 400 500 600 700 800 900 Wavelength (nm) 0 1000 2000 3000 Tota l counts O N Ca Na H Mg Fe
Fig. 3. Processed LIBS spectra with the continuum emission for the 1 ton compacted JSC target. The blue and red curves are respectively the first and the last spectrum over 300 consecutive shots on the same location. A few peaks are highlighted by dashed lines. (For interpretation of the references to colour in this figure legend, the reader is referred to the web version of this article.)
the case of ChemCam laboratory spectra, it is possible not to remove this baseline. The wavelength calibration is performed by comparison with reference spectra. Two spectra including the continuum emission, are shown inFig. 3for the 1 ton compacted JSC target.
3. Results
3.1. The shot-to-shot variation of the acoustic energy
Fig. 4(a) shows the time series LIBS spark waveform recorded by the SuperCam microphone. A rarefaction follows a compression which corresponds to the passage of the pressure wave through the membrane. Oscillations occurring after the rarefaction are attributed to the re-sonance modes of the membrane. For the SuperCam microphone, the first echo arrives 195 μs after the initial peak, corresponding to an extra travel distance of ~6.6 cm assuming a sound speed of 340 m.s−1. This reflection, linked to the microphone geometry, occurs on the aluminum trapezoidal base at the end of the 3.1 cm long microphone pole (see
Fig. 1(a)). It does not interfere with the primary shock-wave signal and it is attenuated by 19 dB. The second echo, occurring 800 μs after the initial peak, corresponds to a travel distance of 13.6 cm. It is a reflection on the upper wall of the anechoïc box, just above the SuperCam mi-crophone (seeFig. 1(b)) and is strongly attenuated (i.e. by 24 dB) due to the acoustic foam. It may also include a contribution of a reflection occurring on the glass window of the anechoïc box. The signal-to-noise ratio is 54 dB for the SuperCam microphone and for the initial peak.
Fig. 4(b) shows the response of the SuperCam microphone for 150 consecutive laser shots on the same location on the 3 ton compacted JSC target andFig. 4(c) displays their representation in the frequency domain. The duration of the compression and rarefaction waves is 52 ± 2 μs and the signal is broadband, centered around 20–30 kHz which is similar to the characteristics of the waveform measured by Bolaños et al. [27]. The 150 waveforms and spectra are stable and re-producible shot-to-shot but they have a decreasing amplitude with the number of shots at the same location: the sound pressure level ranges from 122 dB re 20 μPa1(corresponding to a peak amplitude of 26.8 Pa) for the first shot of the sequence to 117 dB re 20 μPa (corresponding to a
peak amplitude of 14.6 Pa) for the last shot. Other than the increased amplitude around 50–60 kHz (likely due to the microphone membrane resonance), no obvious spectral signatures are seen within the spectrum confirming that a shock-wave (a dirac pressure profile) is the source of the acoustic signal.Fig. 5compares the median acoustic spectra for the eight targets analyzed. At this moderate frequency resolution resulting from the reduced time window delimited by the grey rectangle in
Fig. 4(b), the spectra do not reveal any particular features and it seems that the nature of the target does not significantly influence the acoustic shape of these acoustic spectra.
Data from the SuperCam microphone and from the reference mi-crophone (both in time and frequency domain) are compared inFig. 6. It shows that the LIBS shock-wave signal recorded by the reference microphone results in a higher peak pressure amplitude and shorter pulse duration (leading to a higher frequency content). Moreover, the pressure front recorded by the reference microphone is sharper than the one observed by the SuperCam microphone. As it was already observed by Qin and Attenborough [28] with a1
8inch and a 1
4inch microphone, this difference is essentially caused by the different bandwidth of the microphones. The SuperCam microphone (10 kHz cut-off frequency)
0 0.1 0.2 0.3 0.4 0.5 0.6 0.7 0.8 0.9 Time (ms) -10 0 10 20
Sound Pressure (Pa)
(a) 104 105 Frequency (Hz) 100 110 120 130 140 S ound Intensit y ( d B ) (c) 1st shot Last shot 0 0.05 0.1 0.15 0.2 0.25 Time (ms) -10 0 10 20 Sound Pressure (P a) (b)
LIBS Shock wave
First Echo
Second Echo
Fig. 4. Typical waveform of a LIBS shock-wave in ambient Earth atmosphere recorded by the SuperCam Microphone (a) on a 3 ton compacted JSC pellet (40thshot over a series of 150 shots). Blue crosses are experimental points interpolated by a smoothing spline (red curve). Evolution of the waveform (b) and acoustic spectrum (c) for a series of 150 consecutive shots on the same location recorded by the SuperCam Microphone. The shaded area represents the time window of integration for the acoustic energy computation. Colour code is the same for (b) and (c). (For interpretation of the references to colour in this figure legend, the reader is referred to the web version of this article.)
104 105
Frequency (Hz)
100 110 120 130 140 150S
o
und Intensity (dB)
Gypsum JSC1t JSC3t JSC10t Black Marble Magnetite Hematite ChingaFig. 5. Median spectra over a series of 150 shots for the 8 targets analyzed.
120log
( )
P P10 0 with P the amplitude of the first peak in Pa and P0= 20μPa, the reference sound pressure.
acts on the shock-wave signal as a stronger low-pass filter than the reference microphone (50 kHz cut-off frequency). Nevertheless, in the followings, only the SuperCam microphone results are reported since the reference microphone leads to the same conclusions.
To study the decrease in amplitude of the acoustic waveform as a function of the number of shots, the integral of the square values of the time series signal during the compression and rarefaction phases (hereafter named the acoustic energy) is computed for each single shot (see shaded area inFig. 4(b) for the integration time window, e.g. Grad and Možina [21]). This parameter is found to follow the same trend as the peak-to-peak amplitude but with a smaller dispersion. Acoustic energy will therefore be used in this study to represent the acoustic signal. Fig. 7(a) shows the evolution of the acoustic energy during a series of 300 laser shots at the same location. For each target, the averaged 5 first acoustic energies range from 7 × 10⁴ Pa2 to 3.1 × 10⁵Pa2. This acoustic energy value of the first shots, that mainly depends on the laser energy, is suspected to be related to target physical and chemical properties but also to the length of the optical path be-tween the laser and the target (that is slightly different for each sample; seeSection 2.3). However this relationship is not clear. Thus, as we are interested in the shot-to-shot variations, the acoustic energy is nor-malized to the average energy of the five first shots. The acoustic energy decreases exponentially with the number of laser shots for the gypsum, the JSC pellets and the black marble. For the hematite and magnetite it increases during the ten first shots and then decreases very slowly. For the hematite target, the acoustic energy decreases by 4% between its maximum value (near the 10thshot) and the 300thshot, whereas for the gypsum it decreases by 93% which corresponds to a sound pressure level loss of 0.2 dB re 20 μPa (1.1 Pa) and 17 dB re 20 μPa (14.6 Pa) respectively. For the Chinga meteorite, the acoustic energy is constant after an increase for the 30 first shots.Fig. 7(b, c) show the variation of
the exponential decay rate as a function of the density and hardness of the targets. The decay rate of the acoustic energy varies the same way than the target density: the lower the density of the target, the larger the slope. It also varies the same way than the target hardness, except for the Chinga meteorite which has an intermediate hardness and an almost constant acoustic energy along the ablation process. However, this single target is not enough to settle whether density or hardness influences the decay rate of the acoustic energy.
The results of this section confirm the trend observed acoustically in Murdoch et al. [8] and noted spectrally for gypsum and other targets in Wiens et al. [23], and extends it over a larger range of densities/ hardnesses and samples. In the former acoustic study, this behavior is attributed to different rates of growth of the LIBS craters. In order to test this hypothesis, we measured the crater depth reached after an increasing number of laser shots.
3.2. LIBS crater morphology
The morphologies of each crater made on the targets are analyzed with a non-contact 3D surface profiler (Sensofar S-NEOX) using con-focal scanning. The resolution is 1 µm along the longitudinal axis and 1.3 μm transversally.Fig. 8shows three examples of contour lines of a typical LIBS crater produced with 300 consecutive laser shots on a 1 ton compacted JSC pellet (a), 10 ton compacted JSC pellet (b) and the black marble (c). The pits have a similar shape, with a diameter of 425 ± 25 μm, similar to measurements conducted on an aluminum plate by Maurice et al. [2]. The maximal depth reached ranges from 370 μm for the black marble to 750 μm for the 1 ton compacted JSC pellet. In the latter example the cavity is deeper than its diameter, meaning that less light is reflected to the detector of the profiler from the bottom of the crater. This leads to a poorly resolved morphology at maximal depth (Fig. 8(a)).
For each of the 18 craters created on these three targets, the mean depth profile is computed in order to visualize the evolution of the crater as a function of the number of shots. It is the result of an average of 18 profiles centered on the barycenter of the crater and equally spaced by angles of 10°. The mean profiles for craters made with 5, 15, 30, 90, 150 and 300 shots on the three former targets are represented in
Fig. 8(d, e, f). Theses figures show that the shape and depth of 3 re-plicates made with the same number of shots and on the same target are very reproducible. The diameter of the crater does not change with depth and does not seem to be a simple function of the target hardness. After only 5 shots, the crater cross-section is already established and does not increase anymore (seeFig. 8(a, b, c)). The crater profile pre-sents a flat floor during the first 30 shots and then, as the depth in-creases, the ablation occurs preferentially in the center leading to a more conical shape. This shape evolution can be explained by the Gaussian distribution of the laser beam and an irradiance level that falls below the ablation threshold when the crater walls become too steep (see calculation details inAppendix A). It is worth noticing that the ablation rate decreases as the number of shots increases: for the 10 ton compacted JSC target, the laser ablated 420 μm depth during the first 150 shots whereas it ablated only 100 depth during the last 150 shots. Moreover, the ablation is more efficient on softer targets: after 300 shots the crater is twice as deep for the 1 ton compacted JSC pellet as for the black marble target (seeFig. 9).
The evolution of the volume of LIBS craters as a function of the number of shots is shown inFig. 9(a). Data from the Chinga is missing because craters present an irregular and rough floor made of melted metal with a depth barely lower than 4 µm for the deepest pit. For the magnetite target, only craters resulting from 90, 150 and 300 laser shots are measured as it was not possible to precisely localize the contours of shallower pits resulting from 5, 15 and 30 laser shots. For each target, the solid line represents the function that best fits all the measured volumes. This figure confirms that the softer the target, the deeper the laser penetrates into the target. This target dependent
0 0.05 0.1 0.15 0.2 0.25 Time (ms) -60 -40 -20 0 20 40 Sound Press ure (Pa) (a) 104 105 Frequency (Hz) 100 110 120 130 140 Sound Intensit y (dB) (b)
Fig. 6. Comparison between LIBS shock-wave recorded by the SuperCam mi-crophone (black; solid line) and by the reference mimi-crophone (grey; dashed line) in the time domain (a) and in the frequency domain (b). Data correspond to the 40th shot over a series of 150 shots on the 3 ton compacted JSC target (same asFig. 4(a)).
ablated volume was already mentioned in Sallé et al. [29], as part of an experiment conducted under Mars atmosphere, where a laser was fired on basalt samples and metallic samples. This behavior was attributed to physical matrix effects but the denser the target was, the smaller the ablated volume. The evolution of the volume as a function of the number of shots is best fitted with a function of the form y = a ln x + bx + c. As it was inferred fromFig. 8(d, e, f), the ablation rate drastically decreases during the first 50 shots and then the volume increases linearly: the ablation rate seems to converge to a constant value, at least within the 300 shots limit that was investigated. This phase of high ablation followed by a low and stable penetration rate after about a hundred of shots was previously noticed in Maurice et al. [5] under Mars atmosphere. It is believed that this decrease comes from a complex loss of coupling between the laser and the crater walls (see
Appendix A). More factors, including changes in plasma properties also contribute to this decrease and are discussed inSection 4.
3.3. Acoustic measurements to trace the ablation process
It is impossible to directly measure the depth of the laser pits pro-duced by LIBS on Mars. This knowledge would be valuable as it would help to decipher a variation of the LIBS signal showing changes in plasma parameters due to chemical target stratification with depth, as encountered during a depth profile [e.g. 30,31]. Fig. 10synthesizes results presented in previous sections as a relationship between the acoustic energy and the crater volume; for a given crater, it links the volume of the crater with the acoustic energy of the last shot of the raster that produced the crater. Red points resulting from 300 shots at
the same location reveal deeper craters when the target is softer. A clear linear decrease of the acoustic energy with crater volume can be no-ticed. One remarkable feature is that this decrease appears to be in-dependent of the target hardness or density. This relationship means that the recording of the acoustic energy can be used to monitor the LIBS crater volume reached after a given number of shots. For instance, if the acoustic energy decreases by 60% (i.e., a normalized acoustic energy of 0.4), the ablated volume is 3 × 10⁷± 0.5 × 107μm3. For the deepest crater, a large dispersion in the volume measurement is in-dicative of the difficult crater characterization conditions: the sound is low and a deep crater with steep walls is close to the profiler mea-surement limitations. To explain this linear trend, it can be inferred that a shock-wave generated deeper results from a downgraded laser-matter interaction compared with laser-surface interaction. Therefore, less energy is locally deposited on the target, leading to less vaporized mass [32]. Simultaneously, less energy is released in the blast resulting in a less energetic shock front [33]. This loss of normalized energy with depth is assumed to be, to first order, unrelated to target physical properties. As a consequence, we conclude that the acoustic data re-corded by the microphone can be used as a proxy of the total ablated volume of material for all of the LIBS targets.
4. Discussion
The acoustic behavior during a depth profile is also compared with the shot-to-shot variation of the LIBS spectrum. The total LIBS spectrum intensity and the acoustic energy as a function of the number of shots are represented inFig. 11for the eight analyzed targets. Two different Fig. 7. (a) Variation of the acoustic energy during a series of 300 consecutive shots at the same location for the 8 analyzed targets. Each data set is the average over the 3 (or 2) series of 300 shots repeated over the same target. Each data set is fitted by a decreasing exponential function Ae−Bxwith B the exponential decay constant (solid line). (b) Exponential decay constant of the acoustic energy as a function of the density of the target and (c) as a function of the target hardness. Dotted grey lines are best fits with an exponential function.
behaviors can be discussed. First, for the denser targets (magnetite, hematite and Chinga) the LIBS signal follows the same variation as the acoustic energy. Because the resulting cavity is shallow (ablated vo-lume < 5 × 106μm3 for 300 shots), the change of acoustic energy is relatively low: as the depth-to-diameter ratios of these craters is small, there is no confinement effect that cause modifications of the plasma properties. However, for the five other targets, where the laser
penetrates much more (seeFig. 9(a)), the LIBS spectrum intensity and acoustic energy are not correlated. For the gypsum, the LIBS spectrum intensity is constant during the 70 first shots and then decreases with the number of shots. For the 1 ton compacted JSC, a rapid increase of the LIBS signal is followed by a constant phase then the LIBS spectrum intensity decreases. The same behavior is observed for the 3 ton com-pacted JSC except that the initial increase occurs over the 60 first shots Fig. 8. Iso-depth lines for craters ablated with 300 consecutive laser shots onto 1 ton compacted JSC (a), 10 ton compacted JSC (b), and black marble (c). The black crosses symbolize the geometric center of the pits. Mean profiles of the 18 craters ablated in the 1 ton compacted JSC pellet (d), in the 10 ton compacted JSC target (e) and in the black marble (f). The solid, dotted and dashed lines in (d)–(f) correspond to the 3 occurrences of the craters ablated with the same number of shots.
Fig. 9. Evolution of the ablated volume as a function of the number of laser shots deposited in the crater. The solid line corresponds to the function that best fits all the measured points per target using a linear function for the magnetite (no data below 90 shots, see text for details) and f(x) = a ln x + bx + c for the six other targets.
Fig. 10. Normalized acoustic energy at the bottom of the crater (i.e. last shot acoustic energy) as a function of the cavity volume. Error bars are computed using the 2 or 3 replicate craters with the same number of shots. The colour code represents the number of shots that created the craters.
compared to the 20 first shots for the 1 ton compacted JSC. The de-crease after ∼100 shots is lower than in the 1 ton compacted JSC. For the 10 ton compacted JSC, the LIBS spectrum intensity increases during the first ~ 100 shots and then stays constant. Lastly, for the black marble, only the starting increasing phase is seen. This non monotonic behavior of the LIBS signal is not directly linked with the acoustic en-ergy and could be attributed to a cavity effect that induces different plasma formation conditions. Corsi et al. [20] explains that a plasma confined in a crater is hotter and denser, and consequently presents an enhanced LIBS signal intensity. As the crater grows, this effect competes with the cooling of the plasma by interaction with the crater walls leading to a decrease of the plasma temperature and thus the LIBS emission. Moreover, as the plasma confined inside a crater is denser, the inverse Bremsstrahlung effect shields the plasma and reduces the laser energy deposited on the target. This effect reduces the ablation rate and also tends to reduce the LIBS emission. To a lesser extent, the steep angles of the crater walls reduce the laser-mater coupling as de-scribed inAppendix A. But on the other hand, at these higher local incidence angles, a fraction of the laser beam that reaches the crater wall might be redistributed inside the crater due to multiple reflections
in the crater walls [34]. Then the beam would remain active for further interaction inside the crater. For the five softer targets, the LIBS spectra area evolution is assumed to be governed by these competing effects but a detailed investigation is out of the scope of this study. Nevertheless, the acoustic energy seems to be well correlated with the ablation and less impacted by changes in plasma properties than the LIBS optical signal that is very sensitive to changes in plasma temperature and electron density under terrestrial atmosphere. In the end, results pre-sented in Section 3.1 showed that the acoustic energy gives an in-formation about the ablation that is independent from the inin-formation contained in the LIBS spectrum.
5. Conclusion
As part of the SuperCam/Mars2020 microphone investigation, a detailed study of the relationship between the LIBS acoustic signal, ablated volume and LIBS emission spectrum is performed at ambient pressure on eight different geological samples with varying chemical and physical properties of interest.
Recording the acoustic signal of the LIBS shock-wave shows that Fig. 11. Variation of the acoustic energy (black) and the LIBS signal (spectrum area; grey) as a function of the number of shots for the 8 analyzed targets.
only the amplitude of the signal decreases as a function of the number of shots during a depth profile, while the acoustic waveform remains the same. This decrease is steeper for softer/less dense targets and the exponential decay rate of the acoustic energy is controlled by target hardness and density.
The measurement of crater morphology after a given number of shots in the same location reveals that the crater shape and depth is quite reproducible for the same target and the same number of shots. However, the penetration depth depends on the target hardness/den-sity: the softer the target is, the deeper the laser ablates it. The evolu-tion of the crater volume as a funcevolu-tion of the number of shots shows that the ablation rate decreases drastically during a depth profile be-cause of a decrease in laser-matter interaction. Our experiments also exhibit a linear relationship between the normalized acoustic energy and the ablated volume. It demonstrates that the acoustic energy can be used as a tool to monitor the ablated volume regardless of the physical properties of the target, a piece of information not provided by the analysis of the LIBS spectra. This demonstrates that the Mars Microphone will add valuable new data to study of the thicknesses of coatings and alteration layers with the LIBS capability of SuperCam.
Lastly, the acoustic energy is confirmed to be a reliable indicator of the ablation, and provides a complementary information that can not be derived from the analysis of the LIBS spectrum.
These initial results using acoustics to infer target hardness and LIBS crater volume are promising and show the potential of acoustic data for LIBS investigations on Mars and elsewhere. Future work will con-solidate these findings by quantifying the influence of target physical properties on acoustic energy with a more exhaustive set of re-presentative geological samples. As the goal is to operate the micro-phone on the surface of Mars, this study is currently extended to de-termine the applicability of these conclusions to LIBS at Martian atmospheric pressure.
Acknowledgments
This work was funded by CNES and Région Occitanie as part of a PhD thesis. We gratefully acknowledge Guy Perez from CNES for his help with the 3D-surface profiler. The NASA Mars Exploration Program supported some parts (ChemCam body unit, RCW participation). Appendix A. Laser irradiance over the walls of LIBS craters
To explain the evolution of the shape of the crater with increasing numbers of pulses as it is impacted by the laser, we model very simply how the laser energy is distributed over the crater walls and floor. On a planar surface normal to the laser beam, the spatial irradiance distribution of the ChemCam qualification model laser can be approximated as a Gaussian distribution:
= I r( ) I e0 wr
22
02 (A.1)
where I(r) is the irradiance at a distance r from the center of the spot, I0the maximal amplitude of 65 MW/mm2for a target at ~1.8 m from the instrument and w0= 240 μm the characteristic length. All these values are extracted from Rapin [35]. The irradiance threshold to ablate material is of the order of 10 MW/mm2. This simulated laser irradiance profile is represented inFig. A.12.
-400 -200 0 200 400
Distance from spot center (µm) 0 10 20 30 40 50 60 70
Laser Irradiance on surface (MW/mm
2 )
Fig. A.12. Simplified laser irradiance profile for a planar target surface perpendicular to the laser beam at a distance of 1.8 from the laser (blue curve) and approximate irradiance ablation threshold (red dashed line). This Gaussian distribution was simulated using data from Rapin [35] (see in text). (For interpretation of the references to colour in this figure legend, the reader is referred to the web version of this article.)
When a crater forms, the laser beam no longer impacts the surface with an angle of 90° but with an angle that depends on the slope of each single point inside the crater. Therefore, laser power locally deposited on a crater wall is reduced by a factor cosα compared with a normal surface, with α being the local angle between the horizontal and the crater wall.Fig. A.13shows a crater profile resulting from 90 shots in the 10 ton compacted JSC target and its associated attenuation factor. It shows that the interaction reduces significantly over the inclined walls of the crater and is at its maximum on the crater floor which is orthogonal to the laser beam. Multiplying this attenuation factor by the laser irradiance profile gives the level of irradiance reached at each point of the crater. These levels are represented inFig. A.14for six craters, with increasing depth, created on the 10 ton compacted JSC target. It shows that the irradiance level is far above the ablation threshold at the bottom of the crater and decreases on the walls which confirms that the laser ablates preferentially in the center of the pit. For the two first craters, resulting from 5 and 15 shots respectively, the irradiance does not fall below the ablation threshold and the material is vaporized over the entire spot area. Starting with 30 shots, parts of the crater wall fall below the ablation threshold (see black points inFig. A.14). However, the two deepest craters show that portions of the crater wall that are nominally below this threshold are nonetheless ablated. It can also be noted that the threshold value of 10 MW/mm2is dependent on the material but there could be other phenomena at work here, such as erosion or possibly sputtering by material being ejected from the hole.
-300 -200 -100 0 100 200 300
Distance from the center (µm) -250 -200 -150 -100 -50 0 Depth (µ m) 0.4 0.5 0.6 0.7 0.8 0.9 1 Attenuation factor
Fig. A.13. Profile of a crater resulting from 90 shots in the 10 ton compacted JSC target (blue curve). The dashed line corresponds to the data presented inFig. 8(e) and the solid line to the function that best fits the crater profile (a sum of two Gaussian functions). The local angles of the crater (angles against the normal of the crater walls) were computed using the derivative of this fitted function. The red curve symbolizes angle-induced laser beam attenuation factor, computed as the cosine of the local angle. (For interpretation of the references to colour in this figure legend, the reader is referred to the web version of this article.)
-300 -200 -100 0 100 200 300
Distance from the center (µm)
-600 -500 -400 -300 -200 -100 0 100 D epth (µ m) 10 20 30 40 50 60 Irradianc e (MW/mm 2)
Fig. A.14. Computed laser irradiance over craters resulting from 5, 15, 30, 90, 150 and 300 shots on the 10 ton compacted JSC target. Black points present an irradiance level below the nominal ablation threshold of 10 MW/mm2.
References
[1] D.A. Cremers, F.-Y. Yueh, J.P. Singh, H. Zhang, Laser-Induced Breakdown Spectroscopy, Elemental Analysis, American Cancer Society, 2012,https://doi.org/ 10.1002/9780470027318.a0708.pub2.
[2] S. Maurice, R.C. Wiens, M. Saccoccio, B. Barraclough, O. Gasnault, O. Forni, N. Mangold, D. Baratoux, S. Bender, G. Berger, J. Bernardin, M. Berthé, N. Bridges, D. Blaney, M. Bouyé, P. Caïs, B. Clark, S. Clegg, A. Cousin, D. Cremers, A. Cros, L. DeFlores, C. Derycke, B. Dingler, G. Dromart, B. Dubois, M. Dupieux, E. Durand, L. d'Uston, C. Fabre, B. Faure, A. Gaboriaud, T. Gharsa, K. Herkenhoff, E. Kan, L. Kirkland, D. Kouach, J.-L. Lacour, Y. Langevin, J. Lasue, S. Le Mouélic, M. Lescure, E. Lewin, D. Limonadi, G. Manhès, P. Mauchien, C. McKay, P.-Y. Meslin, Y. Michel, E. Miller, H.E. Newsom, G. Orttner, A. Paillet, L. Parès, Y. Parot, R. Pérez, P. Pinet, F. Poitrasson, B. Quertier, B. Sallé, C. Sotin, V. Sautter, H. Séran, J.J. Simmonds, J.-B. Sirven, R. Stiglich, N. Striebig, J.-J. Thocaven, M.J. Toplis, D. Vaniman, The chemcam instrument suite on the mars science laboratory (msl) rover: science objectives and mast unit description, Space Sci. Rev. 170 (2012) 95–166,https://doi.org/10.1007/s11214-012-9912-2.
[3] R.C. Wiens, S. Maurice, B. Barraclough, M. Saccoccio, W.C. Barkley, J.F. Bell, S. Bender, J. Bernardin, D. Blaney, J. Blank, M. Bouyé, N. Bridges, N. Bultman, P. Caïs, R.C. Clanton, B. Clark, S. Clegg, A. Cousin, D. Cremers, A. Cros, L. DeFlores, D. Delapp, R. Dingler, C. D'Uston, M.D. Dyar, T. Elliott, D. Enemark, C. Fabre, M. Flores, O. Forni, O. Gasnault, T. Hale, C. Hays, K. Herkenhoff, E. Kan, L. Kirkland, D. Kouach, D. Landis, Y. Langevin, N. Lanza, F. LaRocca, J. Lasue, J. Latino, D. Limonadi, C. Lindensmith, C. Little, N. Mangold, G. Manhes, P. Mauchien, C. McKay, E. Miller, J. Mooney, R.V. Morris, L. Morrison, T. Nelson, H. Newsom, A. Ollila, M. Ott, L. Pares, R. Perez, F. Poitrasson, C. Provost, J.W. Reiter, T. Roberts, F. Romero, V. Sautter, S. Salazar, J.J. Simmonds, R. Stiglich, S. Storms, N. Striebig, J.-J. Thocaven, T. Trujillo, M. Ulibarri, D. Vaniman, N. Warner, R. Waterbury, R. Whitaker, J. Witt, B. Wong-Swanson, The ChemCam instrument suite on the mars science laboratory (MSL) rover: body unit and com-bined system tests, Space Sci. Rev. 170 (2012) 167–227,https://doi.org/10.1007/ s11214-012-9902-4.
[4] R.C. Wiens, S. Maurice, ChemCam: chemostratigraphy by the first mars microprobe, Elements 11 (2015) 33–38,https://doi.org/10.2113/gselements.11.1.33.
[5] S. Maurice, S.M. Clegg, R.C. Wiens, O. Gasnault, W. Rapin, O. Forni, A. Cousin, V. Sautter, N. Mangold, L.L. Deit, M. Nachon, R.B. Anderson, N.L. Lanza, C. Fabre, V. Payré, J. Lasue, P.-Y. Meslin, R.J. Léveillé, B.L. Barraclough, P. Beck, S.C. Bender, G. Berger, J.C. Bridges, N.T. Bridges, G. Dromart, M.D. Dyar, R. Francis, J. Frydenvang, B. Gondet, B.L. Ehlmann, K.E. Herkenhoff, J.R. Johnson, Y. Langevin, M.B. Madsen, N. Melikechi, J.-L. Lacour, S.L. Mouélic, E. Lewin, H.E. Newsom, A.M. Ollila, P. Pinet, S. Schröder, J.-B. Sirven, R.L. Tokar, M.J. Toplis, C. dUston, D.T. Vaniman, A.R. Vasavada, ChemCam activities and discoveries during the nominal mission of the mars science laboratory in gale crater, mars, J. Anal. Atom. Spectrom. 31 (2016) 863–889,https://doi.org/10.1039/ c5ja00417a.
[6] R.C. Wiens, S. Maurice, F.R. Perez, The supercam remote sensing instrument suite for the mars 2020 rover mission: a preview, Spectroscopy 32 (2017) 50–55 URL
http://www.spectroscopyonline.com/supercam-remote-sensing-instrument-suite-mars-2020-rover-preview.
[7] S. Maurice, R.C. Wiens, W. Rapin, D. Mimoun, X. Jacob, B. Betts, S. Clegg, A. Cousin, O. Gasnault, O. Forni, J. Lasue, P.-Y. Meslin, J.F. Bell, G. Delory, A microphone supporting LIBS investigation on mars, 47thLunar and Planetary Science Conference, The Woodlands, TX, United States, 2016, p. 3044. [8] N. Murdoch, B. Chide, J. Lasue, A. Cadu, A. Sournac, M. Bassas-Portús, X. Jacob,
J. Merrison, J. Iversen, C. Moretto, C. Velasco, L. Parès, A. Hynes, V. Godiver, R. Lorenz, P. Cais, P. Bernadi, S. Maurice, R. Wiens, D. Mimoun, Laser-induced breakdown spectroscopy acoustic testing of the mars 2020 microphone, Planet. Space Sci. 165 (2019) 260–271,https://doi.org/10.1016/j.pss.2018.09.009. [9] J.C. Miller (Ed.), Laser Ablation, Springer, Berlin, Heidelberg, 1994, ,https://doi.
org/10.1007/978-3-642-78720-1.
[10] S. Conesa, S. Palanco, J. Laserna, Acoustic and optical emission during laser-in-duced plasma formation, Spectrochim. Acta B At. Spectrosc. 59 (2004) 1395–1401,
https://doi.org/10.1016/j.sab.2004.06.004.
[11] J. Diaci, J. Možina, Investigation of blast waves generated by laser induced damage processes, Opt. Commun. 90 (1992) 73–78, https://doi.org/10.1016/0030-4018(92)90331-K.
[12] S.H. Jeong, R. Greif, R.E. Russo, Shock wave and material vapour plume propa-gation during excimer laser ablation of aluminium samples, J. Phys. D. Appl. Phys. 32 (1999) 2578.
[13] R. Krasniker, V. Bulatov, I. Schechter, Study of matrix effects in laser plasma spectroscopy by shock wave propagation, Spectrochim. Acta B At. Spectrosc. 56 (2001) 609–618,https://doi.org/10.1016/s0584-8547(01)00194-x.
[14] Z. Abdel-Salam, A. Galmed, E. Tognoni, M. Harith, Estimation of calcified tissues hardness via calcium and magnesium ionic to atomic line intensity ratio in laser induced breakdown spectra, Spectrochim. Acta B At. Spectrosc. 62 (2007) 1343–1347,https://doi.org/10.1016/j.sab.2007.10.033.
[15] C. Stauter, P. Gérard, J. Fontaine, T. Engel, Laser ablation acoustical monitoring, Appl. Surf. Sci. 109-110 (1997) 174–178,https://doi.org/10.1016/s0169-4332(96) 00655-1.
[16] G. Chen, E.S. Yeung, Acoustic signal as an internal standard for quantitation in laser-generated plumes, Anal. Chem. 60 (1988) 2258–2263,https://doi.org/10. 1021/ac00171a020.
[17] A. Hrdlička, L. Zaorálková, M. Galiová, T. Čtvrtnčková, V. Kanický, V. Otruba, K. Novotný, P. Krásenský, J. Kaiser, R. Malina, K. Pálenková, Correlation of acoustic and optical emission signals produced at 1064 and 532 nm laser-induced break-down spectroscopy (LIBS) of glazed wall tiles, Spectrochim. Acta B At. Spectrosc. 64 (2009) 74–78,https://doi.org/10.1016/j.sab.2008.10.043.
[18] M.A. Shannon, A simplified cavity analysis for estimating energy coupling during laser ablation and drilling of solids – theory, Appl. Surf. Sci. 127-129 (1998) 218–225,https://doi.org/10.1016/s0169-4332(97)00635-1.
[19] X. Zeng, X. Mao, S.S. Mao, J.H. Yoo, R. Greif, R.E. Russo, Laser–plasma interactions in fused silica cavities, J. Appl. Phys. 95 (2004) 816–822,https://doi.org/10.1063/ 1.1635990.
[20] M. Corsi, G. Cristoforetti, M. Hidalgo, D. Iriarte, S. Legnaioli, V. Palleschi, A. Salvetti, E. Tognoni, Effect of laser-induced crater depth in laser-induced breakdown spectroscopy emission features, Appl. Spectrosc. 59 (2005) 853–860,
https://doi.org/10.1366/0003702054411607.
[21] L. Grad, J. Možina, Acoustic in situ monitoring of excimer laser ablation of different ceramics, Appl. Surf. Sci. 69 (1993) 370–375, https://doi.org/10.1016/0169-4332(93)90536-k.
[22] C. Chaléard, P. Mauchien, N. Andre, J. Uebbing, J.L. Lacour, C. Geertsen, Correction of matrix effects in quantitative elemental analysis with laser ablation optical emission spectrometry, J. Anal. At. Spectrom. 12 (1997) 183–188,https://doi.org/ 10.1039/a604456e.
[23] R.C. Wiens, S. Maurice, J. Lasue, O. Forni, R. Anderson, S. Clegg, S. Bender, D. Blaney, B. Barraclough, A. Cousin, L. Deflores, D. Delapp, M. Dyar, C. Fabre, O. Gasnault, N. Lanza, J. Mazoyer, N. Melikechi, P.-Y. Meslin, H. Newsom, A. Ollila, R. Perez, R. Tokar, D. Vaniman, Pre-flight calibration and initial data processing for the ChemCam laser-induced breakdown spectroscopy instrument on the mars sci-ence laboratory rover, Spectrochim. Acta Part B Atom. Spectrosc. 82 (2013) 1–27,
https://doi.org/10.1016/j.sab.2013.02.003.
[24] C.C. Allen, K.M. Jager, R.V. Morris, D.J. Lindstrom, M.M. Lindstrom,
J.P. Lockwood, JSC MARS-1: a martian soil simulant, Space 98, American Society of Civil Engineers, 1998, ,https://doi.org/10.1061/40339(206)54.
[25] V. Buchwald, Handbook of Iron Meteorites: Their History, Distribution, Composition and Structure. Iron meteorites Chinga Chupaderos, 2, University of
California Press, 1975 URLhttp://hdl.handle.net/10524/35670.
[26] A. Fau, O. Beyssac, K. Benzerara, S. Bernard, P.-Y. Meslin, A. Cousin, J. Boulliard, M. Gauthier, J. Manrique, S. Maurice, P.-Y. Meslin, G. Montagnac, R. Wiens, S. Maurice, O. Gasnault, Effect of LIBS laser shots on mineral structure and RAMAN signature: preparing for Mars2020 SuperCam instrument, 49th Lunar and Planetary Science Conference, The Woodlands, TX, United States, 2018, p. 2064. [27] J.G. Bolaños, V. Pulkki, P. Karppinen, E. Hæggström, An optoacoustic point source
for acoustic scale model measurements, J. Acoust. Soc. Am. 133 (2013) EL221–EL227,https://doi.org/10.1121/1.4793566.
[28] Q. Qin, K. Attenborough, Characteristics and application of laser-generated acoustic shock waves in air, Appl. Acoust. 65 (2004) 325–340,https://doi.org/10.1016/j. apacoust.2003.11.003.
[29] B. Sallé, J.-L. Lacour, E. Vors, P. Fichet, S. Maurice, D.A. Cremers, R.C. Wiens, Laser-induced breakdown spectroscopy for mars surface analysis: capabilities at stand-off distances and detection of chlorine and sulfur elements, Spectrochim. Acta B At. Spectrosc. 59 (2004) 1413–1422,https://doi.org/10.1016/j.sab.2004.06.006. [30] N.L. Lanza, A.M. Ollila, A. Cousin, R.C. Wiens, S. Clegg, N. Mangold, N. Bridges,
D. Cooper, M. Schmidt, J. Berger, R. Arvidson, N. Melikechi, H.E. Newsom, R. Tokar, C. Hardgrove, A. Mezzacappa, R.S. Jackson, B. Clark, O. Forni, S. Maurice, M. Nachon, R.B. Anderson, J. Blank, M. Deans, D. Delapp, R. Léveillé, R. McInroy, R. Martinez, P.-Y. Meslin, P. Pinet, Understanding the signature of rock coatings in laser-induced breakdown spectroscopy data, Icarus 249 (2015) 62–73,https://doi. org/10.1016/j.icarus.2014.05.038.
[31] N.L. Lanza, R.C. Wiens, R.E. Arvidson, B.C. Clark, W.W. Fischer, R. Gellert, J.P. Grotzinger, J.A. Hurowitz, S.M. McLennan, R.V. Morris, M.S. Rice, J.F. Bell, J.A. Berger, D.L. Blaney, N.T. Bridges, F. Calef, J.L. Campbell, S.M. Clegg, A. Cousin, K.S. Edgett, C. Fabre, M.R. Fisk, O. Forni, J. Frydenvang, K.R. Hardy, C. Hardgrove, J.R. Johnson, J. Lasue, S.L. Mouélic, M.C. Malin, N. Mangold, J. Martn-Torres, S. Maurice, M.J. McBride, D.W. Ming, H.E. Newsom, A.M. Ollila, V. Sautter, S. Schröder, L.M. Thompson, A.H. Treiman, S. VanBommel, D.T. Vaniman, M.-P. Zorzano, Oxidation of manganese in an ancient aquifer, kimberley formation, gale crater, mars, Geophys. Res. Lett. 43 (2016) 7398–7407,https://doi.org/10. 1002/2016gl069109.
[32] J.M. Vadillo, J.M.F. Romero, C. Rodrguez, J.J. Laserna, Effect of plasma shielding on laser ablation rate of pure metals at reduced pressure, Surf. Interface Anal. 27 (1999) 1009–1015,https://doi.org/10.1002/(sici)1096-9918(199911) 27:11<1009::aid-sia670>3.0.co;2-2.
[33] J. Diaci, J. Možina, Measurement of energy conversion efficiency during laser ab-lation by a multiple laser beam deflection probe, Ultrasonics 34 (1996) 523–525,
https://doi.org/10.1016/0041-624x(95)00100-h.
[34] P. Solana, G. Negro, A study of the effect of multiple reflections on the shape of the keyhole in the laser processing of materials, J. Phys. D. Appl. Phys. 30 (1997) 3216–3222,https://doi.org/10.1088/0022-3727/30/23/006.
[35] W. Rapin, Hydratation de la surface de Mars partir des donnes du rover Curiosity, Ph.D. thesis cole doctorale Sciences de lunivers, de lenvironnement et de lespace, Toulouse, 2017.