CITIES AS AIR TRANSPORT CENTRES: AN ANALYSIS OF THE DETERMINANTS OF AIR TRAFFIC VOLUME FOR NORTH AMERICAN URBAN AREAS Carine DISCAZEAUX and Mario POLÈSE
INRS
Urbanisation, Culture et Société
NOVEMBER 2007Cities as Air Transport Centres: An
Analysis of the Determinants of Air Traffic
Volume for North American Urban Areas
Carine DISCAZEAUX and Mario POLÈSE
Institut national de la recherche scientifique Urbanisation, Culture et Société
Carine Discazeaux
[email protected] Mario Polèse
Inédits, collection dirigée par Mario Polèse :
Institut national de la recherche scientifique Urbanisation, Culture et Société
385, rue Sherbrooke Est Montréal (Québec) H2X 1E3 Téléphone : (514) 499-4000 Télécopieur : (514) 499-4065
www.ucs.inrs.ca
TABLE OF CONTENTS
LIST OF TABLES ... IV
LIST OF FIGURES ... IV
ABSTRACT / RÉSUMÉ ... V
INTRODUCTION ... 1
1. BRIEF REVIEW OF THE LITERATURE ... 3
1.1 Size and Structure of the Local Economy ... 3
1.2 Recent Developments: Other Determinants of Air Traffic Volume ... 4
2. STUDY AREA AND DATA ... 7
3. ANALYSIS AND FINDINGS ... 9
3.1 Urban Size ... 9
3.2 Employment Structure ... 11
3.3 Augmented (Local Economy) Model ... 12
3.4 The Final Model ... 16
CONCLUSION ... 19
iv
List of Tables
Table 1 Relationship between air traffic (number of enplaned/deplaned passengers) and urban
size variables: correlation coefficients ... 9
Table 2 Relationship between employment shares (%) in five industries and air traffic volume and with residuals: correlation coefficients ... 11
Table 3 Regression Results: Air traffic (2000) with three Independent Variables ... 12
Table 4 Correlation Coefficients: with Residuals of Augmented Model ... 17
Table 5 Regression Results: Final Model ... 17
List of Figures Figure 1 Relationship between air traffic volume (2000) and total employment. ... 10
Figure 2 Residual: Principal Urban Areas. ... 11
Abstract / Résumé
Using a regression model, the paper examines the determinants of air traffic volume for the 89 largest urban areas in the US and Canada. The reorganization of the airline industry does not seem to have altered the fundamentals of the economic geography of air traffic. Urban size and local industry structure remain the primary determinants, consistent with the findings of previous studies. Location also matters: carriers ideally seek to locate in the centre - the largest city - of their market. The size and shape of national markets and the presence national borders also matter. The linear form and low densities of Canada’s population limit the development of nationally-based hub-and spoke networks. Canadian cities exhibit systematically lower traffic volumes than their US counterparts.
Keywords: Air Traffic; Cities; Urban Economy; North America
À l’aide d’un modèle de régression, ce papier examine les facteurs explicatifs des variations de trafic aérien pour les 89 plus grandes régions urbaines des États-Unis et du Canada. La réorganisation récente de l’industrie aérienne ne semble pas avoir fondamentalement modifié la géographie économique du trafic aérien. La taille urbaine et la structure industrielle locale restent les principaux facteurs; en cela, nos résultats vont dans le sens d’études antérieures. La localisation compte aussi : les transporteurs cherchent idéalement à se positionner au cœur – à savoir, la plus grande ville – du marché desservi. La forme et la taille du pays comptent aussi, tout comme la présence de frontières. La forme linéaire du Canada ajoutée aux faibles densités de population rendent difficile la mise en place de réseaux nationaux centrés sur des « hubs ». Les villes canadiennes affichent systématiquement des volumes de trafic aérien en deçà de leurs sœurs américaines.
INTRODUCTION
Metropolitan areas are increasingly service centers: financial centers; corporate control centers; distributions centers; centers of artistic creation; etc. Metropolitan areas “export” services (financial advice, management, broadcasting, entertainment…) to the rest of the world, fuelling the local economy. This paper focuses on a specific service: air transport. The question addressed is this: what are the determinants of the location of air travel services as measured by passenger volumes? Is air travel largely an induced activity – in response to local demand – as distinct from an exported service, part of the urban area’s economic base? Is size (of the local economy) the primary explanatory variable – suggesting a Christaller-type hierarchical distribution – or do other factors matter more?
The literature provides a first answer. Several studies for the U.S. have in the past observed a positive relationship between measures of the size and structure of the local economy and air traffic volumes (Ivy, Fik et Malecki, 1995; Debbage and Delk, 2001; Brueckner, 2003; Button and al., 1999; Debbage, 1999; Caves and Ndoh, 1995). Most air traffic forecasting models (FAA, Transport Canada) rely on economic variables as predictors. All this suggests that air traffic is by and large an induced activity, propelled principally by the strength and dynamism of the local economy and surrounding regions. In addition, since air transport is subject to scale economies, like most highly capitalized services, we should expect the industry to concentrate in the upper echelons of the urban hierarchy.
Other studies argue that the relationship is not that simple: O’Connor and Scott, 1992; O’Connor, 1995; Goetz, 1995. Within the US – following the Airline Deregulation Act, passed by Congress in 1978 – air carriers adopted new strategies in response to the more competitive environment, restructuring their networks, generally accelerating the polarization of traffic in airport hubs in a few large US cities (Goetz, 1995); in turn altering the distribution of the air traffic (O’Connor, 2003; Debbage and Delk, 2001; O’Connor, 2003). There is no a priori reason to think that such hubs will systematically follow a hierarchical model. Atlanta is a case in point: the home of Delta Airlines, which although a major hub is not at the top of the US urban hierarchy.
Other factors also influence the evolution and distribution of air traffic: changes in aircraft technology, new regulatory arrangements, corporate airport and airline strategies, traffic congestion, etc. (O’Connor, 2003). For hubs, traffic volumes do not – by definition – depend on only on local demand: transit passengers are what make it a hub. Network configurations, associated with hub and spoke structures, should diminish the importance of local markets as
2
determinants of the air traffic volume. On other hand, the regional service center function should a priori increase the importance of location.
This paper seeks to provide new empirical evidence of the relationship between the size and the structure of the local economy, location, and other variables and air traffic volume via an analysis of eighty nine (89) urban areas, comprising all metropolitan areas with a population over 500,000 in 2000 in U.S. and 2001 in Canada. The next section presents a brief review of the literature on the relationship between local economies and air traffic, followed by the description of the data used, followed in turn by the empirical analysis, which constitutes the core of the study.
The empirical part of the paper starts with an examination of the relationship between air traffic volume and variables that characterize the local economy (employment, industry mix…). The analysis is fairly straightforward, in part replicating the work of others, although for a different time period and a different universe of urban areas. Where the paper diverges from others – and, hopefully, innovates – is the importance given over to the examination of
other factors, captured in the residuals, once local economic variables have been accounted
for. The use of both US and Canadian data allows, in addition, us to consider the role of national boundaries and the geography of national economies as determinants of a city’s position as an air transport centre.
1. BRIEF REVIEW OF THE LITERATURE
Various factors have been put forward in the literature as determinants of local air traffic volume. We shall, in turn, consider variables related to the local economy and other variables.
1.1 Size and Structure of the Local Economy
Numerous studies have, time and again, corroborated the positive relationship between the size and structure of local economy and air traffic volume. Ivy, Fik and Malecki (1995), Debbage and Delk. (2001) and Brueckner (2003) are recent examples, specifically regarding employment (levels) as a predictor of the volume of passenger travel. Covering different time periods and different groups of US cities, all find a statistically significant relationship between air traffic levels and employment, notably with employment in administrative and auxiliary services.1
The positive relationship between air services and administrative and auxiliary employment levels was first noted by Ivy, Fik and Malecki (1995) in an analysis of the fifty-nine largest metropolitan areas in the US for 1978–88. In a study of the top 50 urban-airport complexes in the United-States from 1973 to 1996, Debbage and Delk (2001) find a similar strong linear relationship between enplaned passenger volumes and administrative and auxiliary employment levels, with a Pearson’s correlation coefficient of 0.84 for 1973 and 0.83 for 1983 and 1996.
However, these strong correlation coefficients, as with all such results, do not tell the whole story, for they leave aside the issue of causality. Causality is as much a matter of interpretation as of statistical truth. As various authors have pointed out (Brueckner, 2003; Button et al,1999; Debbage, 1999; Caves et Ndoh, 1995), the relationship between air traffic and the local economy can go both ways, hiding a difficult-to-measure cumulative, circular, feedback process whereby the local economy generates air traffic, but inversely, air traffic also generates local economic activity. Brueckner (2003), specifically, argues that good airline services are an important factor in urban economic development, facilitating exchanges with other cities, attracting new firms to the metropolitan area and stimulating employment. Brueckner (2003) finds that a 10% increase in enplaned passengers in a city leads to a 1% increase in employment in service-related industries2 (he finds no effect on manufacturing and other goods related employment).
1 Standard Industrial Classification Manual, Office of Management and Budget (cited in Debbage and Delk 2001: 162). As
will be noted later, industrial classification definitions have changed since, which make comparisons over time difficult.
2
Service related employment = wholesale and retail trade, FIRE, services government, transport, public utilities employment; Goods related employment = manufacturing, construction and mining.
4
Button et al (1999) argue that the establishment of a hub in a city provides a real economic stimulus, particularly for high-technology employment. They find a significant positive correlation between hubs and new economy employment3 in a study covering 321 MSAs in the US. At a more detailed level, Button et al (1999) compare the situation at two non-hub airports (Nashville and Milwaukee) with that of two major airline hubs, Cincinnati and Pittsburgh. Examining the spatial and temporal patterns of air passenger traffic by airport in the Carolinas, Debbage (1999) finds that airports that experienced significant gains in air passenger volume – following the establishment of an air carrier hub (Charlotte, Raleigh-Durham and Greensboro) – tended to experience comparable gains in employment levels of administrative and auxiliary workers. Observing the reciprocal causation and dependency between air transport supply and local demand for a sample of three airports, Caves and Ndoh (1995) find that supply tends to affect demand with a three to six month lag.
However, the precise causal relationship is not always easy to establish, nor are the posited economic impacts automatic (Button and Taylor, 2001). Measuring the indirect economic impacts of infrastructures is an inexact science at best. This is no less true for airports. The danger exists, among other things, of confusing outcomes (traffic levels) with the infrastructure as such. Also, which is the initial spark that set off an observed rise in traffic levels: is it the construction (or improvement) of an airport or its choice as a hub, and what is relationship between the two? In this study, we only measure outcomes. We do not know whether the infrastructure (the airport) is under or over-used, or whether given airport facilities are organized and managed so as to facilitate hub (transfer) functions. We shall return to this point when we consider the case of Montreal (where observed traffic is significantly below that predicted by the model). The point is this: airports that generate high levels of traffic – i.e. with hub functions – are not distributed at random. It is unlikely that a small town would be chosen as a hub or point of transfer, which brings us back to the role of local demand, compared to other factors, which is the focus of this study.
1.2 Recent Developments: Other Determinants of Air Traffic Volume
With the acceleration of air transport deregulation in the US and in North America in general, the nature of air traffic forecasting has become more complex: endogenous (local) and exogenous (non-local) forces interact in new ways (Graham, 1999). The size of the local market remains a major determinant, but so do other considerations, such as location and the corporate strategies of competing carriers or airports (O’Connor, 1995; Goetz, 1995;
3
The definition of “new economy”, using Country Business Pattern data, is a revised version of the Armington Index, which groups various industrial classes, taken from Stough et al. (1996).
5
Graham, 1999; Huston and Butler, 1991, O’Connor, 2003). A hub airport is, for example, unlikely to develop close to another, which already dominates a regional market.
Air carriers have accelerated the development of hub-and-spoke networks, driven in part by scale economies, polarizing air traffic around nodes, centered on the richest and densest markets. Concurrently, competing airports engage in aggressive proactive pricing policies aimed at attracting (non local) traffic. Changes in aircraft technology have also influences the spatial distribution of air traffic, impacting carrying capacities and distances between refueling. While the Boeing 747, for example, is limited to the largest markets because of its need to capture the maximum number of passengers per flight segment, smaller cities will be left to mid-sized long haul carriers. However, the recent introduction of regional jets may contribute both to dispersion, bypassing hubs, and concentration, extending the catchments area of given airports (Shrifin, 2001; O’Connor, 2003). Air carriers have, increasingly, developed regional hubs. Debbage and Delk (2001) argue that the pattern of air travel is changing, involving smaller cities outside the usual list of the global cities.
The combined impact of corporate strategies, scale economies, and larger aircraft can – it is not unreasonable to suggest – upset the neat linear relationship between the size of local markets and air traffic, as satellite airports are increasingly absorbed into the spoke tied to the carrier’s principal hub. Atlanta, the hub of Delta Airlines, as noted earlier, is the third airport in the US in terms of traffic volume after New York and Chicago, with some eighty millions of passengers. Almost 75% of this traffic is in transit. Debbage and Delk (2001) argue that administrative and auxiliary employment hardly grew in the Atlanta area between 1973 and 1996, whereas air traffic kept growing. In this case, it would be difficult to argue that local demand was the driving force behind the choice of Atlanta as Delta´s principal hub. But, then again, Atlanta may well be the exception that proves the rule.
In sum, before proceeding with the empirical analysis, it is useful to keep in mind, on the one hand, that circular causation remains a problem (local demand creates supply, further stimulating demand) and, on the other, that corporate strategies and technological change can create conditions that a priori are not necessarily consistent with what the rules of economic geography would predict. The model employed here does not allow for circular causation, nor does it allow us to integrate considerations of corporate strategy, beyond what we know from the literature and the media.
2. STUDY AREA AND DATA
The study covers 89 urban areas in the US and Canada. The geographical units are Census Metropolitan Areas (CMAs) for Canada and Metropolitan Statistical Areas or Consolidated Metropolitan Statistical Areas (MSAs or CMSAs) for the United States. MSAs in the US are made up of a central county (or counties) with a population of at least 50,000, plus adjacent outlying counties having a high degree of economic interaction with the central county, as measured by commuting patterns. CMAs in Canada are defined along similar lines, although the smallest units (municipalities and census divisions) are generally smaller then US counties. In the United-States, consolidated metropolitan statistical areas (CMSAs), which apply to the very largest metro areas, can cover quite large swathes of territory. Thus, the New York CMSA, with some twenty million inhabitants, stretches from central Connecticut (including New Haven, for example) to eastern Pennsylvania, encompassing other MSAs such as Newark in New Jersey. By the same token, the Los Angeles CMSA stretches all the way to the Nevada border, taking in the numerous communities of Orange County (many of which house airports).
This definition of urban areas means that the data used for passenger traffic refer to all major airports in the area. Thus, the data for New York include the traffic generated by JFK, La Guardia, and Newark. The universe covers all urban areas, so defined, in the continental US and Canada with populations above 500,000 in 2000 (2001 for Canada). Honolulu, laying outside the continental US, was excluded for obvious reasons.4
Air traffic, the dependant variable, is measured by the volume of enplaned and deplaned passengers in 2000. As noted above, if an urban area had multiple airports, passenger numbers were aggregated; source: Airport Council International (ACI). Websites are given at the end of the references section.
Possible explanatory variables fall into three classes: urban size, local employment structure, and geographic variables. The latter will be dealt with later.
Urban size
• Total population • Total employment
• Total population with a Bachelor’s degree (B.A. or B.Sci) or higher.
4
Perhaps not totally obvious: Located on an island, with no alternative long-distance transport modes (except water), one would expect Honolulu to generate above average air traffic. In earlier regressions, Honolulu emerged as an outlier.
8
Employment structure, focusing on industries with a high potential for generating air traffic. Percentage (%) of local employment in five industries:5
• Arts, Entertainment and Recreation. • Accommodation and Food Services.
• Professional, Scientific and Technical Services
• Administrative and Support, Waste Management and Remediation Services. • Finance, Insurance, and Real Estate (FIRE)
The first two are reasonable proxies for the tourist industry, while the latter three refer to activities for which face to face contact remains essential, as close as possible to the pre-NAICS variables used by previous authors. The sources both for the US and Canada are national censuses, for the year 2000 in the case of the former (US Bureau of the Census) and 2001 for the latter (Statistics Canada). Accordingly, all data and results presented in the following section are for the years 2000 or 2001.
5
The classes are those of the North American Industrial Classification System (NAICS), introduced in 1997, a by-product of NAFTA (North American Free Trade Agreement).
3. ANALYSIS AND FINDINGS
The analysis proceeds in stages, walking the reader through each step, as new variables are introduced before reaching the final model. This approach was adopted for two reasons. First, examining variables separately reduces interpretation problems associated with co-linearity, always present in this kind of analysis. The proportion of professional, scientific and technical services in local employment is, for example, highly correlated with city size. Second, and more to the point, a step by step approach allows the researcher to examine the role of key variables in greater detail – notably urban size and structure – before choosing new variables. Some time is thus spent examining residuals; that is, cities whose traffic volume cannot be solely explained by local market size and employment mix.
3.1 Urban Size
Table 1 looks at the relationship between traffic volume and urban size as measured, respectively, by total population, total employment and total graduate population. All data are for the years 2000 or 2001.
Table 1
Relationship between air traffic (number of enplaned/deplaned passengers) and urban size variables: correlation coefficients
r
Total Population 0.834
Graduate Population 0.832
Total Employment 0.851
All three correlation coefficients are high and significant (at the 0.01 level), an indication that urban size – however measured – remains a powerful predictor of passenger traffic, consistent with what others have observed for earlier periods. Total employment is the best predictor, which thus becomes the urban size variable used in the remainder of the analysis, with an r2 of 0.72.4.
Figure 1 illustrates the relationship between air traffic levels and the size of the local economy, as measured by total employment. Deviations from the regression line – the residuals – identify cities where air traffic levels are least related to urban size. For example, air traffic in 2000 in Montreal (bottom left-hand corner) was below what the city’s size would predict. By the same token, Atlanta lies well above the regression line, which is consistent with earlier remarks.
10
Figure 1 — Relationship between air traffic volume (2000) and total employment.
Figure 2 plots residuals in descending order for the thirty urban areas that exhibit the greatest divergence from the regression line.6 Atlanta aside, tourist destinations clearly stand out: Miami, Las Vegas, Orlando. Miami, in addition, is a carrier hub (notably, for American Airlines). Other major hub airport cities, besides Atlanta are Chicago, Denver, San Francisco and Dallas. More surprisingly, major metropolitan areas such as New York, Los Angeles, Boston, and Philadelphia, show negative residuals; these are, it is reasonable to assume, key international business destinations. The first two – perhaps three – would certainly qualify as global cities, at the heart of the world economy.
6
Residuals measure the difference between observed and predicted values. On Figure 1, these are divided by the standard deviation (mean=0), thus showing the dispersion around the mean.
11 Gre ensb oro Orla ndo San Fran cisc o Los Ang eles Dal las New Yor k Chi cago Mia mi Atla nta Las Veg as Den ver Hou ston Pho enix Sal t Lak e C ity Sai nt-L ouis Bos ton Phi lade lphi a Min nea polis Mon tréal Cha rlotte Cin cina ti Nor forlk Gra nd R apid s Milw auke e Cle vela nd Gre envi lle Otta wa Roc hest er Ham ilto n Toro nto Qué bec -4 -3 -2 -1 0 1 2 3 4 5 Urban Area Residuals
Figure 2 — Residual: Principal Urban Areas.
3.2 Employment Structure
However, aggregate indicators of size are not sufficient; recall the use in previous studies of administrative and auxiliary employment as a predictor. Table 2 shows correlation coefficients – respectively for the residuals (as plotted on Figure 1) and for air traffic volume – with respect for employment shares (percentages) in the five service industry classes listed earlier.
Table 2
Relationship between employment shares (%) in five industries and air traffic volume and with residuals: correlation coefficients
Correlation with Residuals Air Traffic
% of total employment r r
Tourist Related Industries (2 classes) 0.286 0.072
Arts, Entertainment, & Recreation 0.292 0.178
Accommodation & Food Services 0.259 -0.036
High Order Services (2 classes) 0.267 0.508**
Professional., Scientific & Technical 0.203 0.492**
Admin. & Admin. Support. Services 0.312 0.291**
FIRE (Finance, Insurance & Real Estate) 0.169 0.326** ** Significant at the 0.01 level.
12
All industry shares are positively related to the residuals, though not always statistically significant. Employment structure does matter above and beyond total employment, but only marginally. Not surprisingly, the administrative employment variable adds most to the explanation of the residuals, the variable that comes closest to that used by previous authors. The positive relation with the arts and entertainment industry is also unsurprising.
However – although positive – why are the coefficients not higher? The share of employment in the arts, entertainment and recreation adds little, for example, because it only pertains to particular cities like Las Vegas and Orlando. On the other hand, high order services add also little, in part because this variable is positively correlated with total employment. These results may seem surprising in light of importance that the literature generally accords to the new economy as a generator of air traffic (Ivy, Fik and Malecki, 1995; Button et al., 1999, Debbage et al., 2001, Brueckner, 2003). High-order service – new economy – employment is positively correlated with air traffic volume. What this suggests, in the end, is that particular industries may indeed generate proportionally more traffic than others; but it is the entire urban economy – in all its diversity – that remains the most powerful force generating aggregate air traffic.
Table 3
Regression Results: Air traffic (2000) with three Independent Variables
Air traffic = 2E +007 (p=0.001) r2: 76.5%
+12.205 Total Employment (p=0.000) r: 87.4% +1452503 % High Order Services (p=0.012) p: 0.000 +1049691 % Tourist-related services (p=0.016)
Taken together, employment shares in tourist-related and in high-order services explain some 14% of the variance of the residuals, adding 4.1% to the explanatory power (r2) of the initial regression equation for air traffic with only urban size as the independent variable (Table 3).
3.3 Augmented (Local Economy) Model
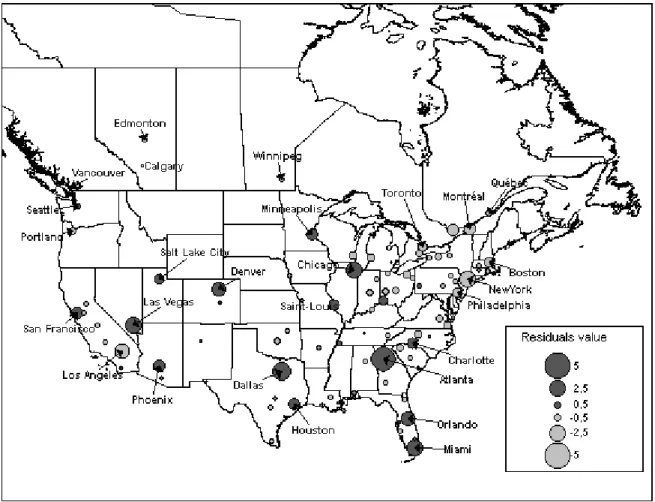
In sum, local economic variables explain some 76.5% of the variance in air traffic volumes between cities, with size by far the most important factor. Taking this augmented model as our point of reference, let us again consider the residuals; but this time by plotting them on a map of North America (Figure 3).
13
Figure 3 — Residuals: Spatial Distribution – Augmented Model.
Positive residuals (darker circles) mean air traffic volume is higher than would normally have been generated, given the size and structure of the local economy. A number of things immediately stand out on the map. First, all Canadian cities show negative residuals, including Toronto, Canada’s major hub city (Air Canada). Second, most positive residuals are for cities harbouring a carrier hub (Atlanta, Chicago, Dallas, Denver…), the “excess” thus due – it is reasonable to assume – to transit passengers. Also, the majority of positive residuals exhibit geographically central locations, whereas negative residuals are more frequent at the periphery of the continent. This is consistent with the central place role of hubs, which act as focal points for a wider region, absorbing traffic from surrounding cities (feeder airports). O’Connor (1995) calls this the “proximity” or “shadow effect”. A continentally central location should a priori offer a greater “shadow effect” than a peripheral one. Brueckner (1993), however, finds no significant effect (on traffic volume) for the “centrality” variable, which he defines as the distance from the population center of the US (in central Missouri). On the other hand, his “proximity” variable, defined as the proximity – 150 miles – to a large hub airport does show consistent results, reducing traffic volume in smaller surrounding cities.
14
Figure 3 suggests that centrality does matter. With the notable – and understandable – exception of Floridian cities, few cities near the coast exhibit high residuals. Horner and O’Kelly (2001) argue that, because of their “central” location, Oklahoma City, Pittsburgh, Indianapolis, and Knoxville generate relatively high traffic volumes despite the small size of their local markets. On the other hand, the strength of Atlanta, Chicago, Dallas, and Denver are most probably a reflection of a process of hub consolidation, in which increasing numbers of smaller cities are tied into single carrier hub-and-spoke networks. According to O’Kelly (2001), the development of a hub requires both location – centrality – and a large local market. Air carriers have segmented their networks, producing a hierarchical – interlocking/stacked – pattern of flows and airports. The result is a hierarchy of intercontinental, continental, and regional hubs, each carrier seeking to generate a network structure with the lowest cost of collecting/distributing passengers.
Regional hubs – Minneapolis, Salt Lake City, Cincinnati, Saint-Louis, and Tampa – are located in the center of their respective regional markets. Eight such regional markets can be identified: Pacific, Mountains, West North Central, East North Central, North East, West South Central, East South Central and South Atlantic. By the same token, continental hubs – Atlanta, Detroit, Houston, and Dallas – tend to locate near the center of the continental market. However, the definition of centrality is not self-evident, since the limits of the continental market do not necessarily correspond to national borders. The poor results obtained by Brueckner (2003) for his centrality variable may in part be due to the increasing openness of national boundaries. The North America Free Trade Agreement (NAFTA) and the more recent Central American Free Trade Agreement (CAFTA) have, for example, redefined the centrality of places and created new intermediate points on air travel networks Such changes increase the “centrality”, so to speak, of southern cities, as north-south trade grows (O’Connor, 1995). Dallas and Houston are strategically located for channeling interaction between North America and Latin America. Many larger US and Canadian cities are within a four hour flight from Dallas or Houston. Dallas is the “southern” hub for two major US carriers: American Airlines and Delta.
A priori, Canadian cities should have a similar location advantage for interaction with Europe and Asia, as they are closer to European and Asian markets in terms of air distances than most US cities (Oum, 2001). However, the distribution of the Canadian population is too linear and too scattered to allow the development of a continentally competitive hub and spoke network based on the national market. Also, incomes are somewhat lower in Canada than in US, with a probable dampening effect on demand. Finally, 90% of the Canadian population lives inside 150 miles of the US border, often within the shadow of major by U.S. hubs (Oum, 2001).
15
The interplay between location and local market size remains complex. Graham (1999) specifies that airline operating strategies or airport pricing policies alone aren’t enough to generate the required air traffic. Nashville and Raleigh-Durham couldn’t become hubs because their markets were not big enough to sustain operations (Graham, 1995), like Canadian cities. But, what of New York and Los Angeles, whose local markets are certainly not too small? Some authors have suggested that the role of global cities or international gateways in the global network has begun to weaken (Smith and Timberlake, 2002; Debbage and Delk, 2001; O’Connor, 2003). O’Connor (2003) observes that mid-sized cities have recorded substantial increases in passenger movements between 1990 and 2000; the greatest increases in traffic (market) shares have been recorded in Memphis, Detroit and Minneapolis (Pearson, 1997). This process is related, some authors suggest, to changes in aircraft technology, the rise of carrier alliances, and changes in the manpower and face-to-face contact needs in a broad range of industries: O’Connor (2003); Pearson (1997). Mid-sized cities have, it is argued, an emerging competitive advantage, as air carriers develop new regional hubs with the introduction of mid-sized aircraft.
All this does not entirely explain the negative residuals of the continent’s two largest cities. One possible hypothesis is that these true megapolitan cities are more contained and self-sufficient in terms of face-to-face contacts. They have it all: no need to look elsewhere for advice, know-how, or creative inputs. No other urban areas can offer a broader range of services and talent. Along the same line, consider the negative residuals of the large urban areas lying along the great coastal megalopolis stretching from Boston to Washington D.C., with New York in the middle. Within this vast megapolitan conurbation of some fifty million people, face-to-face encounters are not principally dependant on air travel, but can also avail themselves of other transport modes, with a predictable dampening impact on air traffic. Whether this is indeed so would require further research, but which falls beyond the purview of this article.
A possible explanation for Montreal’s highly negative residual is of a similar nature. Montreal is the metropolis of (largely) French-speaking Quebec Province, a special case in North America. As such, it is reasonable to suggest that Montreal has a much more self-contained business community, with proportionally less interaction with the rest of the continent. Polèse and Shearmur (2004) argue that the language difference raises transactions costs, and thus in turn lowers personals interaction, with a predictable dampening effect on air travel. Transport Canada (2003), quoting Wills (1978), is clear on the subject: “linguistic
16
trips: fewer interurban trips are made between cities with different linguistic compositions7”.
The language split undoubtedly also reduces air traffic in other Canadian cities, notably Toronto; French-speakers account for some 25% of the national market.
In addition, Montreal’s potential as a possible hub was hampered in the past by the construction in 1974 of a second airport for what is a comparatively small local market,; intercontinental transit passengers bound for continental destinations were forced to change airports. Montreal soon lost almost all transit traffic (Discazeaux and Polèse, 2007).The situation has since been resolved – one airport was closed – but the legacy of that decision still exerted a dampening effect on traffic volumes in 2000. This example drives home a last consideration: the role of airport design and management. The evident success of Chicago – note the high residual – is not solely due to the joint (positive) effect of large size and central location, but is most probably also helped by the presence of a single large airport – O’Hare – which facilitates transit. By the same token, the presence of multiple airports in the New York area may well have the opposite effect. However, this fails to explain Los Angeles’ poor showing, which has only one major international airport. In this case, we are forced to fall back on the peripheral-local hypothesis.
3.4 The Final Model
A new set of variables can now be introduced into the model:
Canada effect: dummy variable.
Presence (or not) of a hub airport: dummy variable..
Proximity to a hub: distance in km from the nearest hub airport.8
This variable should capture the air traffic dampening effect of proximity.
Regional centrality: dummy variable. Within 100km (or not) of the “central city” of each of the US’s seven census regions, plus Canada: San Francisco, Salt Lake City, Minneapolis, Dallas, Chicago, Memphis, Atlanta, New York, Toronto.
A comment is in order on the last variable. Recall that Brueckner (2003) found no significant results for his continental centrality variable. We ran a similar test, using Saint-Louis as the continental centre, with similar results. The regional centrality dummy, presented above, produced better results.
7 Wills (1978) developed an index of linguistic similarity between the origin zone o and the destination zone d, defined as
follows: LINGSIMod = 1 - | Lo - Ld |, where Lo (Ld) is the proportion of the population of zone o (d) whose mother tongue is
English.
8
17
Table 4
Correlation Coefficients: with Residuals of Augmented Model
r Canada effect -0.293** HUB or not 0.466** Regional Centrality 0.497** Proximity to Hub -0.299* Significance levels: **0.01; * 0.05.
The four new variables exhibit significant statistical relationships with the residuals of the augmented model. However, the HUB variable is highly correlated with the size and the structure of the local economy (see Appendix). This is not surprising, a reflection of the circular feedback effects, difficult to unravel, between a city chosen as a hub and the size, dynamism, and structure of its economy. The HUB variable is thus not included in the final model.
Table 5
Regression Results: Final Model
Air traffic = 3725643 (p=0.560) r2: 86.7%
+9.149 Total Employment (p=0.000) r: 93.1% +1 721 260 High Order Services (p=0.001) p: 0.000 +1 228 131 Tourist-related Services (p=0.000)
-6 494 790 Canada Effect (p=0.065)
-2E+007 Regional Centrality (p=0.000)
-5 913.993 Proximity Hub (p=0.055)
The final model explains 86.7% of the variation in air traffic volume between North American cities in 2000. The three geographic variables add 10.2% to the explanatory power of the model. In a nutshell, location matters, but urban size (and employment structure) matter more. In the end, the classic traffic forecasting models, based on size variables, are not far of the mark.
CONCLUSION
The reorganization in recent decades of the airline industry in North America – fathered chiefly by technological change and deregulation – does not seem to have altered the fundamentals of the economic geography of air traffic. The size and structure of the urban host economy remain the essential determinants of air traffic volume. Bigger cities have bigger (or more) airports and generate more traffic. The results presented hare are generally consistent with those of previous studies in this respect. Location also matters, in line with what central place theory would predict. Each carrier, ideally, seeks out the centre – the largest city – in the geographic heart of the market it wishes to dominate. The more “central” a city is, the greater the potential for reducing the costs of collecting/distributing passengers, and for capturing a larger share of the market. However, measuring centrality – relevant to air transport services – remains a challenge. Finally, the size and shape of national markets and the parallel presence national borders also matter, especially where immigration and customs barriers remain in force, as is the case in North America. The linear form and low densities of Canada’s population distribution have hampered the development of nationally-based hub-and spoke networks. Canadian cities exhibit systematically lower traffic volumes than their Canadian counterparts.
Other factors, which are more difficult to introduce into a general model, can cause a city to generate higher (or lower) than predicted traffic volumes: airport design and management; corporate strategies; urban local development policies; etc. The possible feedback effects between traffic volume and economic activity, about much has been written in the literature, put limits on any model founded on purely linear, uni-directional, causal relationships. However, the results presented here – based on a standard regression approach – suggest that local leeway for influencing the level air traffic volume is probably limited. The independent variables in the model – urban size, employment structure, and location variables – are difficult to change at the local level. These together explained some 87% of the variance in air traffic volume between North America’s eighty-nine largest metropolitan areas in 2000. In the end, air transport services, no less than other high order services, are not immune to the rules of economic geography.
References
Armington, C., 1986, “The Changing Geography of high-technology business”, in Rees, J. (Ed.),
Technology, Regions, and Policy. Rowman and Littlefield Publishers,Totowa, New Jersey,
75-94.
Button, K., Lall, S., Stough, R., Trice, M., 1999, “High-Technology Employment and HUB Airports”, Journal of Air Transport Management, 5 (1): 53-59.
Button, K. and Taylor, S., 2000, “International Air Transportation and Economic Development”,
Journal of Air Transport Management, 6 (4): 209-222.
Brueckner, J. K., 2003, “Airline Traffic and Urban Economic Development”, Urban Studies, 40 (8): 1455-1469.
Caves, R.E. and Ndoh, N.N., 1995, “Investigating the Impact of Air-Service Supply on Local Demand, a Sausal Analysis”, Environment and Planning A, 27 (3): 489-503.
Debbage, K., 1999, “Air Transportation and Urban-Economic Restructuring: Competitive Advantage in the US Carolinas”, Journal of Air Transport Management, 5 (4): 211-221.
Debbage, K., Delk D., 2001, “The Geography of Air Passenger Volume and Local Employment Patterns by US Metropolitan Core Area: 1973-1996”, Journal of Air Transport Management, 7 (3): 159-167.
Discazeaux, C. and Polèse M., 2007, “Comment expliquer le déclin de Montréal comme centre de transports aériens: une question de géographie économique? “, Le Géographe Canadien, 51 (1): 22-42.
Graham, B., 1995, Geography and Air Transport, John Wiley & Sons, Chichester, 304 p.
Graham, B., 1999, “Airport-Specific Traffic Forecasts: A Critical Perspective”, Journal of Transport
Geography, 7 (4): 285-289
Horner, M.W. and O’Kelly, M.E., 2001, “Embedding Economies of Scale Concepts for HUB Network Design”, Journal of Transport Geography, 9 (4): 255-265.
Ivy R.L., 1993, “Variations in HUB Service in the US Domestic Air Transportation Network”,
Journal of Transport Geography, 1 (4): 211-218.
Ivy, R.L., Fik, T.J., Malecki, E.J., 1995. “Changes in Air Service Connectivity and Employment”,
Environment and Planning A, 27 (2): 165-179.
O’Connor, 2003, “Global Air Travel: Toward Concentration or Dispersal?”, Journal of Transport
Geography, 11 (2): 83-92.
O’Kelly M.E., 1998, “A Geographer’s Analysis of HUB-and-Spoke Networks”, Journal of Transport
Geography, 6 (3): 171-186.
Oum, T.H., Zhang A., 2001, “Key Aspects of Global Strategic Alliances and the Impacts on the Future of Canadian Airline Industry”, Journal of Air Transport Management, 7 (5): 287-301. Pearson, A., 1997, “North Atlantic Shifting Sands”, Airline Business, 13: 46-51.
Polèse, M. and Shearmur R., 2004, “Culture, Language, and the Location of High-Order Service Functions: The Case of Montreal and Toronto”, Economic Geography, 80 (4): 329-350. Stough, R., Riggle, and J., Kulkarni, R., 1996, Technology in Virginia’s Regions, Report prepared
for the Virginia Center for Innovative Technology, Center for Regional Analysis, George Mason University, Fairfax, VA.
Transport Canada, 2002, “Passenger Origin-Destination Forecasting Model, Version 2”, Aviation forecasts.
22
Transport Canada, 2003, Presentation and discussion of the PODM-V2 Model, Final Report, Tecsult Inc., 63 p.
Shrifin, C ., 2001, “Flexible friends”, Airline Business 17: 50-52.
Smith, D. and Timberlake, M., 2002, Hierarchies of Dominance among World Cities: A Network
Approach, Chapter 4 in S. Sassen, ed. Global Networks, Linked Cities, 117-141, New-York:
Routledge (and the United Nations University / Institute for Advanced Studies).
Wills, M.J., 1978, « Linear and Non Linear Estimators of O-D Matrix » Doctoral thesis, Department of Geography, University of British Columbia, Vancouver.
Internet Websites
Airport Council International, (ACI)
http://www.airports.org/cda/aci/display/main/aci_content.jsp?zn=aci&cp=1-5_9_2__
Air Transport Association, 1999, Traffic Summary 1960-1998: U.S. Scheduled Airlines
http://www.airtransport.org/public/industry/24.asp. US Bureau of the Census
http://www.census.gov/main/www/cen2000.html
Statistics Canada