O
pen
A
rchive
T
oulouse
A
rchive
O
uverte (
OATAO
)
OATAO is an open access repository that collects the work of Toulouse researchers and makes it freely available over the web where possible.
This is an author-deposited version published in: http://oatao.univ-toulouse.fr/ Eprints ID:
3869
To link to this article:
DOI 10.1002/pssb.200982354
URL:
http://dx.doi.org/10.1002/pssb.200982354
To cite this version: Fleurier, Romain and Lauret, Jean-Sébastien and
Flahaut, Emmanuel and Loiseau, Annick ( 2009) Sorting and transmission
electron microscopy analysis of single or double wall carbon nanotubes.
physica status solidi b, vol. 246 (n° 11-12). pp. 2675-2678. ISSN 0370-1972
Any correspondence concerning this service should be sent to the repository administrator: [email protected]
Sorting and transmission electron
microscopy analysis of single or
double wall carbon nanotubes
Romain Fleurier*,1
, Jean-Se´bastien Lauret2
, Emmanuel Flahaut3
, and Annick Loiseau1 1
Laboratoire d’E´ tude des Microstructures, CNRS ONERA, BP72 29 avenue de la division Leclerc, Chaˆtillon, France
2Laboratoire de Photonique Quantique et Mole´culaire, CNRS E´ cole Normale Supe´rieure de Cachan, 61 avenue du pre´sident Wilson, Cachan, France
3
CNRS, Universite´ Paul Sabatier, Institut Carnot Cirimat, 31062 Toulouse, France
PACS 61.46.Fg, 78.30.Na, 78.40.-q, 81.07.De, 81.20.Ym
*Corresponding author: e-mailromain.fl[email protected], Phone:þ33 1 46 73 45 27, Fax: þ33 1 46 73 41 55
On the basis of the recent progress on the sorting of carbon nanotubes’ structure with respect to their diameter or number of walls, we investigate by transmission electron microscopy the sorting efficiency, with a comparison with optical absorption spectroscopy measurements. We study density gradient ultra-centrifugation sorted single walled or double walled carbon nanotubes, showing obviously the ability to separate carbon nanotubes of different diameters or/and number of walls. This microscopic approach affords accurate information about the
sorted samples such as the real mean diameter, the relative concentration of double walled carbon nanotubes over single walled carbon nanotubes, standard deviation, and the real diameter distribution of carbon nanotubes, even beyond any possible accurate analysis from optical absorption spectroscopy. Therefore, we demonstrate that the diameter analysis of the sorted samples by TEM can indeed afford some information about the relevant optical properties of carbon nanotubes.
1 Introduction Carbon nanotubes (CNTs) offer tre-mendous possibilities in terms of new materials for applications such as opto-electronic devices [1]. However, one has to remind that these objects are in fact a collection of different structures, each of it having so called chiral indices (n, m), with different properties.
Although many efforts have been made to synthesize carbon nanotubes displaying either only one type of struc-ture, or one type of conductivity or at least a controlled number of walls, such selective productions cannot be achieved so far [2, 3]. An alternative approach is to separate carbon nanotubes or even sort them with respect to their structural, optical, or conductivity properties. Among different sorting techniques, density gradient ultracentrifu-gation has revealed to be one of the most versatile and efficient ones [4, 5]. Until recently [6, 7], the efficiency of the sorting has been estimated by indirect structure character-ization tools, that are optical absorption spectroscopy (OAS), Raman spectroscopy, and photoluminescence excitation (PLE).
However, those techniques have specific drawbacks. First of all, the sample evaluation is model dependant since it is performed via an assumed relationship between the structure and the measured property [8]. Furthermore, all carbon nanotubes are not probed with these techniques [9–11]. For example, metallic nanotubes are invisible in PLE measurements, and Raman spectroscopy requires to use lasers with variable wavelength in order to probe all CNTs. In contrast, transmission electron microscopy (TEM) is the only efficient tool able to provide with a direct and quantitative characterization of the CNT structure relying on either electron diffraction (ED) [12] or spherical aberration corrected high-resolution images [7]. Unfortunately, this evaluation is very time consuming, and, for ED, sample preparation is really difficult as ED patterns can only be recorded from well-isolated CNTs [13].
The approach, that we propose here, is to use TEM facilities at an intermediate level that is to evaluate the diameter distribution of sorted CNT samples from their high-resolution images, and to compare them to their OAS
spectra. We successfully achieve this evaluation for both SWNT and DWNTs.
2 Experimental setup We have studied two differ-ent samples: the first one is a commercial source of SWNT (from Carbon Solution Inc.) synthesized with an arc discharge technique and displaying a narrow diameter distribution centered on 1.4 nm. The second one is a mixture of SWNT and DWNT synthesized by a CVD technique at the CIRIMAT and displaying a broader diameter distribution (1–5 nm) [3]. Sorting has been processed as follows: 10 mg of a NT sample are dispersed in a 10 mL of water with 2 wt% sodium cholate (SC) (Sigma Aldrich) with an ultrasound tip during 60 min. This solution is centrifuged during 60 min at approximately 200 000 g to separate non-dispersed carbon nanotubes from the well separated ones. One milliliter of the SWNTs supernatant 2 wt% SC dispersion is then placed in the center of a density gradient based on solutions of iodixanol (density from 1 to 1.14) (optiprep, Sigma Aldrich). The gradient is performed in a SW41 Beckmann Coulter centrifugation tube. The preparation is then let to centrifuge for at least 12 h. The resulting solution of sorted SWNTs is presented on Fig. 1. For DWNTs sorting, 5 mL of the DWNTs supernatant with 1.00 density in 2 wt% SC water is mixed with 5 mL of 2 wt% SC water with 1.26 density with the gradient master device (Biocomp) in order to get a linear gradient. The resulting solution of sorted DWNTs is presented on Fig. 3a. Once the centrifugation is achieved, SWNTs are fractionated with a flat opened needle at approximately 0.2 mL/min and DWNTs are fractionated with the gradient station device (Biocomp). For both kinds of samples, 0.2 mL of sorted CNTs is extracted for each fraction.
Optical absorption measurements have been performed with a UV–vis–IR Perkin Elmer spectrometer. TEM observations have been done with either a FEI CM20 or a ZEISS Libra 200F TEM microscopes and diameter measurements performed over almost 100 tubes per layer.
3 Results and discussion
3.1 SWNTs sorting SWNTs sorting show different colors which are relevant of differences in OAS shown in the inset of Fig. 1.
The OAS shows particularly a red shift of the S22 band, as the density i.e. the layer number increases. This can be understood as the increase of the mean diameter of the measured carbon nanotubes, since the relationship between the absorption band wavelength and the diameter can be estimated to be linear.
Referring to Bachilo et al. [14], it is possible to evaluate the mean diameter from energies of absorption bands, provided to take into account the surfactant–nanotube interaction equal to 13 meV [15]. This evaluation is presented as open and filled squares in Fig. 2a, for the S11 and the S22 bands, respectively. The mean diameter evaluation is slightly different depending if we consider the S11 band or the S22 band. The discrepancy may originate from the cut-off due to water above 1850 nm (not shown) which still arises in the S11 band region, and from the fact that, for the lighter fractions, few different CNT structures with a narrow diameter distribution are present, and local deviation from the linear approximation from the model we use becomes visible, and result in several narrow peaks present in the S11 band region.
Figures 2a and 2b present the results of TEM analyses. The detailed procedure for measuring the nanotube diameter from its high-resolution image is detailed in Ref. [6]. Providing calibrations are made correctly, we estimated the uncertainty of the diameter determination to be equal to 0.1 nm. Considering plots of Fig. 2a, there is a good qualitative agreement between TEM and OAS measure-ments of the mean diameters of the tubes present in the
Figure 1 (online color at: www.pss-b.com) OAS of different layers of sorted SWNTs by diameter. The inset on the right shows the SWNT density gradient solution after DGU and the position of the layers extracted from the gradient.
Figure 2 (a) Mean diameter evolution from one layer to another, as determined from optical absorption band S11 and S22 and from TEM analyses. (b) Standard deviation of the diameter distribution as a function of the layer number deduced from TEM data.
different layers. However, TEM analyses afford additional information since is provides with a direct determination of the real diameter distribution in a given layer, which cannot be extracted from OAS spectra. As a result, Fig. 2b displays the standard deviation characterizing the diameter distri-bution in each layer. It shows a clear increase as the layers observed are denser and denser, and as the sorting is less and less efficient. One can use these data as a quantitative evaluation of the sorting, especially upon iteration of the process to achieve almost pure sorted layers.
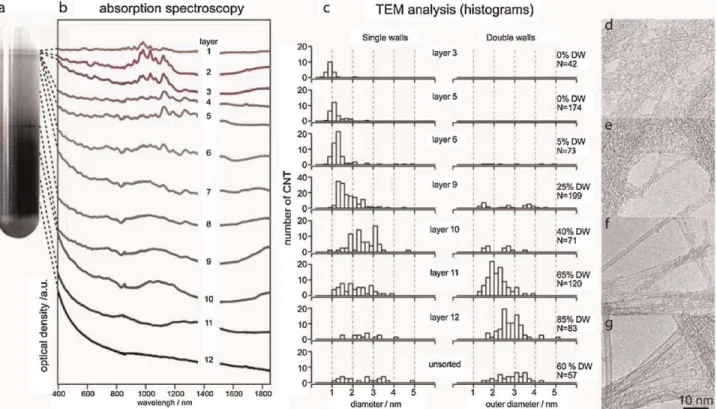
3.2 DWNTs sorting The advantages of TEM analyses with respect to OAS measurements become even more decisive in the case of DWNTs as shown in Fig. 3. TEM reveals very clearly the efficiency of the sorting procedure for separating SWNT from DWNT initially mixed in the unprocessed sample in a ratio 3:5. The layers 1–6 contain SWNT only whereas the concentration in DWNT is larger than 80% in layer 12. Furthermore, CNTs of each kind are also efficiently sorted by diameter as shown from the diameter distributions in Fig. 3c. TEM images in Figs. 3d–3g illustrate the drastic differences in the tube structure in the different layers.
In contrast, analysis of optical absorption spectra is very complex. One obvious reason is the lack of reliable data
concerning DWNT [5, 15]. Another source of complexity lies in the diameter range in turn. First, considering the SWNT present in the top layers, their small diameters and large standard deviation, as identified by TEM, lead to several different S11 and S22 peaks making rather difficult the analysis of the corresponding optical spectra. Second, with a concentration in DWNTs larger than 85%, the absorption spectrum of 12th layer is dominated by the response of DWNTs. Nevertheless, its characteristics do not display any recognizable feature known for this kind of tubes. This indicates that some of the bands may be out of range from our experimental setup, as well as a possible reduction in the OAS intensity due to the DWNTs nature.
Finally, layers 9–11 appear to be transition layers, mixing SWNT with large diameters and DWNT with small diameters. In particular, the 11th layer contains a non-negligible amount of SWNTs with however a mean diameter slightly lower than the 10th layer. This indicates that SWNTs are no more sorted from their diameter above the 10th layer density, and their diameter distribution almost looks like the unsorted one. SWNTs present in the 11th layer may be in small bundles, and therefore explain the observed red shift of the layer 11th compared to the 10th layer, assuming the absence of OAS for DWNTs as denoted on layer 12.
Figure 3 (online color at: www.pss-b.com) (a) Centrifuge tube of the DGU sorted DWNTs and the position of the layers taken inside the gradient. (b) OAS of different layers of sorted DWNTs. White stripe hides the meaningless water absorption peak. (c) TEM analysis of different layers, showing the increase of the mean diameter, the change in relative concentration from SWNTs to DWNTs and the change in distribution shape;N refers to the number of analyzed CNTs. (d)–(g) TEM images of SWNTs and DWNTs from layers 3, 6, 10, and 12, respectively.
4 Conclusion We have shown the efficiency of the statistical diameter analysis by TEM for evaluating in a quantitative way the DGU sorting procedure, the obvious advantage of TEM analysis being to provide with a direct determination of the diameter distribution of a sample. The DGU procedure has been applied for the first time to the separation of SWNT and DWNT displaying a broad range of diameters (0.8–5 nm). Efficiency of the sorting is decisively demonstrated by TEM analyses. Further work is in progress to exploit these data in order to identify the optical absorption response of sorted DWNT.
Acknowledgements Part of this work was supported by the ‘‘Agence Nationale de la Recherche’’France (A.N.R.) (Project ‘‘CEDONA’’ of the program PNANO 2007), the European Commission under the 6th Framework Program (STREP project BNC Tubes, contract number NMP4-CT-2006-03350) and done within the framework of the GDR-I ‘‘Nano-I’’ (N- 2756) of the CNRS. The authors would like to thank Sylvie Rimsky for her grateful help for the centrifugation setup.
References
[1] P. Avouris and J. Chen, Mater. Today9, 46 (2006). [2] W. Kim, H. C. Choi, M. Shim, Y. Li, D. Wang, and H. Dai,
Nano Lett.2, 703 (2002).
[3] E. Flahaut, R. Bacsa, A. Peigney, and C. Laurent, Chem. Commun.12, 1442 (2003).
[4] M. S. Arnold, A. A. Green, J. F. Hulvat, S. I. Stupp, and M. C. Hersam, Nature Nanotechnol.1, 60 (2006).
[5] A. A. Green and M. C. Hersam, Nature Nanotechnol.4, 64 (2009).
[6] R. Fleurier, J. S. Lauret, U. Lopez, and A. Loiseau, Adv. Funct. Mater19, 2219 (2009).
[7] Y. Sato, K. Yanagi, Y. Miyata, K. Suenaga, H. Kataura, and S. Iijima, Nano Lett.8, 3151 (2008).
[8] A. M. Rao, E. Richter, S. Bandow, B. Chase, P. C. Eklund, K. A. Williams, S. Fang, K. R. Subbaswamy, M. Menon, A. Thess, R. E. Smalley, G. Dresselhaus, and M. S. Dres-selhaus, Science275, 187 (1997).
[9] J.-S. Lauret, C. Voisin, G. Cassabois, C. Delalande, Ph. Roussignol, O. Jost, and L. Capes, Phys. Rev. Lett. 90, 057404 (2003).
[10] M. J. O’Connell, S. M. Bachilo, C. B. Huffman, V. C. Moore, M. S. Strano, E. H. Haroz, K. L. Rialon, P. J. Boul, W. H. Noon, C. Kittrell, J. Ma, R. H. Hauge, R. B. Weisman, and R. E. Smalley, Science 297, 293 (2002).
[11] J.-S. Lauret, C. Voisin, G. Cassabois, P. Roussignol, C. Delalande, A. Filoramo, L. Capes, E. Valentin, and O. Jost, Physica E21, 1057 (2004).
[12] Ph. Lambin, V. Meunier, L. Henrard, and A. A. Lucas, Carbon38, 1713 (2000).
[13] H. Jiang, A. G. Nasibulin, D. P. Brown, and E. I. Kauppinen, Carbon45, 662 (2007).
[14] S. M. Bachilo, M. S. Strano, C. Kittrell, R. H. Hauge, R. E. Smalley, and R. B. Weisman, Science 298, 231 (2002).
[15] T. Hertel, A. Hagen, V. Talalaev, K. Arnold, F. Hennrich, M. Kappes, S. Rosenthal, J. McBride, H. Ulbricht, and E. Flahaut, Nano Lett.5, 511 (2005).