This is an author-deposited version published in: http://oatao.univ-toulouse.fr/ Eprints ID: 8452
To link to this article:
DOI:10.3168/jds.2012-5690
URL:
http://dx.doi.org/10.3168/jds.2012-5690
To cite this version:
Zened, Asma and Enjalbert, Francis and Nicot,
Marie-Claude and Troegeler-Meynadier, Annabelle Starch plus sunflower oil
addition to the diet of dry dairy cows results in a trans-11 to trans-10 shift
of biohydrogenation. (2013) Journal of Dairy Science, 96 (1). pp.
451-459. ISSN 0022-0302
O
pen
A
rchive
T
oulouse
A
rchive
O
uverte (
OATAO
)
OATAO is an open access repository that collects the work of Toulouse researchers and makes it freely available over the web where possible.
Any correspondence concerning this service should be sent to the repository administrator: staff-oatao@listes-diff.inp-toulouse.fr!
ABSTRACT
Trans fatty acids (FA), exhibit different biological properties. Among them, cis-9,trans-11 conjugated linoleic acid has some interesting putative health prop-erties, whereas trans-10,cis-12 conjugated linoleic acid has negative effects on cow milk fat production and would negatively affect human health. In high-yielding dairy cows, a shift from trans-11 to trans-10 pathway of biohydrogenation (BH) can occur in the rumen of cows receiving high-concentrate diets, especially when the diet is supplemented with unsaturated fat sources. To study this shift, 4 rumen-fistulated nonlactating Hol-stein cows were assigned to a 4 × 4 Latin square design with 4 different diets during 4 periods. Cows received 12 kg of dry matter per day of 4 diets based on corn silage during 4 successive periods: a control diet (22% starch, <3% crude fat on DM basis), a high-starch diet supplemented with wheat plus barley (35% starch, <3% crude fat), a sunflower oil diet supplemented with 5% of sunflower oil (20% starch, 7.6% crude fat), and a high-starch plus sunflower oil diet (33% starch, 7.3% crude fat). Five hours after feeding, proportions of trans-11 BH isomers greatly increased in the rumen content with the addition of sunflower oil, without change in ruminal pH compared with the control diet. Addition of starch to the control diet had no effect on BH pathways but decreased ruminal pH. The addition of a large amount of starch in association with sunflower oil increased trans-10 FA at the expense of trans-11 FA in the rumen content, revealing a trans-11 to trans-10 shift. Interestingly, with this latter diet, ruminal pH did not change compared with a single addition of starch. This trans-11 to trans-10 shift occurred progressively, after a decrease in the proportion of trans-11 FA in the
rumen, suggesting that this shift could result from a dysbiosis in the rumen in favor of trans-10-producing bacteria at the expense of those producing trans-11 or a modification of bacterial activities.
Key words: rumen biohydrogenation , trans-10 shift ,
starch , sunflower oil
INTRODUCTION
Because of their effects on human health, trans FA are interesting to study. They are found in great quantities in ruminant products because they are formed during ruminal biohydrogenation (BH) of dietary PUFA. A large number of positional and geometrical isomers are produced during BH, including conjugated linoleic acids (CLA), which result from isomerization of cis-9,cis-12 C18:2 and are, thereafter, reduced to trans C18:1. Some of these isomers escape a full ruminal BH to C18:0 and can, directly or after tissue desaturation of trans-11 C18:1 to cis-9,trans-11 CLA, be found in meat and milk products. In most cases, trans-11 isomers represent the major part of these BH intermediates, but a shift to-ward a trans-10 isomerization can occur (Griinari et al., 1998). This shift leads to an increase in trans-10,cis-12 CLA, which has been shown to decrease the mammary synthesis of de novo FA, inducing milk fat depression in dairy cows (Baumgard et al., 2000). Moreover, trans-10,cis-12 CLA has possible detrimental effects on hu-man health; for example, it increases atherogenic risk in humans and stimulates mammary tumorigenesis in rat models (Tricon et al., 2004; Ip et al., 2007). On the contrary, cis-9,trans-11 CLA is more desirable because of its anticarcinogenic and other health-promoting properties (Kritchevsky, 2000; Whigham et al., 2000). Because of these negative consequences, understanding the conditions of the trans-10 shift is of interest.
Wide variability in the trans-10:trans-11 isomers ratio has been observed in milk fat (Shingfield et al., 2006) and, among dietary factors inducing this shift, high proportion of concentrates (Piperova et al., 2002),
Starch plus sunflower oil addition to the diet of dry dairy cows
results in a trans-11 to trans-10 shift of biohydrogenation
A. Zened ,*†‡ F. Enjalbert ,*†‡ M. C. Nicot ,*†‡ and A. Troegeler-Meynadier *†‡1* Université de Toulouse INPT ENVT, UMR1289 Tissus Animaux Nutrition Digestion Ecosystème et Métabolisme, F-31076 Toulouse, France † INRA, UMR1289 Tissus Animaux Nutrition Digestion Ecosystème et Métabolisme, F-31326 Castanet-Tolosan, France
‡ Université de Toulouse INPT ENSAT, UMR1289 Tissus Animaux Nutrition Digestion Ecosystème et Métabolisme, F-31326 Castanet-Tolosan, France
1
addition of unsaturated fat (Roy et al., 2006), or a combination of these dietary factors (Griinari et al., 1998; Loor et al., 2004) have been outlined. The BH shift from trans-11 to trans-10 isomers usually, but not systematically, occurs in high-producing dairy farms in which diets are typically based on corn silage with high concentrate level associated or not with an unsaturated FA source. Griinari et al. (1998) demonstrated a signifi-cant interaction between concentrate level and the type of dietary fat (saturated vs. unsaturated), but Loor et al. (2004) did not find an interaction between these 2 factors, probably because their high-concentrate diet contained less starch and because the nature of forage: starch and fat were different [chopped alfalfa hay vs. long grass hay, corn vs. wheat, and corn oil vs. linseed oil in the experiments of Griinari et al. (1998) and Loor et al. (2004), respectively]. Moreover, Roy et al. (2006) showed strong time-dependent changes in the ratio be-tween trans-10 and trans-11 isomers during the 2 first weeks of oil supplementation, suggesting that the ad-aptation of the ruminal microflora to lipid supplements could be a modulator of the trans-11 to trans-10 shift.
Our hypothesis was that starch and cis-9,cis-12 C18:2 dietary levels interact to result in a trans-11 to trans-10 shift of BH. To confirm this hypothesis, we separated, using a factorial design, the effect of dietary starch level from that of oil supplementation, using wheat and bar-ley as starch sources, as they carry minimal amounts of cis-9,cis-12 C18:2 as opposed to corn. Moreover, we investigated the changes in ruminal fermentations dur-ing the establishment of the BH shift.
MATERIALS AND METHODS
Animals and Experimental Design
Four dry ruminally fistulated Holstein cows were as-signed to a 4 × 4 Latin square design with 4 periods and 4 different diets based on corn silage and soybean meal: control (CON) diet, high-starch (HS) diet, oil (OL) diet, and HS plus OL (HS+OL) diet. These di-ets had similar ingredients and chemical compositions (Table 1) to usual diets for lactating dairy cows.
Cows were housed in individual stalls and received 12.5 kg of DM daily, in 2 equal meals at 0900 and 1700 h and had free access to water. Each 4-wk pe-riod consisted of 2 washout weeks with the CON diet, followed by 2 wk (further referred to as experimental subperiods) with the CON, HS, OL, or HS+OL diet. To avoid carryover effects, treatment orders were differ-ent among cows: (HS+OL, OL, HS, and CON for cow 1; OL, CON, HS+OL, and HS for cow 2; CON, HS, OL, and HS+OL for cow 3; and HS, HS+OL, CON, and OL for cow 4).
One liter of rumen fluid was collected from each cow at 5 h postfeeding every 2 d from d 0 (last day of the washout weeks) to d 14 and strained through a metal sieve (1.6-mm mesh). The pH was measured immedi-ately with a glass electrode connected to a digital pH meter. Each 1-L sample was divided into 3 aliquots: 2 × 5 mL were transferred to 10-mL vials containing 0.5 mL of 2% HgCl2 for VFA and lactate assays, and 100
mL were kept for FA determination. All samples were Table 1. Ingredients and nutrient composition of diets
Item Diet1 CON OL HS HS+OL Ingredient, % of DM Corn silage 68.7 63.2 37.7 32.3 Alfalfa hay 14.3 14.3 0.0 0.0 Wheat + barley 0.0 0.0 48.5 48.5 Soybean meal 15.5 16.2 12.4 13.1 Sunflower oil 0.0 4.8 0.0 4.7 Mineral-vitamin premix2 1.5 1.5 1.5 1.5 Composition, % of DM CP 14.6 14.6 14.2 14.2 NDF 39.7 37.3 30.9 28.6 Starch 21.5 19.8 34.8 33.1 Crude fat 2.9 7.6 2.7 7.3 FA composition, % of DM cis-9 C18:1 0.3 1.4 0.2 1.3 cis-9,cis-12 C18:2 0.9 3.4 0.9 3.4 cis-9,cis-12,cis-15 C18:3 0.1 0.1 0.1 0.1 1
CON = control diet; HS = high-starch diet; OL = sunflower oil diet; HS+OL = HS plus OL diet.
2
Contained (per kilogram of premix, DM basis) P: 40 g, Ca: 260 g, Mg: 50 g, Na: 20 g, Zn: 5 g, Mn: 4 g, Cu: 1 g, I: 40 mg, Co: 20 mg, Se: 20 mg, vitamin A: 450,000 IU, vitamin D3: 100,000 IU, and vitamin E: 1,500 IU.
stored at −20°C for later analysis. Moreover, on d 13, ruminal content redox (Eh) values were recorded con-tinuously according to the method described by Julien et al. (2010). Only Eh values corresponding to 5 h after morning meal were used for statistical analysis.
Chemical Analysis
Concentrations of VFA in the rumen were determined by the method of Playne (1985) using automated gas separation, modified as follows: the ruminal samples were first centrifuged at 4,000 × g for 20 min to separate the liquid phase. For protein removal, 1 mL of super-natant was mixed with 200 µL of 25% metaphosphoric acid and further centrifuged at 20,000 × g for 15 min. One milliliter of supernatant was added to 200 µL (1% vol/vol) of 4-methylvaleric acid as internal standard and 1 µL of the mixture was then injected into a gas chromatograph [model 5890 series II, equipped with a flame ionization detector; Hewlett-Packard, Avondale, PA]. For lactic acid assay, total lactate (-lactate) was determined using a commercial kit (catalog no. 11 112 821 035; Boehringer Mannheim/R-Biopharm, Rueil Malmaison, France).
The FA of ruminal fluids were analyzed as detailed by Zened et al. (2011). Briefly, FA were extracted and methylated using a procedure adapted from Park and Goins (1994), except that the solution of 14% of boron trifluoride in methanol was replaced by a solution of methanol-acetyl chloride (10:1). Nonadecanoic acid (C19:0) was used as the internal standard at a dose of 0.8 mg. The FA methyl esters were then quantified by gas chromatography (Agilent 6890N, Network GC System, equipped with a model 7683 autoinjector; Agilent Technologies Inc., Palo Alto, CA) using a fused silica capillary column (100 m × 0.25-mm i.d., 0.20-µm film thickness, CPSil88; Varian BV, Middelburg, the Netherlands). Peaks were identified and quantified by comparison with commercial standards (Sigma Co., St Louis, MO), except C18:1 other than trans-9 C18:1,
trans-11 C18:1, and cis-9 C18:1, which were identified by order of elution. The integration of chromatograms was done using the software Peak Simple (Peak Simple Data System, version 3.29; SRI Instruments, Torrance, CA).
Calculations and Statistical Analysis
Sums of CLA and trans C18:1 were obtained by adding proportions of all isomers measured; sums of
trans-10 and trans-11 isomers were obtained by add-ing trans-10 and trans-11 isomers originatadd-ing from cis-9,cis-12 C18:2 BH:
Sum of CLA = trans-10,cis-12 CLA + cis-9,cis-11 CLA + cis-9,trans-11 CLA + trans-9,trans-11 CLA
+ trans-9,trans-13 CLA;
Sum of trans C18:1 = sum from trans-4 C18:1 to trans-16 C18:1;
Sum of trans-10 isomers = trans-10,cis-12 CLA + trans-10 C18:1;
Sum of trans-11 isomers = cis-9,trans-11 CLA + trans-9,trans-11 CLA + trans-11 C18:1. Statistical analyses were performed using the GLM procedure of SYSTAT (version 9, 1998; SPSS Inc., Chicago, IL) and reported as mean values and their standard errors. Initial (d 0) trans-10 and trans-11 percentages, acetate:propionate ratio, and ruminal pH were analyzed using the following model:
Variable = mean + cow effect + period effect + diet effect + residual error.
Effects at d 12 (and d 13 for Eh) were analyzed using the following model:
Variable = mean + cow effect + period effect + starch effect + oil effect + starch × oil interaction effect + residual error.
Evolution of trans-10 and trans-11 percentages, acetate:propionate ratio, and ruminal pH from d 0 to 14 of experimental subperiods were analyzed as re-peated measures, using sampling day within period as the repeated factor. The within-subjects error term was used to test the effects of sampling day and of sampling day × diet interactions.
RESULTS
Time-Dependent Changes in Ruminal Parameters Measured
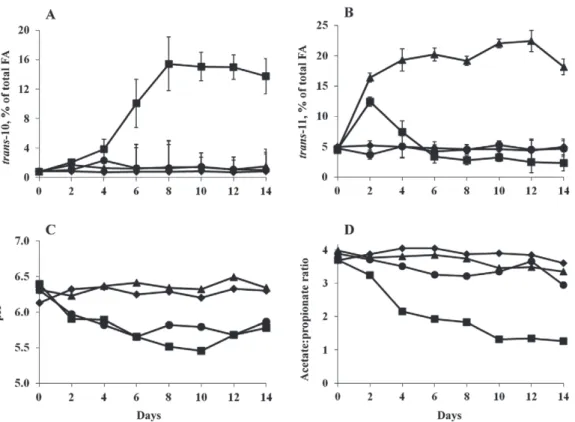
On d 0, trans-10 and trans-11 percentages, acetate:propionate ratio, and ruminal pH in the rumen fluid were not statistically different among experimen-tal diets (Figure 1). During the experimenexperimen-tal subpe-riods, an interaction between oil and starch additions and the sampling day (Figures 1A and 1B) linearly
affected trans-10 (P = 0.01) and linearly and qua-dratically affected trans-11 (P < 0.01) percentages. For
trans-10 isomers (Figure 1A), the values were strongly increased with the HS+OL diet from d 4, a maximum of 15.5% (% of total FA) was reached on d 8, and then values remained stable. With the other diets, trans-10 percentages (% of total FA) were ≤2%, over all of the experimental subperiod.
For trans-11 isomers (Figure 1B), the highest values were obtained with the OL diet, with a maximum of 22.5% (% of total FA) reached on d 10 and 12. On d 2, the HS+OL diet also induced higher trans-11 per-centages (12.4%) than the CON or HS diets (4.5%, on average), but this percentage rapidly decreased to 3.4% on d 6 and remained stable around 2.7% up to d 14 [i.e., below values obtained with the CON or HS diets (4.7%, on average) from d 6 to 14].
An interaction between starch addition and sampling day significantly and quadratically affected ruminal pH measured 5 h after meal (Figure 1C): diets without starch induced a constant pH around 6.3, whereas diets with starch led to some variations between sampling days; in particular, the lowest values were observed for the HS+OL diet on d 8 and 10. The acetate:propionate
ratio was also quadratically affected by an interaction between starch addition and sampling day (P = 0.01). The lowest ratio was obtained with the HS+OL diet; it decreased gradually from 3.2 on d 2 to 1.3 on d 14 (Fig-ure 1D). With the other diets, the acetate:propionate ratio was stable over all of the experimental period and was 3.6, on average.
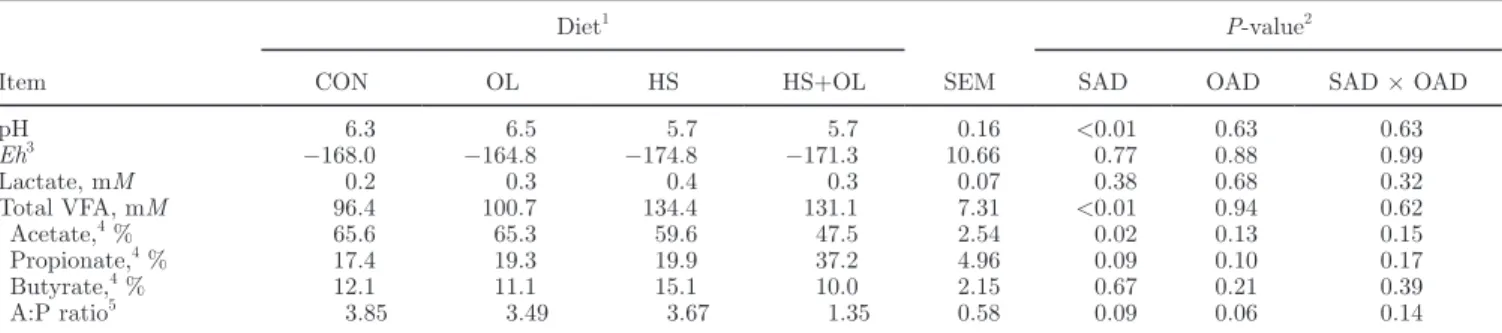
Changes in Ruminal Fermentative Parameters and FA Profiles in Response to Starch and Oil Additions to the Diet and Their Interaction After 12 d of Distribution
The 5-h postfeeding ruminal pH was decreased from 6.4 to 5.7 when starch was added to the diet, whereas
Eh and lactate concentration were not modified by the diet of cows (Table 2). Total VFA concentrations were significantly higher in the rumen of cows receiving HS and HS+OL diets than in those of CON and OL diet-fed cows: 133 versus 98 mM (on average), respectively (Table 2). Starch addition significantly decreased molar proportion of acetate, especially with the HS+OL diet. The lowest propionate proportion (17.4%) was obtained with the CON diet and the highest one (37.2%) with Figure 1. Evolution of trans-10 (A) and trans-11 (B) ruminal percentages (/total FA), pH (C), and acetate:propionate ratio (D) from d 0 to 14 after the beginning of distribution of the experimental diet: control diet (CON diet; !), high-starch diet (HS diet; t), sunflower oil diet (OL diet; u), or HS plus OL diet (HS+OL diet; v).
the HS+OL diet, but the effects of starch and oil addi-tions were not statistically significant.
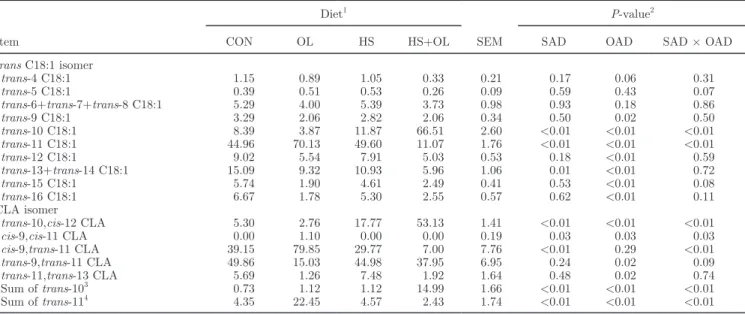
Total FA content in rumen fluid 5 h after a meal was the highest with the HS+OL diet, followed by the OL, CON, and HS diets (Table 3). Regarding ruminal FA profile, when cows did not receive sunflower oil in the diet (CON and HS diets), trans-11 C18:1 was the main trans C18:1 isomer at d 12 and trans-9,trans-11 CLA was the main CLA isomer. These diets contained less than 1% cis-9,cis-12 C18:2, whose BH was almost complete, as shown by the low ruminal proportions of cis-9,cis-12 C18:2, trans C18:1, and CLA. Except for C13:0 and anteiso C13:0, whose percentages were very low, percentages of odd- and branched-chain FA (cis-9,cis-12 C18:2 and cis-9,cis-12,cis-15 C18:3) were significantly decreased and percentages of trans C18:1 were significantly increased by oil addition (Table 3). All trans C18:1 isomers, except trans-5, trans-6+trans-7+trans-8, and trans-10 C18:1, were negatively affected by oil addition. Oil addition significantly decreased (P = 0.02; Table 4) 11,13 CLA and trans-9,trans-11 CLA. Starch addition induced a significant decrease in trans-13+trans-14 C18:1, and trans-11 FA and an increase in trans-10 isomers (Table 4).
Interaction between starch and oil addition led to the highest proportion of trans-10 C18:1 with the HS+OL diet and the highest proportion of trans-11 C18:1 with the OL diet. For CLA isomers, a similar interaction was noticed, leading to the highest values of
trans-10,cis-12 CLA with the HS+OL diet (53.1% CLA versus an average of 8.6% with the 3 other diets) and the highest cis-9,trans-11 CLA with the OL diet (79.8% CLA versus 25.3%; Table 4). An interaction between starch and oil addition affected cis-9,cis-11 CLA, which was only detected in rumen fluid from the OL diet-fed cows. With the HS+OL diet, trans-10 were the major
isomers, whereas trans-11 isomers were present in low proportions (except trans-9,trans-11 CLA).
DISCUSSION
Before receiving the experimental diet (d 0), all cows had a ruminal trans-10:trans-11 ratio under 0.3, including cows that exhibited a high trans-10:trans-11 ratio during the preceding experimental period. This demonstrates that our 2-wk washout was sufficient for a kinetic study of dietary factors leading to a trans-10 shift.
Oil addition to the diets decreased the percentage of
cis-9,cis-12 C18:2, which can be explained by a high BH efficiency of high-dietary-fat diets (Schmidely et al., 2008). Moreover, cis-9,cis-12 C18:2 from added oil was more easily accessible to biohydrogenating bacteria than cis-9,cis-12 C18:2 from other dietary components, whose fat is inside vegetal cells (Steele et al., 1971). In our experiment, oil addition increased by 2.8 fold the percentages of trans C18:1 isomers. Such an accumula-tion of trans C18:1 is known to be due to a saturaaccumula-tion of the last BH reaction (i.e., the reduction of trans-C18:1 to C18:0; Troegeler-Meynadier et al., 2006).
At d 12, the high proportion of trans-9,trans-11 CLA with the HS+OL diet possibly resulted from its synthesis by Selenomonas ruminantium (Fujimoto et al., 1993), which can grow at low pH and is resis-tant to unsaturated FA (Maia et al., 2007). The shift from the trans-11 to the trans-10 BH pathway with the HS+OL diet appeared progressively; the trans-11 isomers increased until d 2 and then decreased until d 6, whereas the trans-10 isomers increased until d 8 (Figure 1). This progressive change is consistent with the results of Shingfield et al. (2006) and Roy et al. (2006). Nevertheless, contrary to our results and those Table 2. Effects of starch and oil addition to the diets and their interaction on fermentative parameters in the rumen 5 h after a meal on d 12
Item
Diet1
SEM
P-value2
CON OL HS HS+OL SAD OAD SAD × OAD pH 6.3 6.5 5.7 5.7 0.16 <0.01 0.63 0.63 Eh3 −168.0 −164.8 −174.8 −171.3 10.66 0.77 0.88 0.99 Lactate, mM 0.2 0.3 0.4 0.3 0.07 0.38 0.68 0.32 Total VFA, mM 96.4 100.7 134.4 131.1 7.31 <0.01 0.94 0.62 Acetate,4 % 65.6 65.3 59.6 47.5 2.54 0.02 0.13 0.15 Propionate,4 % 17.4 19.3 19.9 37.2 4.96 0.09 0.10 0.17 Butyrate,4 % 12.1 11.1 15.1 10.0 2.15 0.67 0.21 0.39 A:P ratio5 3.85 3.49 3.67 1.35 0.58 0.09 0.06 0.14 1
CON = control diet; HS = high-starch diet; OL = sunflower oil diet; HS+OL = HS plus OL diet.
2
SAD = effect of starch addition; OAD = effect of oil addition; SAD × OAD = effect of interaction between SAD and OAD.
3
Redox potential (Eh) recorded at d 13.
4
Expressed as molar proportion of total VFA.
5
Table 3. Effects of starch and oil addition to the diets and their interaction on the total FA content (mg/g of DM) and FA profile (% of total FA) in the rumen of dry dairy cows sampled 5 h after a meal on d 12
Item
Diet1
SEM
P-value2
CON OL HS HS+OL SAD OAD SAD × OAD Total FA content 47.27 81.02 46.43 101.92 3.72 0.04 <0.01 0.03 C12:0 0.32 0.11 0.37 0.45 0.08 0.05 0.47 0.12 C13:0 0.07 0.03 0.09 0.10 0.03 0.18 0.68 0.52 anteiso C13:0 0.02 0.01 0.01 0.01 0.01 0.55 0.24 0.75 iso C13:0 0.12 0.04 0.10 0.06 0.01 0.95 <0.01 0.31 C14:0 0.65 0.33 1.25 1.32 0.39 0.09 0.76 0.65 C15:0 0.94 0.38 0.81 0.43 0.06 0.63 <0.01 0.31 anteiso C15:0 1.04 0.38 1.54 0.77 0.10 <0.01 <0.01 0.61 iso C15:0 0.56 0.22 0.52 0.14 0.03 0.06 <0.01 0.54 C16:0 15.07 10.31 18.00 10.57 0.45 0.01 <0.01 0.03 C16:1 0.05 0.04 0.10 0.18 0.04 0.04 0.37 0.23 C17:0 0.53 0.24 0.43 0.28 0.04 0.43 <0.01 0.11 anteiso C17:0 0.45 0.21 0.84 0.15 0.14 0.28 0.01 0.14 iso C17:0 0.21 0.09 0.21 0.06 0.01 0.31 <0.01 0.35 C18:0 39.70 35.18 37.87 48.84 4.51 0.24 0.50 0.14 cis-9 C18:1 2.95 5.31 3.53 2.33 0.37 0.02 0.16 <0.01 cis-11 C18:1 0.49 0.49 1.10 1.23 0.36 0.10 0.85 0.85 cis-12 C18:1 0.58 0.38 0.55 0.34 0.13 0.82 0.17 0.96 cis-15 C18:1 0.06 0.04 0.06 0.05 0.03 0.79 0.69 0.81 trans C18:13 8.78 27.99 8.85 21.80 2.74 0.31 <0.01 0.30 cis-9,cis-12 C18:2 6.64 4.20 9.44 3.50 0.52 0.20 <0.01 0.05 CLA4 0.38 2.84 0.25 0.15 0.76 0.11 0.17 0.14 trans-11,cis-15 C18:2 0.15 0.23 0.08 0.13 0.06 0.25 0.37 0.86 cis-9,cis-12,cis-15 C18:3 0.86 0.49 0.66 0.22 0.10 0.06 <0.01 0.73 1
CON = control diet; HS = high-starch diet; OL = sunflower oil diet; HS+OL = HS plus OL diet.
2
SAD = effect of starch addition; OAD = effect of oil addition; SAD × OAD = effect of interaction between SAD and OAD.
3trans
C18:1 = trans-4 C18:1 + trans-5 C18:1 + trans-6+trans-7+trans-8 C18:1 + trans-9 C18:1 + trans-10 C18:1 + trans-11 C18:1 + trans-12 C18:1 + trans-13+trans-14 C18:1 + trans-15 C18:1 + trans-16 C18:1.
4Conjugated linoleic acid (CLA) = trans-10,cis-12 CLA + cis-9,cis-11 CLA + cis-9,trans-11 CLA + trans-9,trans-11 CLA + trans-9,trans-13
CLA.
Table 4. Effects of starch and oil addition to the diets and their interaction on the isomeric profile of trans C18:1 and conjugated linoleic acid (CLA) isomers (expressed as % of total trans C18:1 and total CLA, respectively) in the rumen of dry dairy cows sampled 5 h after a meal on d 12
Item
Diet1
SEM
P-value2
CON OL HS HS+OL SAD OAD SAD × OAD
trans C18:1 isomer trans-4 C18:1 1.15 0.89 1.05 0.33 0.21 0.17 0.06 0.31 trans-5 C18:1 0.39 0.51 0.53 0.26 0.09 0.59 0.43 0.07 trans-6+trans-7+trans-8 C18:1 5.29 4.00 5.39 3.73 0.98 0.93 0.18 0.86 trans-9 C18:1 3.29 2.06 2.82 2.06 0.34 0.50 0.02 0.50 trans-10 C18:1 8.39 3.87 11.87 66.51 2.60 <0.01 <0.01 <0.01 trans-11 C18:1 44.96 70.13 49.60 11.07 1.76 <0.01 <0.01 <0.01 trans-12 C18:1 9.02 5.54 7.91 5.03 0.53 0.18 <0.01 0.59 trans-13+trans-14 C18:1 15.09 9.32 10.93 5.96 1.06 0.01 <0.01 0.72 trans-15 C18:1 5.74 1.90 4.61 2.49 0.41 0.53 <0.01 0.08 trans-16 C18:1 6.67 1.78 5.30 2.55 0.57 0.62 <0.01 0.11 CLA isomer
trans-10,cis-12 CLA 5.30 2.76 17.77 53.13 1.41 <0.01 <0.01 <0.01
cis-9,cis-11 CLA 0.00 1.10 0.00 0.00 0.19 0.03 0.03 0.03
cis-9,trans-11 CLA 39.15 79.85 29.77 7.00 7.76 <0.01 0.29 <0.01
trans-9,trans-11 CLA 49.86 15.03 44.98 37.95 6.95 0.24 0.02 0.09
trans-11,trans-13 CLA 5.69 1.26 7.48 1.92 1.64 0.48 0.02 0.74
Sum of trans-103 0.73 1.12 1.12 14.99 1.66 <0.01 <0.01 <0.01 Sum of trans-114 4.35 22.45 4.57 2.43 1.74 <0.01 <0.01 <0.01
1
CON = control diet; HS = high-starch diet; OL = sunflower oil diet; HS+OL = HS plus OL diet.
2
SAD = effect of starch addition; OAD = effect of oil addition; SAD × OAD = effect of interaction between SAD and OAD.
3Sum of trans-10 = trans-10,cis-12 CLA + trans-10 C18:1.
of Shingfield et al. (2006), Roy et al. (2006) observed a peak of trans-11 isomers 4 to 6 d after the beginning of oil supplementation, which probably is related to their progressive incorporation of oil into the diets, the maximal incorporation rate being reached on d 4.
In our experiment, the synergistic effects of starch and oil dietary supplementations to cows induced a shift from trans-11 to trans-10 pathway of BH. Piper-ova et al. (2002) evidenced a trans-10 shift of BH with starch addition without dietary fat supplementation in lactating dairy cows. Lack of trans-10 shift in our experimentation when adding starch but not oil could be due to a much lower DMI in dry cows compared with lactating dairy cows, which could affect pH, VFA concentration, and residence time of starch and FA in the rumen. Moreover, in the experiment of Piperova et al. (2002), the cis-9,cis-12 C18:2 level reached 2.1% of DM because they used corn silage plus corn grain, which are rich in this FA. In our study, the HS diet only contained 0.9% cis-9,cis-12 C18:2 on a DM basis. On the other hand, the best-known trans-11 FA-producing bacterium, Butyrivibrio fibrisolvens, is known to be very sensitive to a high-starch diet (Klieve et al., 2003) and the optimal pH of its cis-9,cis-12 C18:2 isomerase is between 7.0 and 7.2 (Kepler and Tove., 1967). In our experiment, the HS diet only contained a low amount of cis-9,cis-12 C18:2 so that, in spite of the high-starch diet, this bacterium could have been able to carry out BH.
Maia et al. (2010) demonstrated in vitro that cis-9,cis-12 C18:2 has a bacteriostatic effect on B.
fibrisol-vens. In spite of this toxic effect, with our OL diet, the
trans-11 biohydrogenating process remained very effi-cient, leading to high percentages of cis-9,trans-11 CLA and trans-11 C18:1. This diet contained around 63% corn silage and 14% alfalfa hay (on DM basis), which represented good conditions for the fibrolytic bacteria, and could have resulted in this high BH capacity. In the experiment of Roy et al. (2006), a diet with similar hay and starch contents, but a lower proportion of corn silage (30.7%, DM basis), led to a trans-10 shift when supplemented with 5% sunflower oil. The difference in our results is probably due to their lactating cows eat-ing more than 18 kg of DM daily compared with 12 kg in the present study and to a lower proportion of forage (46.3% compared with 77.5% in our experiment).
The HS+OL diet also resulted in a low acetate:propionate ratio, with a 2-fold higher propio-nate proportion than the other diets. On the contrary, rumen pH showed a similar pattern between the HS and HS+OL diets. Consistent with our results, Weimer et al. (2010) showed that cows that had a decreased milk fat content when receiving a high-starch diet had
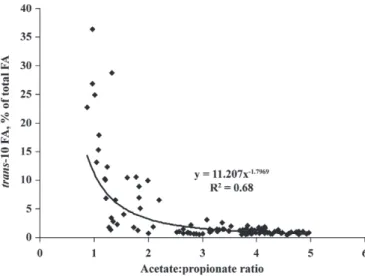
a similar ruminal pH to cows that did not exhibit milk fat depression, but a much lower acetate:propionate ratio. Computing data from d 2 to 14 for all cows, a sig-nificant relationship between trans-10 proportions and acetate:propionate ratio could be evidenced [trans-10 proportion = 11.2 × (acetate:propionate ratio)−1.8, R2 = 0.68; Figure 2]. The role played by rumen pH on the BH pathway has mainly been studied in vivo by adding sodium bicarbonate to the diet of cows. This addition resulted in a decreased proportion of trans-10 isomers in the duodenal flow and in the milk (Piperova et al., 2002; Troegeler-Meynadier et al., 2007). In vitro, Maia et al. (2009) showed that the amount of trans-10 isomers was similar at pH 6.0 and at pH 7.0. In our experiment, with the HS+OL diet, 5 h after the morn-ing meal, which corresponds to the pH nadir (Garrett et al., 1999), the rumen pH was 5.7. With such a pH, the average of daily ruminal pH was probably over 6.0, preventing any pH-related improvement of trans-10 isomers production compared with the high-starch diet and so suggested that a low ruminal pH was not re-sponsible for our observed trans-10 shift.
Milk fat depression, which is due to the trans-10 shift in lactating dairy cows, has already been shown to be associated with changes in the bacterial community (Weimer et al., 2010). Both this specific bacterial com-munity and the particular fermentation pattern result-ing in a very high proportion of propionate suggest that the combination of starch and oil addition resulted in a specific equilibrium between microorganisms. Litera-ture data indicate that Megasphaera elsdenii (Kim et al., 2002) and Propionibacterium acnes (Wallace et al., Figure 2. Relationship between acetate:propionate ratio and
trans-10 FA proportion across all diets from d 2 to 14 after the begin-ning of distribution of the experimental diet.
2007) could be ruminal producers of trans-10 FA. Both of these species are lactate-utilizing bacteria. They can grow at low pH (Therion et al., 1982) and M. elsdenii is resistant to unsaturated FA (Maia et al., 2007). In our experiment, the rumen concentrations of lactate were very low and remained unaffected by the diets, but lac-tate concentration does not accurately reflect laclac-tate production, which precludes any definitive conclusion regarding a relationship between the shift of bacterial community and lactate.
Interestingly, the over-time increase in trans-10 iso-mers with the HS+OL diet was slower than the decrease in trans-11 isomers: a rapid decrease in trans-11 FA occurred from d 2 as opposed to an increase in trans-10 from d 4, so that the sum of trans FA was lower on d 4 than on d 2 and 6 (14.5, 11.3, and 13.5% of total FA, respectively), resulting in a significant (P = 0.0016) quadratic effect of time between d 2 and 6. This could be due to a decreased capacity of the microbiota to isomerize the supplemental cis-9,cis-12 C18:2 because of a negative effect of both starch and oil addition on bacteria that biohydrogenate via the trans-11 pathway, triggering a necessary adaptation of the microbiota to hydrogenate via another pathway (i.e., the trans-10 BH) to avoid toxic effects of unsaturated FA (Maia et al., 2007) by maintaining a low ruminal concentration of
cis-9,cis-12 C18:2. However, this increased production of trans-10 isomers could simply result from changes of the ruminal environment due to high-starch, high-oil diets, leading to a novel ruminal bacterial population equilibrium favoring the production of trans-10 isomers at the expense of trans-11 isomers.
CONCLUSIONS
The addition of starch to a CON diet based on corn silage decreased ruminal pH but had no effect on BH pathways. When sunflower oil, rich in cis-9,cis-12 C18:2, was added to the CON diet, the ruminal pH did not change and the proportion of trans-11 BH inter-mediates in the rumen content greatly increased. The association of increasing starch level and adding cis-9,cis-12 C18:2 to the diet of cows did not change rumi-nal pH compared with the single addition of starch, but resulted in a drastic change in the isomeric profile of FA (trans-10 FA increasing at the expense of trans-11 FA). Temporal changes in the equilibrium between trans-10 and trans-11 intermediates strongly suggest that the increase in BH via the trans-10 pathway was either a consequence of a decrease in the trans-11 BH capacity in the rumen or the consequence of a novel equilibrium in favor of growth or activities of bacteria producing
trans-10 isomers at the expense of those producing
trans-11 isomers.
ACKNOWLEDGMENTS
The authors thank M. L. Chemit and the staff at the experimental station (UMR 1289 Tandem, Toulouse, France).
REFERENCES
Baumgard, L. H., B. A. Corl, D. A. Dwyer, A. Saebø, and D. E. Bau-man. 2000. Identification of the conjugated linoleic acid isomer that inhibits milk fat synthesis. Am. J. Physiol. 278:R179–R184. Fujimoto, K., H. Kimoto, M. Shishikura, Y. Endo, and K. Ogimoto.
1993. Biohydrogenation of linoleic acid by anaerobic bacteria iso-lated from rumen. Biosci. Biotechnol. Biochem. 57:1026–1027. Garrett, E. F., M. N. Pereira, K. V. Nordlund, L. E. Armentano, W.
J. Goodger, and G. R. Oetzel. 1999. Diagnostic methods for the detection of subacute ruminal acidosis in dairy cows. J. Dairy Sci. 82:1170–1178.
Griinari, J. M., D. A. Dwyer, M. A. McGuire, D. E. Bauman, D. L. Palmquist, and K. V. Nurmela. 1998. Trans-octadecenoic acids and milk fat depression in lactating dairy cows. J. Dairy Sci. 81:1251–1261.
Ip, M. M., S. O. McGee, P. A. Masso-Welch, C. Ip, X. Meng, L. Ou, and S. F. Shoemaker. 2007. The t10,c12 isomer of conjugated lin-oleic acid stimulates mammary tumorigenesis in transgenic mice over-expressing erbB2 in the mammary epithelium. Carcinogen-esis 28:1269–1276.
Julien, C., J. P. Marden, C. Bonnefont, R. Moncoulon, E. Auclair, V. Monteils, and C. Bayourthe. 2010. Effects of varying proportions of concentrates on ruminal-reducing power and bacterial com-munity structure in dry dairy cows fed hay-based diets. Animal 4:1641–1646.
Kepler, C. R., and S. B. Tove. 1967. Biohydrogenation of unsaturated fatty acids. 3. Purification and properties of a linoleate delta-12-cis, delta-11-trans-isomerase from Butyrivibrio fibrisolvens. J. Biol. Chem. 242:5686–5692.
Kim, Y. J., R. H. Liu, J. L. Rychlik, and J. B. Russell. 2002. The en-richment of a ruminal bacterium (Megasphaera elsdenii YJ-4) that produces the trans-10, cis-12 isomer of conjugated linoleic acid. J. Appl. Microbiol. 92:976–982.
Klieve, A. V., D. Hennessy, D. Ouwerkerk, R. J. Forster, R. I. Mackie, and G. T. Attwood. 2003. Establishing populations of Megasphaera
elsdenii YE 34 and Butyrivibrio fibrisolvens YE 44 in the rumen of cattle fed high grain diets. J. Appl. Microbiol. 95:621–630. Kritchevsky, D. 2000. Antimutagenic and some other effects of
conju-gated linoleic acid. Br. J. Nutr. 83:459–465.
Loor, J. J., K. Ueda, A. Ferlay, Y. Chilliard, and M. Doreau. 2004. Biohydrogenation, duodenal flow, and intestinal digestibility of
trans fatty acids and conjugated linoleic acids in response to di-etary forage:concentrate ratio and linseed oil in dairy cows. J. Dairy Sci. 87:2472–2485.
Maia, M. R., R. J. Bessa, and R. J. Wallace. 2009. Is the trans-10 shift that sometimes occurs in the ruminal biohydrogenation of linoleic acid caused by low pH or starch? A Rusitec study. Pages 276–277 in XIth Intl. Symp. Rumin. Physiol., Clermont-Ferrand, France. Y. Chilliard, F. Glasser, Y. Faulconnier, F. Bocquier, I. Veissier, and M. Doreau, ed. Wageningen Academic Publishers, Wagenin-gen, the Netherlands.
Maia, M. R. G., L. C. Chaudhary, C. S. Bestwick, A. J. Richardson, N. McKain, T. R. Larson, I. A. Graham, and R. J. Wallace. 2010. Toxicity of unsaturated fatty acids to the biohydrogenating rumi-nal bacterium, Butyrivibrio fibrisolvens. BMC Microbiol. 10:52. Maia, M. R., L. C. Chaudhary, L. Figueres, and R. J. Wallace. 2007.
Metabolism of polyunsaturated fatty acids and their toxicity to the microflora of the rumen. Antonie van Leeuwenhoek 91:303–314. Park, P. W., and R. E. Goins. 1994. In situ preparation of fatty acid
methyl esters for analysis of fatty acid composition in foods. J. Food Sci. 59:1262–1266.
Piperova, L. S., J. Sampugna, B. B. Teter, K. F. Kalscheur, M. P. Yurawecz, Y. Ku, K. M. Morehouse, and R. A. Erdman. 2002. Duodenal and milk trans octadecenoic acid and conjugated lin-oleic acid (CLA) isomers indicate that postabsorptive synthesis is the predominant source of cis-9-containing CLA in lactating dairy cows. J. Nutr. 132:1235–1241.
Playne, M. J. 1985. Determination of ethanol, volatile fatty acids, lactic acid and succinic acid in fermentation liquids by gas chro-matography. J. Sci. Food Agric. 36:638–644.
Roy, A., A. Ferlay, K. J. Shingfield, and Y. Chilliard. 2006. Examina-tion of the persistency of milk fatty acid composiExamina-tion responses to plant oils in cows fed different basal diets, with particular em-phasis on trans-C18:1 fatty acids and isomers of conjugated linoleic
acid. Anim. Sci. 82:479–492.
Schmidely, P., F. Glasser, M. Doreau, and D. Sauvant. 2008. Digestion of fatty acids in ruminants: A meta-analysis of flows and variation factors. 1. Total fatty acids. Animal 2:677–690.
Shingfield, K. J., C. K. Reynolds, G. Hervás, J. M. Griinari, A. S. Grandison, and D. E. Beever. 2006. Examination of the persis-tency of milk fatty acid responses to fish oil and sunflower oil in the diet of dairy cows. J. Dairy Sci. 89:714–732.
Steele, W., R. C. Noble, and J. H. Moore. 1971. The effects of two methods of incorporating soybean oil into the diet on milk yield and composition in the cow. J. Dairy Res. 38:43–48.
Therion, J. J., A. Kistner, and J. H. Kornelius. 1982. Effect of pH on growth rates of rumen amylolytic and lactilytic bacteria. Appl. Environ. Microbiol. 44:428–434.
Tricon, S., G. C. Burdge, S. Kew, T. Banerjee, J. J. Russell, E. L. Jones, R. F. Grimble, C. M. Williams, P. Yaqoob, and P. Calder.
2004. Opposing effects of cis-9,trans-11 and trans-10,cis-12 conju-gated linoleic acid on blood lipids in healthy humans. Am. J. Clin. Nutr. 80:614–620.
Troegeler-Meynadier, A., L. Bret-Bennis, and F. Enjalbert. 2006. Rates and efficiencies of reactions of ruminal biohydrogenation of linoleic acid according to pH and polyunsaturated fatty acids con-centrations. Reprod. Nutr. Dev. 46:713–724.
Troegeler-Meynadier, A., M. C. Nicot, and F. Enjalbert. 2007. Ef-fects of fat source and dietary sodium bicarbonate plus straw on the conjugated linoleic acid content of milk of dairy cows. Arch. Anim. Nutr. 61:406–415.
Wallace, R. J., N. McKain, K. J. Shingfield, and E. Devillard. 2007. Isomers of conjugated linoleic acids are synthesized via differ-ent mechanisms in ruminal digesta and bacteria. J. Lipid Res. 48:2247–2254.
Weimer, P. J., D. M. Stevenson, and D. R. Mertens. 2010. Shifts in bacterial community composition in the rumen of lactating dairy cows under milk fat-depressing conditions. J. Dairy Sci. 93:265– 278.
Whigham, L. D., M. E. Cook, and R. L. Atkinson. 2000. Conjugated linoleic acid: Implications for human health. Pharmacol. Res. 42:503–510.
Zened, A., A. Troegeler-Meynadier, M. C. Nicot, S. Combes, Y. Fa-rizon, and F. Enjalbert. 2011. Starch and oil in the donor cow diet and starch in substrate differently affect the in vitro rumi-nal biohydrogenation of linoleic and linolenic acids. J. Dairy Sci. 94:5634–5645.