IABSE Conference – Structural Engineering: Providing Solutions to Global Challenges September 23-25 2015, Geneva, Switzerland
1
Tools for Measuring a City’s Resilience in a Fire Following Earthquake
Scenario
Negar Elhami Khorasani, Thomas Gernay, Maria Garlock
Princeton University, Princeton, NJ, USA
Contact: mgarlock@princeton.edu
Abstract
The paper provides a framework to evaluate the response of buildings in a community subject to fire following earthquake. First, a model is developed to determine the probability of ignition in buildings of a community due to an earthquake. Second, fragility functions are developed for buildings subject to fire, to quantify the structural damage and the expected losses. The ignition model, combined with the fragility functions, can be implemented in a GIS based risk management platform to evaluate economical losses in a region from fire following an earthquake.
Keywords: Fire following earthquake; ignition, fragility; probabilistic; community; resiliency.
1
Introduction
Resilience of a community to extreme events is an issue of increasing concern in our interconnected and urbanized societies. Meanwhile, cascading multi-hazard events, such as fire following earthquake (FFE), can be the cause of major social and economical losses. This paper provides a post-earthquake ignition model and a sample fragility function; together they can be used to evaluate response of the buildings subject to FFE.
2
Ignition model
The ignition model is based on seven historical earthquake events, all of which occurred in California, U.S.A., between 1983 and 2014: 1983 Coalinga, 1984 Morgan Hill, 1986 North Palm Spring, 1987 Whittier Narrows, 1989 Loma Prieta, 1994 Northridge, and 2014 Napa. In order to compile the inventory data for the model, first information on the ignition incidents, including their location, for the seven historical earthquakes are collected. Then, geographic and demographic
information based on census tracts for the regions that experienced the earthquake events are assembled in a database. Finally, USGS ShapeMap archives are used to collect the peak ground acceleration (PGA) values for historical earthquakes. The groups of data are assembled into one database using ArcGIS.
Compilation of the inventory of historical data is similar to the work completed by Hazus [1]; however, the proposed model takes a different approach than the existing FFE ignition model in Hazus and is based on probabilistic approaches [2]. The proposed model outputs probability of ignition at a census tract and at individual buildings.
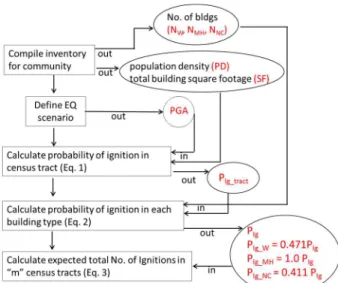
A user can apply the proposed ignition model to estimate the number of post-earthquake ignitions for a region, as shown in the flowchart in Fig. 1, and described as the following: (1) compile an inventory of census tracts for the region of study, including population density (PD), total building square footage (SF), number of wood buildings (NW), number of mobile homes (NMH), and number
IABSE Conference – Structural Engineering: Providing Solutions to Global Challenges September 23-25 2015, Geneva, Switzerland
2 of non-combustible buildings (NNC). (2) Select an earthquake scenario and calculate the PGA values for every census tract in the region of study. (3) Using Eq. 1, calculate the probability of ignition in a census tract. This calculation should be performed for “m” number of census tracts in the region of study. (4) Given the probability of ignition in each census tract (Step 3), and the number of each building types, calculate probability of ignition for each building type using Eq. 2. (5) The expected number of ignitions in each census tract equals to the sum of probabilities of ignitions for all buildings in that census tract. The number of ignitions in the region of study is the sum of ignitions in all census tracts, as shown in
Eq. 3. Figure 1. Flowchart of FFE ignition model
Table 1: Validation study for the ignition model and in comparison with Hazus
Earthquake Number of Ignitions Actual Hazus Proposed Model Total W MH NC 1983 Coalinga 3 1 0.5 0.5 0 0
1984 Morgan Hill 6 N/A 4 4 0 0
1986 N. Palm Spring 1 N/A 3 2 1 0
1987 Whittier Narrows 20 33-43 32 27 1 4
1989 Loma Prieta 36 14-38 27 22 2 3
1994 Northridge 82 72-101 90 75 3 12
2014 Napa 6 N/A 3 3 0 0
TOTAL 154 N/A 160 134 7 19
The proposed model is validated using the above procedure (Fig. 1) to estimate the number of ignitions based on the available FFE historical events. The number of ignitions from the
proposed model in Table 1 is calculated for all seven considered earthquakes, and is compared with the actual reported number of ignitions, and with a validation study by Hazus. Hazus provides a
_ 1 exp 6.755 8.463 PGA 98.4 10exp 6.755 8.463 PGA 98.4 10 ! 152.3 10! 152.3 10#$%#$% (1) _ 1 & 1 0.471 %|PGA()* & 1 1.0 %|PGA()+,
& 1 0.411 %|PGA()-. (2)
Number of Ignitions < =>? @0.471 A >BC @1.0 A >)D @0.411 AEF G
IABSE Conference – Structural Engineering: Providing Solutions to Global Challenges September 23-25 2015, Geneva, Switzerland
3 range for the number of ignitions as the program suggests running the analysis a number of times to capture uncertainties in the process. Also, the Hazus validation study goes back to a study that was completed in 2001 [3], while the fire ignition model in Hazus was updated in 2009. It is therefore possible that the Hazus predictions have been improved compared to the predictions provided in Table 1. Overall, the proposed probabilistic model in this work captures the number of fire events after an earthquake reasonably well, given the level of uncertainty that exists in the community response. In addition, the proposed model has the advantage of providing the breakdown in the number of ignitions for different considered building types. Finally, the developed model follows a probabilistic procedure that provides probability of ignition at individual building level in the region of study.
3
Fragility Functions
Given an ignition in a building, the probability of exceeding certain limit states in the building should be evaluated to quantify the expected losses. Adopting an approach similar to that used in seismic engineering [4], fragility functions can be developed for structures subject to fire. In developing the fragility functions, uncertainties in the fire model, heat transfer analysis, and thermo-mechanical response of structural elements are considered. Fire scenarios at different locations in the building are included. Demand and capacity of the system are assessed probabilistically in terms of critical temperatures. The thermal and structural responses are treated separately to improve the efficiency of the probabilistic analyses.
The procedure is performed for gravity frames in a prototype 9-story steel building. The fire load is chosen as the intensity measure for the fire fragility curves. Given the fire load, the fragility functions yield the probability of exceedance of predefined damage states. For the purpose of illustrating the procedure, two structural damage states are considered, one relative to the beams and one relative to the columns:
• DS1: relates to the maximum bending resistance of the beam, when the bending
capacity of the beam is exceeded and the mid-span vertical deflection increases dramatically;
• DS2: relates to the maximum resistance of the column, when the column fails with a sudden increase in transversal deflection, whether due to exceedance of the buckling resistance of the column or exceedance of the section plastic capacity under combined compression and bending.
The uncertainties in random variables, including mechanical properties of steel, thermal properties of insulating material, and the applied gravity loads, are modeled. Incorporating uncertainties of random variables, the probability of exceeding a damage state in a compartment for a range of fire load densities (the intensity measure) can be obtained. For a given fire load, the conditional probability of failure can be computed using Eq. 4, by convolution of the probability distribution function (PDF) of capacity and the complementary cumulative density function (CDF) of demand corresponding to the fire load.
J|CKL = M N1 − $O|CKL P%Q RD P%SP T
U (4)
In Eq. 4, J|CKL is the probability of failure conditional to the occurrence of a fire Hfi; the demand D and capacity C are random variables characterized by their PDF fD(·) and fC(·); and $O|CKL is the CDF of the demand relative to the fire
event Hfi, and α is the variable over which one integrates (temperature in this case). In this procedure, demand is the maximum temperature in the steel section and capacity is the critical temperature in the steel section when reaching a damage state [5].
The fragility curves associated with the beam and the column damage states are constructed for each different compartment fire locations in the building. Number of possible fire scenarios results in number of fragility curves associated with each damage state. A methodology has been proposed by Shinozuka et al. [6] for constructing combined fragility curves from individual fragility curves developed for structures with similar structural attributes. The methodology is used to combine individual fragility curves at different compartment locations and derive a fragility curve
IABSE Conference – Structural Engineering: Providing Solutions to Global Challenges September 23-25 2015, Geneva, Switzerland
4 (one per damage state) that does not depend on the location of the fire, but captures the overall vulnerability of the building.
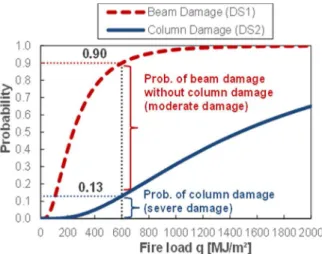
Figure 2. Flowchart of FFE ignition model
The developed fire fragility functions for the prototype 9-story steel gravity frame, shown in Fig. 2, yield the probability of exceeding the predefined damage states as a function of the fire load in the building. For example, Fig. 2 shows that for a fire load of 600 MJ/m2 the probability of exceeding the beam damage state (DS1) is 0.9 and the probability of exceeding the column damage state (DS2) is 0.13. The beam damage state is reached before the column damage state. Therefore, the probability of reaching severe damage is 0.13, while the probability of only moderate damage is 0.77 (0.90-0.13).
4
Conclusions
The proposed ignition model can be used to identify vulnerable parts of the community that would experience more ignitions after an earthquake. One advantage of the proposed model over existing ones is that the model provides a breakdown of ignition in different building construction types. Having identified buildings under fire, a sample fragility function for a prototype 9-story steel building is provided to show application of the concept, and to quantify the damage state in the building after fire.
5
References
[1] FEMA. Hazus: MH 2.1 Technical Manual - Earthquake Model. Developed by the Department of Homeland Security. Federal Emergency Mgt Agency. Mitigation Division. Washington, DC; 2014.
[2] Elhami Khorasani, N., Gernay, T., Garlock, M.E.M. Modeling post-earthquake fire ignitions in a community. Submitted to Fire Safety Journal. 2015.
[3] Scawthorn, C.R., Eidinger, J.M., Schiff, A.J. Fire Following Earthquake. Technical Council on Lifeline Earthquake Engineering. Monograph No. 26. Published by the American Society of Civil Engineers. Reston, 2005.
[4] Rota, M., Penna, A., Magenes, G. A methodology for deriving analytical fragility curves for masonry buildings based on stochastic nonlinear analyses. Engineering Structures. 2010; 32(5): 1312–1323.
[5] Gernay, T., Elhami Khorasani, N., Garlock, M.E.M. Fire fragility curves for steel buildings in a community context: a methodology. Submitted to Engineering Structures. 2015.
[6] Shinozuka, M., Feng, M.Q., Lee, J., Naganuma, T. Statistical Analysis of Fragility Curves. Journal of Engineering Mechanics ASCE. 2000; 126(12): 1224–1231.