HAL Id: hal-01189905
https://hal.archives-ouvertes.fr/hal-01189905
Submitted on 1 Sep 2015
HAL is a multi-disciplinary open access archive for the deposit and dissemination of sci-entific research documents, whether they are pub-lished or not. The documents may come from teaching and research institutions in France or abroad, or from public or private research centers.
L’archive ouverte pluridisciplinaire HAL, est destinée au dépôt et à la diffusion de documents scientifiques de niveau recherche, publiés ou non, émanant des établissements d’enseignement et de recherche français ou étrangers, des laboratoires publics ou privés.
Modelling the functional role of microorganisms in the
daily exchanges of carbon between atmosphere, plants
and soil
Hatem Ibrahim, Abdessatar Hatira, Marc Pansu
To cite this version:
Hatem Ibrahim, Abdessatar Hatira, Marc Pansu. Modelling the functional role of
microorgan-isms in the daily exchanges of carbon between atmosphere, plants and soil. International
con-ference on monitoring and modeling of processes in the SPA, Jun 2013, Naples, Italy. 966 p.,
Procedia Environmental Sciences 19 ( 2013 ) 96 – 105
1878-0296 © 2013 The Authors. Published by Elsevier B.V
Selection and/or peer-review under responsibility of the Scientific Committee of the Conference doi: 10.1016/j.proenv.2013.06.011
Available online at www.sciencedirect.com
Four Decades of Progress in Monitoring and Modeling of Processes in the
Soil-Plant-Atmosphere System: Applications and Challenges
Modelling the functional role of microorganisms in the daily
exchanges of carbon between atmosphere, plants and soil
Hatem Ibrahim
a,b,*, Abdessatar Hatira
b, Marc Pansu
aaUMR Eco&Sols, SupAgro INRA, IRD, CIRAD, 2 place Viala, 34060 Montpellier Cedex 2, France.
bU.R. 04/UR/10-02 Pedology, Department of Geology, Faculty of Sciences of Tunis, El Manar University, 2092 Tunis, Tunisia.
Abstract
There has been considerable research on organic carbon (OC) stocks in the upper layer of the soil but it has focused on semi-mechanistic predictions of OC stocks in the long term rather than on microbial processes acting on OC transformations. Published data lack of reference concerning the modelling of the short-term exchanges between atmosphere, plants, rhizobia and other microorganisms of soil. We think it is because the mechanistic role of microorganisms is poorly considered in most of the existing models. Compartmental theory is the most used to model the complex system of OC forms, with linear or no-linear propositions. Sometimes, the models did not consider explicitly an active microbial compartment and were often over parameterized. In contrast, the MOMOS proposition defined linearly the functional role of microorganisms with only a no-linear term linked to microbial respiration. It uses only 7 kinetic parameters having a clear ecological definition and being related to climate (all parameters), soil texture or pH (microbial respiration), and biological properties of debris inputs (enzymatic breakdown of plant debris and microbial mortality). The 3 other parameters (rates of humus stabilisation and enzyme assimilation of labile and stable humus) were found linked only to climate, suggesting that quality of humified materials should be more constant than OC forms from living materials. In coupling with soil water and production modules, the model emerges as a new theoretical basis to describe the life cycle and its applications to agro-ecology and global change. © 2013 The Authors. Published by Elsevier B.V.
Selection and/or peer-review under responsibility ofthe Scientific Committee of the conference.
Keywords: Modelling ; Carbon ; soil ; plant; organic matter
* Corresponding author. Tel.: +33685853094; fax: +33499612119.
E-mail address: brahim_hatem@yahoo.fr.
© 2013 The Authors. Published by Elsevier B.V
B
x
A
x
f
(
T
)
f
(
)
1. Introduction
More of 200 models have been proposed in the last decades to describe part or whole C cycle in soils [1]. But the proposed models were often over-parameterized, included parameters not always linked to environmental conditions, and generally did not consider the real functional role of microorganisms. This presentation aims to present the genesis of the MOMOS model which is centred on microbial functioning and appears very sensitive to meteorological, edaphic and biological conditions. In contrast with other published propositions which need long term comparisons to quantify significant C transfer between soils and atmosphere, our experimental work aimed to answer to 2 questions: (i) could MOMOS predict the daily evolution at short term of leaving and dead forms of organic carbon in complex systems, (ii) could we couple the equations of OC decomposition with different equations of OC production and propose a new theory for agro-ecology and global change.
2. Material and methods 2.1. The MOMOS equation system
It is based on the functional ecology of soil microbial biomass (MB) which increases by enzymatic assimilation of labile and stable vegetal necromass (VL and VS) and labile and stable humus (HL and HS) and decreases by microbial respiration and mortality. The only process which is assumed to be more chemical than biological is humus stabilisation from HL to HS. MOMOS is parameterised only by seven first order rate constants (dimension day-1). Unlike other multi-compartment models, MOMOS does not
use flow-partitioning coefficients (efficiency factors), that are usually specified as not depending on climate variables in other models. All MOMOS parameters depend on soil moisture content ( ) and temperature (T) and the model is probably one of the more sensitive to climate change as shown in the general equation:
(1) where
x is the vector of the state variables (C content of compartments),
x
is the vector of the derivatives of x (day-1), A is the matrix of the model parameters, B is a vector determining the external Cinput. f(T) is an exponential function of temperature: f(T) = 10 10
/ T T opt
Q
(2) where T is the soil temperature (0-30 cm layer) assumed to be the same as the air temperature, Topt isthe optimum decomposition temperature fixed at 28°C, a temperature often taken as the optimum for decomposition [2,3], Q10 is the difference in rate for a temperature increase of 10°C, fixed at 2.2, the
value found when the model was validated [2]. f( ) is the function of the soil water content normalised to the water holding capacity (WHC) of the soil [2]:
f( ) =
MIN
WHC
,
1
(3) The soil water content ( ) was predicted using the SAHEL model [4], based on meteorological data near the experimental plots. The minimal data can include only air temperature, rainfall, but the precision98 Hatem Ibrahim et al. / Procedia Environmental Sciences 19 ( 2013 ) 96 – 105 0 MB CO2
C
x
k
q
MB respis better if they include also solar radiation, wind speed and water vapour pressure, for accurate determination of potential evapotranspiration by the FAO Penman-Monteith method.
Matrix A and vector x for the model are:
A = HLS HS HS HL MB HS HL MB V VL VS VL
-0
0
0
0
0
0
0
0
0
0
0
0
0
0
2k
k
k
k
k
k
k
k
q
k
k
k
k
CO S and HS HL MB VS VLx
x
x
x
x
x
(4)After each incubation period, the total C decrease by microbial respiration C for the five
compartments is: MB C, CO 5 1 2
(
)
(
T
f
)
q
x
f
x
i i,CC
(5)where
q
CO2 is the metabolic quotient of the microbial biomass:(6)
where CMB0 is an estimate of the biomass at steady state, kresp is the respiration coefficient (day-1)
adjusted to the 0-20 μm soil textural fraction (F0-20) by the transfer function using the two sites used for
calibrating the model plus the six sites used for validating the model [2]:
kresp= - 0.0008 F0-20 + 0.062 (7)
Alternately another transfer function linking kresp to soil pH can be used [2]. The optimal rates of
enzymatic digestion of labile (kVL) and stable (kVS) plant materials (equations 17 and 17’), and the optimal
rate of microbial mortality (kMB) are linked to the type of organic inputs (equation 14) [5]. The values in
optimum pedoclimatic conditions (f(T) = f( ) =1) for the other MOMOS parameters remained unchanged from the previous MOMOS calibration and validation experiments:
- optimum rate of enzymatic digestion of labile humus kHL = 0.05 d-1,
- optimum rate of enzymatic digestion of stable humus kHS = 0.00005 d-1,
- optimum rate of chemical stabilisation from labile humus to stable humus kHLS = 0.0003 d-1.
Aboveground and belowground biomass Necromass (NC) CO2 VS MB HL HS Inorganic Nitrogen
Plant exudation Plant mortality
Microbial respiration Meteorological data kHL kHS kHLS kVL kMB kVS k q resp CO2 Production module Soil water module Soil water Temperature Soil properties Microbial mortality Humus stabilisation NC Quality VL Solar radiation TAO model N Microbial immobilisation N mineralization
Fig. 1 – The MOMOS model, coupled with soil water and production modules: MB is microbial biomass, VL and VS are the labile and stable debris of vegetal origin entering the soil, HL and HS are the labile and stable humus fractions, kVL, kVS, kHL, and kHS are
the daily rates of enzymatic breakdown of VL, VS, HL, and HS, respectively, kMB is the daily rate of microbial mortality, kresp is
the daily rate of microbial respiration, qCO2 is the MB respiratory quotient and kHLS is the daily rate of humus stabilisation
2.2. Formulation for isotopic tracers
Previous studies using isotopic tracers defined the matrix A in equation 1 as the initial values of the vector
x were known (from the rate of
14C accumulation and the types of labelled materials that wereadded) and all values of vector B = 0 (no inputs of labelled C from plants). Equations 1 and 4 became:
x
A
x
f
(
T
)
f
(
)
(8)0
0
0
0 VS 0 VLx
x
x
(9)100 Hatem Ibrahim et al. / Procedia Environmental Sciences 19 ( 2013 ) 96 – 105 2.3. Formulation for C evolutions in agro-ecosystems
The previously defined matrix A and its relationships with climate, soil texture (Equation 7) and quality of organic inputs were preserved. So, it was only necessary to estimate the initial values for the vector x and the daily inputs from necromass C (NC) for the vector B in the 5 compartments comprising the debris of plant shoots, plant roots and if necessary root exudation or symbiotic nodules. Equation 1 became:
(10)
Where the subscript j indicated each plant organ in each study:
- shoots, root debris and root exudates of five plants chosen as typical of fallow implantation in high altitude systems of Bolivian puna and Venezuelan paramo [6] used in calibration experiment [7,8], - roots, shoots and symbiotic nodules in the Mauguio intercropped system [9]:
The elements of Bj were estimated in two stages:
quantitative estimate of necromass input from each plant part by a production module adapted at each ecosystem; for Andean ecosystems the fallow production model FAPROM [6] was used; for wheat-fababean intercropping, another production module was defined [9];
qualitative estimate of necromass to divide each input into labile and stable fractions in the MOMOS decomposition processes.
2.4. Modelling the quality of necromass entering the soil
The TAO (Transformation of Added Organic materials) model was designed to describe the transformation of carbon and nitrogen from organic amendments and fertilisers in soils from temperate areas in controlled laboratory conditions [3,10-12]. The model has since been validated on tropical materials [13], and the TAO-C version describing carbon transformations, was designed to estimate the fractions of labile and stable necromass that are then used for the ‘microbial biomass’ compartments of MOMOS. TAO-C is a parallel three-compartment model using only two parameters (very labile (P’L) and
stable (PS) fractions of OM) to predict C mineralisation. Basing P’L and PS on biochemical data first
required the OM to be classified using a criterion based on principal component analysis of the OM data set used to calibrate the model [10]:
Co = 7.18 COM + 0.14 Lig/NOM – 3.84 (11)
where C, N, Lig express carbon, nitrogen, and lignin content in g g-1 of OM, respectively.
OM with negative Co values was mainly N-rich materials such as organic fertilisers or materials of
animal origin. OM with positive Co values was mainly ligneous material originating from plants. The
following formulae were then used to calculate P’L and PS depending on the sign of Co.
If Co 0: P’L = 0.35 fsol + 2.2 NOM – 0.01 Lig/NOM, and PS = 3.60 Lig
j
+
f(T)f(
=
5 1 = jB
x
A
x
)
If Co > 0: P’L = 0.099 flab + 0.14 Hem, and PS = 1.61 Lig + 0.62 AshOM (12)
where fsol = Sol/(Sol + Hem + Cel + Lig), flab = (Sol + Hem)/(Sol + Hem + Cel + Lig), NOM was
total nitrogen in OM and Sol, Hem, Cel, Lig and AshOM were OM mass fractions obtained by fibre
fractionation. This study in field conditions simplified the TAO organisation of plant debris compartments. Only two compartments, labile VL and stable VS vegetal necromass (Fig. 1), are considered in MOMOS, VL being the sum of very labile and intermediary resistant TAO compartments, VS being the stable TAO compartment.
Another factor which determines decomposition in MOMOS is NC, the C:N ratio of input necromass
NC from each plant organ. An increase of NC was modelled as decreasing the assimilation rates of labile
(kVL) and stable (kVS)NC compartments [5]:
kVL= MAX(0.65 - 0.0019 NC, 0.1) (13)
kVS = MAX(0.0037-0.000026 NC,0.00005) (13’)
An increase of NC was also found to increase the rate of microbial mortality [8]:
kMB = MIN(0.42 + 0.0012 NC, 0.8) (14)
Equations 13 and 13’ were applied separately to each of the five NC inputs, while NC in equation 14
was calculated each day by the model from the sums of C and N of the inputs materials entering MB. 2.5. Data collection for calibration and validation
14C and 15N labeled straw was mixed with soils, from the top 0–10 cm layer at each of the sites, in
14×15 cm porous bags. The top part of the bags had a 1 mm mesh to allow the passage of plant roots and mesofauna and the mesh of the bottom part was 0.1 mm to minimize losses by gravity. 40 bags containing the labeled straw and soil were buried 5 cm deep along four parallel lines in each experimental plot (10 samples at different times × 4 replicates for each sample at each site, making a total of 240 soil bags). On each sampling date, one bag from each line of the four lines at each site was selected at random to measure soil water content, total 14C and 15N and 14C and 15N in the microbial biomass and inorganic N
stock. The soil bags were left in the soil for 18 months at the two lowest sites (A(65) and A(165)) 24 months at A(780), 31 months at A(1800) and 38 months at the two highest sites (A(3400) and A(3968)). The first samples were taken one month after setting up the experiment and the sampling interval increased with time to 6 months at the end of the experiment for the highest sites. After collection, the soil bags were stored refrigerated for no more than three days before analysis.
2.6. Data collection for C evolution in agro-systems
Four whole plants of each species were collected from each plot (4 replicates) at each sampling occasion during plant growth. At the same time, two replicates of soil samples from the 0-5 cm and 25-30 cm layers were collected in 500 mL stainless steel cylinders from each plot. These samples were used to determine the soil moisture and bulk density.
The near-root soil was collected from the field and preserved in iceboxes for microbial biomass (MB) determination (4 plots×4 modalities 4 replicates). These samples were then homogenised and crushed without drying and passed through a 4×4 mm grid sieve in the laboratory [14]. The coarse and fine
102 Hatem Ibrahim et al. / Procedia Environmental Sciences 19 ( 2013 ) 96 – 105
fractions were weighed and the fine fraction was kept without drying at 4°C. MB determination was carried out within two days after sampling.
The soil MB carbon was determined by fumigation-extraction [15]. A fresh soil sub-sample equivalent to 10 g dry soil was fumigated with alcohol free chloroform for 18 h. The fumigated sample and a similar control soil sample were shaken with 30 mL of a 0.5 mol K2SO4 L-1 aqueous solution for 45
minutes, centrifuged for 10 min and sterilised by filtration on a 0.2 μm membrane syringe. The liquid filtrates were stored in sterile plastic tubes at 4°C before C analysis in aqueous phase (Shimadzu TOC-VCSH analyser). The soil microbial C concentration (MB-cC) was calculated as the difference between the
total organic C of the extracts of fumigated soils with destroyed organisms and extracts from the control soils, divided by a factor kc = 0.45 [16].
The roots and shoots were separated, the roots were washed in water, the root nodules were separated manually and the grains were separated from the shoots. All parts were dried at 60°C for 2 days and weighed again when dry. For subsequent C analysis, samples of each part were grouped and ground to 0.2 mm in a steel planetary ball mill.
A dry combustion elemental analyser (NA2000, Fisons Instruments) was used for C analysis of the soil and plant parts. The soil CO3-C was subtracted if necessary from the soil total C to give the soil OC.
All C concentrations (total-cC in mg g-1, MB-cC in μg mL-1) were converted to carbon stock (g C m-2) on
the 0-30 cm layer, using bulk density, coarse fraction and moisture for soil data, and plant density for plant data.
The CO2-C fluxes from the soil surface were measured in the field for six replicates per plot using a
LI-COR 8100 system and 8.7 cm high PVC cylinders with 10 cm internal diameter, which were buried leaving 2-3 cm above the soil surface. The exact heights between the soil surface and the tops of the cylinders were measured for the flux calculation. The flux in μmol CO2-C m-2 s-1 wasmultiplied by
1.0368 to obtain the daily flux in g CO2-C m-2 day-1 and corrected if necessary in case of very hot surface
temperature in summer [9]. 3. Some results
3.1. MOMOS validation
MOMOS allowed to adequately predict total and microbial 14C dynamics during the decomposition of
a standard plant material in six extremely contrasting tropical environments using only one parameter specific to each site (kresp) instead of the two or three site specific parameters necessary in previous
analysis using the same database to predict only total 14C by two exponential models [17,18].
Furthermore, kresp was the only parameter found bond to soil properties, demonstrating that the function of
microbial respiration alone was soil dependent. Overall, this study demonstrated that climate, together with basic soil properties as texture and pH, were the main drivers of soil respiration and organic matter dynamics when a large range of conditions are considered. Other specific soil characteristics, as the composition of soil microbial communities seemed to be of secondary importance.
3.2. Short term microbial exchanges in fallow systems
Both parameter values calibrated on 14C and total C input from roots estimated with the fallow
production model FAPROM [6] has been used to predict carbon evolution [8] in the Bolivian puna (Fig. 2). The model enabled to explain the observed values of total-C as the sum of the predicted values of (i) evolution of initial total-C, (ii) evolution predicted by FAPROM of total carbon deposited by roots during the experiment and by MOMOS for remaining amount of the deposited C.
It validated another time the MOMOS structure: parameters obtained with 14C tracer enabled to
predict total-C using additional carbon input from root. This result described the turnover of C brought from photosynthesis in fallow systems and enabled to propose a new modelling tool to predict in situ the
C input from root. The other methods study the transfer of labelled CO2-C from leaves to roots in
controlled conditions; conversely the proposed tool uses the model previously calibrated by 14C tracer
experiment to quantify the inputs of 12C from leaves to roots in field conditions.
Fig. 2. Modelling of the turnover of carbon in a fallow plot of the Bolivian puna [6]
3.3. Short term microbial exchange in complex agro-systems
Another C production module was written [9] in place of Faprom [6] to describe the growth of plant organs in cereal legume intercropping and another time associated to the MOMOS schemes (Fig. 1); This module assumed that plant growth was also controlled by the climate correction factor used for microbial functioning (equation 1), and by aerial C of cereals and legumes. The production was allocated to plant organs and nodules for symbiotic N fixation by partition coefficients and time functions. Other parameters and time functions regulated shoot and root mortalities and root respirations. The MOMOS model, associated to the equation system calculated from 14C experiments, and then coupled with this
particular physiological module of plant growth in a cereal-legume system emerges as a new tool to quantify physiological parameters as growth rates, shoot and root mortalities and root respirations, which are of prime importance in agronomy and environmental studies, and difficult to estimate by other methods.
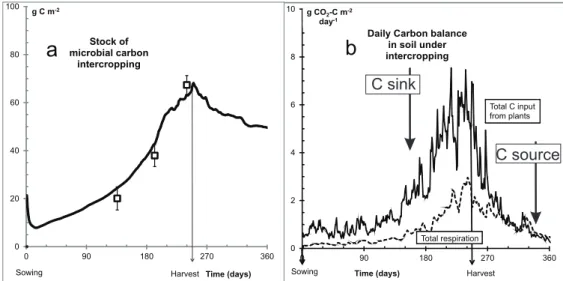
Fig. 3a reproduces the measured and daily predicted values of microbial OC during one year of cereal-legume intercropping. It illustrates the growth of microorganisms associated to plant growth and OC brought to soil from the part lost from photosynthesis.
Fig. 3b shows that the sum of predicted C from the mortality of plant roots and shoots, which provide the C substrates for microbial growth, was greater than the daily total CO2-C respired by microorganisms
104 Hatem Ibrahim et al. / Procedia Environmental Sciences 19 ( 2013 ) 96 – 105
of leaf and stem material was modelled as falling to become litter, in addition to decomposition of the remaining shoots and roots by natural mortality. This showed that the intercropping was a sink of OC during all the cultivation period and became a source of OC about two months after the harvest, but during a period where all processes were slowed by the winter conditions. The increase of measured and predicted total OC during the intercropping season was not significant, as in other modelling studies which need long term situations to detect effect of land use change on net OC sequestration or mineralisation. But total OC is not the only variable of interest; MOMOS modelled most of carbon compartments as almost stable except labile humus of microbial origin which was found increasing during the plant growth. From this study, microbial metabolites represent the short term reserve for microbial activity and available fertilizing elements, possibly a key for ecological intensification
0 2 4 6 8 10 0 90 180 270 360 g CO2-C m-2 day-1 Time (days)
Daily Carbon balance in soil under intercropping Sowing Harvest Total respiration Total C input from plants
b
C sink C source 0 20 40 60 80 100 0 90 180 270 360 g C m-2 Time (days) Stock of microbial carbon intercropping Sowing Harvesta
Fig. 3. a) measured and modelled daily evolution of the microbial C stocks during the growth of durum wheat and faba bean in intercropped plots; b) modelled evolution of total C inputs and outputs in soil during intercropping. [9].
3.4. Modelling the key role of microorganisms
MOMOS was the first proposition to put the microbial compartment at the centre of the exchanges and associated it to linear equations of microbial assimilations and microbial mortality, and only a no linear one for microbial respiration. The equation system respects the principle of parsimony (Ockham’s razor) since it uses only seven kinetic parameters all linked to climate (equation 1), and additionally linked to the quality of organic inputs (equations 12-14), and soil texture (equation 7). Proposed initially to predict the evolution of 14C tracer in two ecosystems [7], it was then validated in six other contrasted
ecosystems of the tropical area [2]. It has been successfully used to quantify the turnover of OC in Andean fallow ecosystems [19] and to regulate the daily exchanges of C between plant organs, nodule rhizobia, microorganisms and atmosphere in cereal legume intercropping in Mediterranean conditions [9]. In coupling with soil water and production modules, the MOMOS equation system emerges as a new theory for agro-ecology and global change.
Acknowledgements
This work was part of international programs Tropandes (EU), Ecos-Nord (France-Venezuela), and Fabatropimed (Agropolis Fondation of Montpellier, France). The authors thank Lina Sarmiento, ULA, Venezuela, and Jean-Jacques Drevon (UMR Eco&sols, Supagro, Cirad, Inra, IRD, http://www.montpellier.inra.fr/ecosols), coordinators of the programs.
References
[1] Manzoni S, Porporato A. Soil carbon and nitrogen mineralization: Theory and models across scales. Soil Biology &
Biochemistry 2009:41:1355-1379.
[2] Pansu M. et al. Modeling Organic transformations by Micro-Organisms of Soils in six contrasting ecosystems: validation of the MOMOS model. Global Biogeochemical Cycles 2010;24:doi:10.1029/2009GB003527
[3] Thuriès L, Pansu M, Feller C, Herrmann P, Rémy JC. Kinetics of added organic matter decomposition in a Mediterranean sandy soil. Soil Biology & Biochemistry 2001;33:997-1010.
[4] Penning de Vries FWT, Jansen DM, ten Berge HFM, Bakema A. Simulation of ecophysiological processes of growth in several
annual crops. Pudoc; 1989.
[5] Bottner P et al. Factors controlling decomposition of soil organic matter in fallow systems of the high tropical Andes: a field simulation approach using 14C and 15N labelled plant material. Soil Biology & Biochemistry 2006;38:2162-2177.
[6] Martineau Y, Saugier B. A process-based model of old field succession linking ecosystem and community ecology. Ecological
Modelling 2007;204:399-419.
[7] Pansu M, Bottner P, Sarmiento L, Metselaar K. Comparison of five soil organic matter decomposition models using data from a 14C and 15N labeling field experiment. Global Biogeochemical Cycles 2004;18:doi:4010.1029/2004GB002230
[8] Pansu M, Martineau Y, Saugier B. A modelling method to quantify in situ the input of carbon from roots and the resulting C turnover in soil. Plant and Soil 2009;317:103-120
[9] Ibrahim H et al. The daily exchange of carbon between living organisms, the soil and the atmosphere, Submitted, 2013. [10] Thuriès L, Pansu M, Larré-Larrouy M.C, Feller C. Biochemical composition and mineralization kinetics of organic inputs in a
sandy soil. Soil Biology & Biochemistry 2002;34:239-250.
[11] Pansu M, Thuriès L. Kinetics of C and N mineralization, N immobilization and N volatilization of organic inputs in soil. Soil
Biology & Biochemistry 2003;35:37-48.
[12] Pansu M, Thuriès L, Larré-Larrouy M.C, Bottner P. Predicting N transformations from organic inputs in soil in relation to incubation time and biochemical composition. Soil Biology & Biochemistry 2003;35:353-363.
[13] Kaboré WT, Pansu M, Hien E, Houot S, Zombré N.P, Masse D. Usefulness of TAO model to predict and manage the transformation in soil of carbon and nitrogen forms from West-Africa urban solid wastes. Waste management 2011;31:154-167.
[14] Pansu M, Gautheyrou J. Handbook of soil analysis - Mineralogical, organic and inorganic methods. Springer, 2006.
[15] Brookes PC, Kragt JF, Powlson DS, Jenkinson DS. Chloroform fumigation and the release of soil nitrogen : the effects of fumigation time and temperature. Soil Biology & Biochemistry 1985;17:831-835.
[16] Joergensen RG. The fumigation-extraction method to estimate soil microbial biomass: Calibration of the k(EC) value. Soil
Biology & Biochemistry 1996;28:25-31.
[17] Coûteaux MM, Sarmiento L, Bottner P, Acevedo D, Thiéry JM. Decomposition of standard plant material along an altitudinal transect (65-3968 m) in the tropical Andes. Soil Biol. Biochem. 2002;34:69-78.
[18] Braakhekke WG, De Bruijn AMG. Modelling decomposition of standard plant material along and altitudinal gradient: a re-analysis of data of Coûteaux et al (2002). Soil Biol. Biochem., 2007;39:99-105.
[19] Pansu M, Bottner P, Sarmiento L. Micro-Organismes et Matière Organique du Sol (modèle MOMOS) : bilan de 20 ans de modélisation basée sur le traçage isotopique in situ. Etude et Gestion des Sols 2009;16:213-232.

![Fig. 2. Modelling of the turnover of carbon in a fallow plot of the Bolivian puna [6]](https://thumb-eu.123doks.com/thumbv2/123doknet/13544309.418860/9.816.277.558.211.563/fig-modelling-turnover-carbon-fallow-plot-bolivian-puna.webp)