This is an Accepted Manuscript, which has been through the Royal Society of Chemistry peer review process and has been accepted for publication.
Accepted Manuscripts are published online shortly after
acceptance, before technical editing, formatting and proof reading. Using this free service, authors can make their results available to the community, in citable form, before we publish the edited article. We will replace this Accepted Manuscript with the edited and formatted Advance Article as soon as it is available.
You can find more information about Accepted Manuscripts in the author guidelines.
Please note that technical editing may introduce minor changes to the text and/or graphics, which may alter content. The journal’s standard Terms & Conditions and the ethical guidelines, outlined in our author and reviewer resource centre, still apply. In no event shall the Royal Society of Chemistry be held responsible for any errors or omissions in this Accepted Manuscript or any consequences arising from the use of any information it contains.
Accepted Manuscript
Analyst
www.rsc.org/analystISSN 0003-2654 PAPER Michele Zagnoni et al.
Emulsion technologies for multicellular tumour spheroid radiation assays
Volume 141 Number 1 7 January 2016 Pages 1–354
Analyst
This article can be cited before page numbers have been issued, to do this please use: C. Torrentó, R. Bakkour, G. Glauser, A. Melsbach, V. Ponsin, T. Hofstetter, M. Elsner and D. Hunkeler, Analyst, 2019, DOI: 10.1039/C9AN00160C.
Solid-phase extraction method for stable isotope analysis of pesticides from large
volume environmental water samples
Clara Torrentóa*†, Rani Bakkourb, Gaétan Glauserc, Aileen Melsbachd, Violaine Ponsina, Thomas B. Hofstetterb,
Martin Elsnerd,e, Daniel Hunkelera
aCentre for Hydrogeology and Geothermics (CHYN), University of Neuchâtel, 2000 Neuchâtel, Switzerland
bEawag, Swiss Federal Institute of Aquatic Science and Technology, 8600 Dübendorf, Switzerland Helmholtz
cNeuchâtel Platform of Analytical Chemistry (NPAC), University of Neuchâtel, 2000 Neuchâtel, Switzerland
dHelmholtz Zentrum München, Institute of Groundwater Ecology, 85764 Neuherberg, Germany
eTechnical University of Munich, Chair of Analytical Chemistry and Water Chemistry, 81377 Munich, Germany
Abstract
Compound-specific isotope analysis (CSIA) is a valuable tool for assessing the fate of organic pollutants in the environment. However, the requirement of sufficient analyte mass for precise isotope ratio mass spectrometry combined with prevailing low environmental concentrations currently limits comprehensive applications to many micropollutants. Here, we evaluate the upscaling of solid-phase extraction (SPE) approaches for routine CSIA of herbicides. To cover a wide range of polarity, a SPE method with two sorbents (a hydrophobic hypercrosslinked sorbent and a hydrophilic sorbent) was developed. Extraction conditions, including the nature and volume of the elution solvent, the amount of sorbent and the solution pH, were optimized. Extractions of up to 10 L of agricultural drainage water (corresponding to up to 200,000-fold pre-concentration) were successfully performed for precise and sensitive carbon and nitrogen CSIA of the target herbicides atrazine, acetochlor, metolachlor and chloridazon, and metabolites desethylatrazine, desphenylchloridazon and
2,6-dichlorobenzamide in the sub-μg L-1-range. 13C/12C and 15N/14N ratios were measured by gas
chromatography-isotope ratio mass spectrometry (GC/IRMS), except for desphenylchloridazon, for which liquid chromatography (LC/IRMS) and derivatization-GC/IRMS were used, respectively. The method validated in this study is an important step towards analyzing isotope ratios of pesticide mixtures in aquatic systems and holds great potential for multi-element CSIA applications to trace pesticide degradation in complex environments.
Keywords: Compound-specific isotope analysis, triazine herbicides, chloroacetanilide herbicides, chloridazon,
desphenylchloridazon, 2,6-dichlorobenzamide.
Introduction
Due to abundant agricultural use, pesticides are frequently found in soil and groundwater.1-5 Pesticide leaching
is a problem for groundwater quality and a threat to human health if contaminated groundwater is used as drinking water. To mitigate existing pollution, it is critical to identify sources and to assess the fate of the
3 4 5 6 7 8 9 10 11 12 13 14 15 16 17 18 19 20 21 22 23 24 25 26 27 28 29 30 31 32 33 34 35 36 37 38 39 40 41 42 43 44 45 46 47 48 49 50 51 52 53 54 55 56 57 58 59 60
Analyst
Accepted
Manuscript
Published on 13 March 2019. Downloaded by Universitat de Barcelona on 3/13/2019 8:06:38 AM.
View Article Online DOI: 10.1039/C9AN00160C
numerous pesticides present in the environment. Existing methods for elucidating pesticide degradation include, for example, monitoring of parent compound disappearance, detection of transformation products, and
evidence of intrinsic transformation potential by molecular biology tools.6 Nevertheless, measuring the
concentration of the parent compounds does not allow distinguishing transformation from other processes such as dilution or sorption, especially in the vadose zone, where concentrations tend to fluctuate strongly under transient and varying hydrological conditions. Furthermore, for the metabolites of many pesticides, transformation reactions are not well known. Degradation processes may therefore not become evident from analysis of the concentration dynamics.
Compound-specific isotope analysis (CSIA) is a powerful tool to track and quantify pollutant degradation in
environmental systems.7-10 Molecules with light isotopes in the reactive position are degraded at different rates
than molecules containing heavy isotopes. Consequently, temporal and spatial shifts in isotope ratios are indicative of degradation and enable tracking degradation processes. In addition, monitoring the changes of isotope signatures of two (or more) elements is recommended to obtain a more reliable assessment of
degradation and to derive the extent and relative contribution of different reaction mechanisms.9,11,12
Although CSIA is in widespread use to study the fate of many contaminants11,13-15, applications are still emerging
for pesticides.16 Various analytical methods have been recently developed.17-29 Nonetheless, application of CSIA
of pesticides to field studies remain scarce24,30-34 because of two major challenges. First, isotope effect-free
extraction and pre-concentration methods are required to allow CSIA at low environmentally relevant concentrations by gas chromatography-isotope ratio mass spectrometry (GC/IRMS) or – in the case of compounds like desphenylchloridazon for which GC/IRMS-based carbon isotope analysis does not work – by liquid chromatography-IRMS (LC/IRMS).35 To accomplish accurate (i.e. true and precise)36 CSIA in specific
compounds, the required analyte amount is much higher than for concentration analysis (up to 5 nmol of C and 10 nmol of N on-column may be necessary).37 In environmental water samples, most pesticides and their
metabolites are present in trace concentrations (ng L-1 to µg L-1 range), which are relevant for regulatory
purposes; the EU Directive 98/83/EC establishes maximum permissible concentrations of 0.1 µgL-1 for individual
pesticides and relevant degradation products and 0.5 µgL-1 for total pesticides. A more than 100,000-fold
pre-concentration (i.e. 10-100 mg L-1) may therefore be required for CSIA. Hence, there is a need for an efficient
preparative procedure from large volumes of environmental water samples that can provide the required large amounts of analyte without compromising accurate CSIA. Second, GC/IRMS and LC/IRMS analyses require
baseline separation of the target compounds from interfering substances and complex mixtures.9,16,38 Indeed,
during sample pre-concentration, matrix components are enriched together with the target compounds, potentially compromising the chromatographic resolution of the latter. Furthermore, environmental samples usually contain mixtures of pollutants and thus, to minimize workload, pre-concentration methods should be
3 4 5 6 7 8 9 10 11 12 13 14 15 16 17 18 19 20 21 22 23 24 25 26 27 28 29 30 31 32 33 34 35 36 37 38 39 40 41 42 43 44 45 46 47 48 49 50 51 52 53 54 55 56 57 58 59 60
Analyst
Accepted
Manuscript
Published on 13 March 2019. Downloaded by Universitat de Barcelona on 3/13/2019 8:06:38 AM.
View Article Online DOI: 10.1039/C9AN00160C
suitable for extracting various compounds at the same time, covering a broad polarity range but ensuring good chromatographic resolution.
A method of choice for the extraction and pre-concentration of pesticides from large volumes of aqueous solution is solid-phase extraction (SPE). The sorbent is selected depending on the characteristics of the analytes to be retained and on the complexity of the sample matrix. A great variety of sorbents with a broad range of
properties are commercially available. Excellent reviews regarding sorbents mostly used for micropollutants
39-42, as well as several examples of pesticide extractions from large-volume water samples43,44 have been
published. Schreglmann et al.30 validated a SPE-CSIA method for atrazine and desethylatrazine extraction from
up to 10 L of tap water spiked at concentrations from 0.5 to 50 µg L-1 by using a hydrophilic divinylbenzene
sorbent. However, no extraction and pre-concentration methods applied to large-volume samples for accurate CSIA of mixtures of herbicides covering a broad polarity range at nanomolar concentrations in environmental waters are currently available.
The main objective of the present study is therefore to develop and validate a SPE-CSIA method for determining carbon and nitrogen isotope ratios of pesticides and metabolites covering a wide range of polarities that commonly occur together in groundwater at nanomolar concentrations. The mixture selected for this work (atrazine -ATR- , desethylatrazine -DEA-, desisopropylatrazine -DIA-, acetochlor -ACETO-, metolachlor -METO-, chloridazon -CLZ-, desphenylchloridazon -DPC-, methyl-desphenylchloridazon -M-DPC-, and 2,6-dichlorobenzamide -BAM-) displays a broad range of polarity (octanol-water partition coefficient, log KOW,
ranging from -0.4 to 3.1) (Table 1). To this end, we (i) optimized SPE conditions for the mixture of the target compounds; (ii) scaled the selected SPE method to large-volume samples; (iii) validated instrumental methods for carbon and nitrogen CSIA of the selected compounds; and (iv) validated the entire SPE-CSIA procedure for C and N CSIA of the target compounds in agricultural drainage water samples.
Experimental section
Optimization of the SPE method at small scale
We first compared the performance of different SPE sorbents for extracting the target compounds from small-volume samples of distilled water. The sorbents were selected based on previously published studies as follows. For ATR, DEA and DIA extraction from environmental water samples, polystyrene-divinylbenzene
(PS-DVB)-based sorbents with hydrophilic character such as Oasis HLB and Strata-X have been mainly used45-47,48, but also
silica-based49, graphitized carbon-based49 and hypercrosslinked polystyrene-divinylbenzene (HC-PS-DVB)
sorbents.51 CLZ has been successfully extracted with Oasis HLB49,50 and HC-PS-DVB sorbents.51,52 Schatz (2012)53
found that only the HC-PS-DVB sorbents Bakerbond SDB-1 and LiChrolut EN were able to retain DPC. Nevertheless, other authors have used Oasis HLB for extracting DPC and M-DPC, although recoveries have not
3 4 5 6 7 8 9 10 11 12 13 14 15 16 17 18 19 20 21 22 23 24 25 26 27 28 29 30 31 32 33 34 35 36 37 38 39 40 41 42 43 44 45 46 47 48 49 50 51 52 53 54 55 56 57 58 59 60
Analyst
Accepted
Manuscript
Published on 13 March 2019. Downloaded by Universitat de Barcelona on 3/13/2019 8:06:38 AM.
View Article Online DOI: 10.1039/C9AN00160C
been reported.5,54 Successful extraction of the chloroacetanilides ACETO and METO has been reported using the
PS-DVB sorbents Oasis HLB and Strata X45,47,49,51, as well as C18 bonded silica.55 The reported approaches for
extracting BAM have mainly used Oasis HLB56,57 and other DVB phases.58 Based on this body of literature, and
considering the wide range of polarity of the selected pesticides, the following sorbents were tested in this study: one graphitized carbon-based sorbent (Supelclean ENVI-Carb), one styrene-divinylbenzene (ST-DVB) sorbent (Strata-SDB-L), two PS-DVB sorbents with hydrophilic character (Oasis HLB and Sepra ZT, which is the bulk phase of Strata X) and two hydrophobic HC-PS-DVB sorbents with ultra-high surface area (Bakerbond SDB-1 and LiChrolut EN). Details about the properties of the tested SPE sorbents can be found in Table S1 (Supplementary information).
The performance of the method was evaluated in terms of extraction efficiency from a mixture of the target
compounds under different conditions, based on previous studies: concentration levels (from 1 to 25 µg L-1),
water volumes (from 20 to 500 mL), pH values (3 and unmodified pH), sorbent mass (0.2 to 1 g), and elution
solvents (ethyl acetate and methanol). Atrazine-d5, alachlor-d13 and chloridazon-d5 were added to the samples
at 1.25, 5.0 and 5.0 µg L-1, respectively, as surrogate standards. The internal standard terbuthylazine was added
to the final extracts at 50 µg L-1. Samples were then analyzed by ultra-high pressure liquid chromatography
quadrupole time of flight mass spectrometry, as explained below. Recoveries were determined by comparing the peak areas obtained in the spiked samples with those obtained in standard solutions at equivalent concentrations. The overall recovery of each pesticide was calculated as the mean recovery of the spiked samples extracted on different days using the same method and the same equipment. Repeatability was expressed as relative standard deviation (RSD).
Optimization of the large-volume water extraction procedure
The SPE approach was further evaluated to rule out SPE-induced isotope fractionation from large-volume samples. First, efficiency of the SPE approach was tested with 5 L and 10 L tap water spiked with 0.1 µg L-1 of the
target compounds. Second, the method performance was evaluated with spiked environmental aqueous samples to identify potential interferences from matrix compounds during chromatographic separation.
Samples from the drainage water of lysimeters filled with arable soils were used.59 Sorbent performance was
evaluated in 10 L filtered (0.7-μm glass fibre filters) drainage water samples spiked with 0.1 to 50 µg L-1 of the
target compounds. Finally, the integrity of the isotope values after large-volume SPE was assessed. Validation tests consisted of ten liter samples spiked with standards of the target compounds with known isotope
signatures (at 0.5 to 50 µg L-1), for which SPE was performed following the optimized method.
Analytical methods 3 4 5 6 7 8 9 10 11 12 13 14 15 16 17 18 19 20 21 22 23 24 25 26 27 28 29 30 31 32 33 34 35 36 37 38 39 40 41 42 43 44 45 46 47 48 49 50 51 52 53 54 55 56 57 58 59 60
Analyst
Accepted
Manuscript
Published on 13 March 2019. Downloaded by Universitat de Barcelona on 3/13/2019 8:06:38 AM.
View Article Online DOI: 10.1039/C9AN00160C
A detailed description of the analytical methods is available in the Supplementary information. Briefly, concentrations of the target compounds in the SPE eluates were determined by ultra-high pressure liquid chromatography quadrupole time of flight mass spectrometry (UHPLC-QTOF-MS), using the qualifier and quantifier ions listed in Table S2 (Supplementary information). Among the target compounds, DPC is the most polar one and is therefore not directly amenable to gas chromatographic separation. For CSIA, for that reason, the following strategy was chosen. Whereas the other compounds were analyzed by GC/IRMS without prior modification, LC/IRMS was used for carbon isotope analysis of DPC, and GC/IRMS after derivatization was used
for nitrogen isotope analysis of DPC, respectively.35 Carbon and nitrogen CSIA of ATR, ACETO, METO, DEA and
BAM in ethyl acetate (EtAc) was performed by GC/IRMS according to modified methods.19,23,30,60 Carbon CSIA of
DPC in water was performed by LC/IRMS as explained elsewhere.35 For measuring N isotope signatures of DPC,
derivatization with trimethylsilyldiazomethane was performed prior to GC/IRMS analysis.35 The CSIA methods
were validated following quality assurance recommendations from the US-EPA.7 The trueness of the isotope
measurements was expressed as the deviation of isotope signatures measured by GC/IRMS and LC/IRMS from reference isotope ratios of the calibrated in-house standards of known carbon and nitrogen isotope ratios, which were previously determined by Elemental Analyzer (EA)/IRMS based on two-point normalization using the international organic reference materials USG 40 (L-glutamic acid), USG 41 (L-glutamic acid) and IAEA 600 (caffeine), provided by the International Atomic Agency (Vienna, Austria).35 Isotope ratios of the in-house
standards are listed in Table S3 (Supplementary information). Carbon and nitrogen isotope values are reported in per mil (‰) using the delta notation relative to the international standards Vienna PeeDee Belemnite (V-PDB) and air, respectively:
(1)
𝛿 (𝑖𝑛 ‰) =
(
𝑅𝑅𝑠𝑡𝑑― 1
)
where R and Rstd are the isotope ratios of the sample and the standard, respectively. All reported isotope ratios
are expressed as arithmetic means of replicate measurements with 1 standard deviation (±σ) in δ13C and δ15N
values as a measure for instrumental precision.
Limits of precise isotope analysis, amount dependency, and reproducibility
The GC/IRMS and LC/IRMS instrumental limit of precise isotope analysis (Limitinstrument) was determined for each
target compound according to the moving mean method61,62, using standard solutions of known isotope
composition and uncertainty intervals of ±0.5‰ for δ13C and ±1‰ for δ15N. The linearity range (i.e. the range
between the smallest and the largest concentration for which the standard deviation of the mean isotope ratio
value is within the projected uncertainty intervals) was determined for each compound for both δ13C and δ15N.
The reproducibility and long-term stability of the GC/IRMS and LC/IRMS systems were established for different concentrations within the linear range over a period of time ranging between 1 and 3 months.
3 4 5 6 7 8 9 10 11 12 13 14 15 16 17 18 19 20 21 22 23 24 25 26 27 28 29 30 31 32 33 34 35 36 37 38 39 40 41 42 43 44 45 46 47 48 49 50 51 52 53 54 55 56 57 58 59 60
Analyst
Accepted
Manuscript
Published on 13 March 2019. Downloaded by Universitat de Barcelona on 3/13/2019 8:06:38 AM.
View Article Online DOI: 10.1039/C9AN00160C
The limit of precise isotope analysis of the whole SPE-CSIA method (Limitmethod) (i.e. the minimum concentration
in water needed to reach the Limitinstrument), for both δ13C and δ15N, was estimated for each target compound
according to Eq. (2). (2) 𝐿𝑖𝑚𝑖𝑡𝑆𝑃𝐸 ― 𝐶𝑆𝐼𝐴 𝑚𝑒𝑡ℎ𝑜𝑑 = 𝐿𝑖𝑚𝑖𝑡𝑖𝑛𝑠𝑡𝑟𝑢𝑚𝑒𝑛𝑡 𝐶𝑜𝑛𝑐. 𝑓𝑎𝑐𝑡𝑜𝑟 × 1 𝑅𝑒𝑐𝑜𝑣.
where Recov. and Conc. factor are the extraction recoveries and pre-concentration factors achieved with the
optimized large-volume SPE method, respectively. The validation tests with spiked drainage water sampleswere
also used for experimental validation of the estimated Limitsmethod.
Results and Discussion
Optimization of the extraction methods
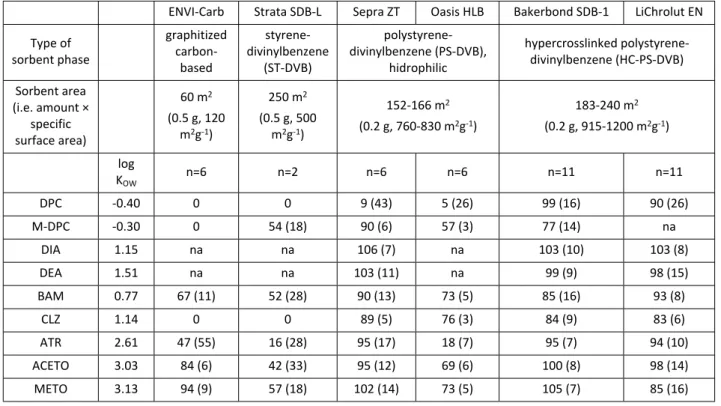
Sorbent screening. An initial screening study was performed to select the most promising sorbents in terms of extraction efficiency for the mixture of selected herbicides and metabolites. For all the selected sorbents, 0.2-g bulk phase was used, except in the case of the sorbents with the lowest specific surface area (ENVI-Carb and Strata SDB-L), for which 0.5-g of sorbent was utilized. Extraction efficiencies for each sorbent were evaluated in replicate trials from a mixture of the target compounds at the same mass load (0.25 µg of each compound, except DPC, for which 0.5 µg was added) and sample volume (20 mL) and using the same eluent solvent (EtAc) and the same eluent volume (3 mL).
Results of this sorbent screening are shown in Table 1. The two sorbents with the lowest surface area (ENVI-Carb and Strata SDB-L) were not able to retain neither CLZ nor DPC. M-DPC was not retained by ENVI-(ENVI-Carb, whereas partial recovery (54%) was achieved with Strata SDB-L. Recoveries for the rest of the target compounds were lower than 70%, except for the chloroacetanilides with ENVI-Carb (84-94%). Regarding the hydrophilic (i.e. with presence of polar moieties in their structures, and thus polar functionalities) PS-DVB sorbents, better performance was achieved with Sepra ZT than with Oasis HLB. Except for DPC (less than 10% recovery with both sorbents), recoveries for all compounds were satisfactory with Sepra ZT, ranging from 89 to 106%, with RSD values lower than 18% in all cases. Complete recovery of DPC (90-99%) was only achieved with the two hydrophobic hypercrosslinked HC-PS-DVB sorbents with ultra-high surface area (SDB-1 and LiChrolut EN), in accordance with the results of Schatz.53 M-DPC was partially retained by SDB-1 (77%) and not tested with
LiChrolut EN. For the rest of the analytes, high recoveries were also achieved using the HC-PS-DVB sorbents, ranging between 84 and 105% (RSDs up to 16%) with SDB-1 and between 83 and 103% (RSDs up to 16%) with LiChrolut EN.
Optimization at small scale (20-500 mL). Given the results of the sorbent screening, Sepra ZT, LiChrolut EN and SDB-1 were selected for further optimization of the extraction method. Extraction efficiency from a mixture of
3 4 5 6 7 8 9 10 11 12 13 14 15 16 17 18 19 20 21 22 23 24 25 26 27 28 29 30 31 32 33 34 35 36 37 38 39 40 41 42 43 44 45 46 47 48 49 50 51 52 53 54 55 56 57 58 59 60
Analyst
Accepted
Manuscript
Published on 13 March 2019. Downloaded by Universitat de Barcelona on 3/13/2019 8:06:38 AM.
View Article Online DOI: 10.1039/C9AN00160C
the target compounds at different concentration levels (from 1 to 25 µg L-1) and for different water volumes
(from 20 to 500 mL) was investigated by varying the following key parameters, one at a time: pH of water sample, and type and volume of elution solvent. Similar results in terms of extraction efficiency of Sepra ZT and SDB-1 were obtained with the three tested elution procedures: 3 mL EtAc, 3 mL MeOH and elution with a sequence of the two solvents (3 mL EtAc followed by 3 mL MeOH) (Fig. 1). Elution with 3 mL EtAc was finally selected due to higher recovery for DPC. Mass load effect was assessed for 0.2 g-cartridges of Sepra ZT. Increasing the mass by a factor 25 (from loading 0.02 µg to 0.5 µg) did not cause important changes in the extraction efficiency, except for M-DPC, BAM and ACETO (Fig. 2).
With the hydrophobic HC-PS-DVB sorbents, two strategies for increasing DPC recovery were tested: modifying
the pH of the sample and increasing sorbent mass.53 First, triplicate extractions using 0.2 g-cartridges of SDB-1
and LiChrolut EN were performed with 20 mL of distilled water containing 25 µg L-1 DPC with unmodified pH and
with pH adjusted to 3 with HCl. For both sorbents, higher DPC recovery has been reported at pH 3 than at pH
7.53 In the present experiments, however, no significant changes were observed for SDB-1 (113±5 and 109±8,
respectively) and DPC recovery using LiChrolut EN was only marginally enhanced at pH 3 (104±3 vs. 92±3 with unmodified pH). Similar results were also obtained for the rest of the metabolites (Fig. S1, Supplementary information). Second, to determine if an increase in sorbent mass would result in an increase in DPC recovery, two SDB-1 sorbent masses (0.2 and 1 g) were tested for extracting samples spiked with 0.005 to 0.5 µg DPC. The mass of 0.2 g resulted in complete recoveries of DPC for mass load of 0.25 and 0.5 g. For DPC mass load lower than 0.25 µg, however, 1 g of sorbent was required (90-100% recovery), rather than 0.2 g (40-60 % recovery) (Fig. S2, Supplementary information).
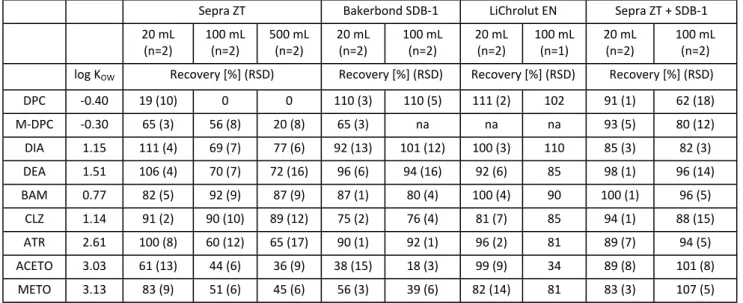
Finally, the breakthrough effect related to sample volume was assessed. The hydrophilic sorbent Sepra ZT and the hydrophobic hypercrosslinked sorbents with ultra-high surface area SDB-1 and LiChrolut EN were tested. For developing an efficient method that allows extracting all the analytes in one run in order to decrease workout, time and costs, layered cartridges containing one hydrophilic and one hydrophobic hypercrosslinked sorbent were also tested. Distilled water samples (20, 100 and 500 mL) spiked at 0.5 µg of each analyte (1 µg for DPC) were loaded onto the cartridges. For the commercial cartridges, elution was performed with 3 mL EtAc, whereas 6 mL EtAc were used for the homemade-layered cartridges due to the doubled sorbent mass. With Sepra ZT, all metabolites except BAM showed breakthrough (Table 2), most pronounced for M-DPC and DPC. Regarding the parent compounds, the breakthrough effect was also significant for ATR and METO. The HC-PS-DVB sorbents with ultra-high surface area (SDB-1 and LiChrolut EN) reduced, as expected, breakthrough volume for the most polar compounds, but, surprisingly, performed poorly for the chloroacetanilides. In contrast, using the layered column with Sepra ZT and SDB-1, breakthrough volumes higher than 100 mL were obtained for all analytes, except for DPC (between 20 and 100 mL). Therefore, the combination of the hydrophilic sorbent Sepra
3 4 5 6 7 8 9 10 11 12 13 14 15 16 17 18 19 20 21 22 23 24 25 26 27 28 29 30 31 32 33 34 35 36 37 38 39 40 41 42 43 44 45 46 47 48 49 50 51 52 53 54 55 56 57 58 59 60
Analyst
Accepted
Manuscript
Published on 13 March 2019. Downloaded by Universitat de Barcelona on 3/13/2019 8:06:38 AM.
View Article Online DOI: 10.1039/C9AN00160C
ZT and the hydrophobic hypercrosslinked sorbent SDB-1 provided the best performance to deal with the broad range of polarity of the selected analytes.
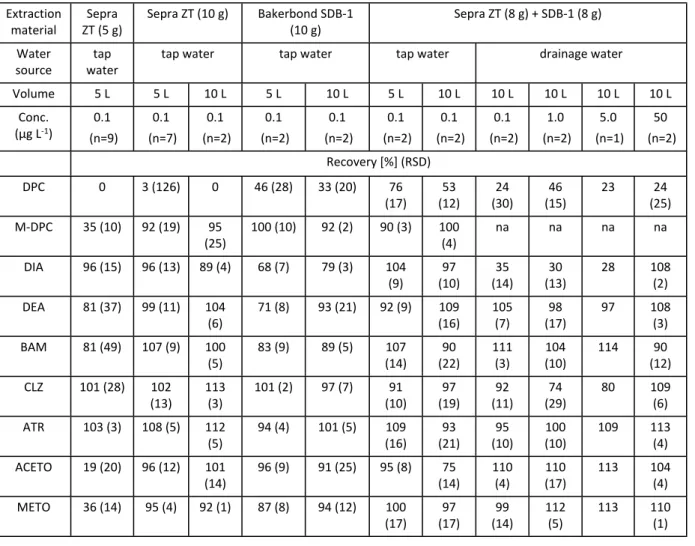
Scale-up to large volumes. Sorbent mass and breakthrough effects were assessed for cartridges containing Sepra
ZT and SDB-1 alone and combined. Tap water samples (5 and 10 L) spiked with 0.1 µg L-1 of each analyte were
loaded onto cartridges containing different sorbent masses (5 and 10 g of single sorbents and 8 g each for the combined approach) (Table 3). For 5 L samples, cartridges with 5 g of Sepra ZT, as expected, failed to recover DPC. Furthermore, recoveries for the rest of the compounds were low for M-DPC, ACETO and METO (19-36%) and acceptable for DIA, DEA, BAM, CLZ and ATR, but in all cases with high RSDs (up to 49%). Increasing the sorbent mass to 10 g resulted in excellent recoveries (92-108%) and RSDs (4-19%) for all the compounds, except DPC. Using 10 g of SDB-1, DPC was more strongly retained (46%) and similar results as those with Sepra ZT were achieved for the rest of the compounds, except in the case of DIA, DEA and BAM, for which recoveries were slightly lower (70-80%). The best results were obtained with the combination of 8 g of each sorbent in a layered cartridge. Excellent recoveries (90-109%, RSD <17%) were achieved for all the compounds, even for DPC (76±17%). The breakthrough effect was assessed increasing the sample volume to 10 L for the three cartridges (10 g Sepra ZT, 10 g SDB-1 and 8 g each) (Table 3). No compound displayed important breakthrough, except DPC, for which recovery slightly decreased (from 76% to 53%).
Finally, for the layered cartridges containing 8 g of SDB-1 and 8 g of Sepra ZT, matrix spikes were extracted to assess the influence of matrix components of real samples. To this end, known amounts of the target analytes (0.1 to 5 µg) were added to 10 L filtered (0.7-μm glass fibre filters) samples of agricultural drainage water59 (Table
3). At 0.1 μg L-1, similar recoveries were obtained for drainage water and tap water, except for DPC (24±30%)
and DIA (35±14%). Increasing the load by a factor of 50 (from 0.1 µg to 5 µg) did not result in changes in the extraction efficiency, except for a significant improvement for DIA. Loading 50 µg led to excellent retention of all compounds, except DPC, for which similar results were obtained independently of the mass load (approx. 25%).
The optimal SPE procedure for large-volume samples is detailed in the Supplementary information (section 3).
CSIA methods
We determined the trueness, precision, reproducibility and amount-dependency of the CSIA methods for each target compound using EtAc solutions of standard of known isotope composition determined by EA/IRMS. Results are shown in the Supplementary information (Table S4, Fig. S3). Briefly, δ13C and δ15N values of the ATR,
DEA, ACETO, METO and BAM working standards measured by GC/IRMS were reproducible over the whole period
of analysis. Good precision (expressed as ±σ) of ±0.3-0.5‰ (n=52-94) for δ13C and ±0.1-0.8‰ for δ15N analysis
were achieved (n=71-84 for ATR, DEA, ACETO and METO, and n= 11 for BAM). For ATR, ACETO and METO
3 4 5 6 7 8 9 10 11 12 13 14 15 16 17 18 19 20 21 22 23 24 25 26 27 28 29 30 31 32 33 34 35 36 37 38 39 40 41 42 43 44 45 46 47 48 49 50 51 52 53 54 55 56 57 58 59 60
Analyst
Accepted
Manuscript
Published on 13 March 2019. Downloaded by Universitat de Barcelona on 3/13/2019 8:06:38 AM.
View Article Online DOI: 10.1039/C9AN00160C
measurements, the trueness was within ≤ ±0.5‰ for δ13C and ≤ ±0.9‰ for δ15N and was thus within typical
uncertainties of ±0.5‰ and ±1‰, respectively. DEA, on contrast, showed very reproducible offsets of
+2.0±0.3‰ for δ13C and +1.1±0.1‰ for δ15N analysis compared to the reference EA/IRMS values. BAM isotope
analysis also showed a reproducible offset for δ13C (-1.6±0.5‰), whereas consistent δ15N values were obtained
(Δδ15N= +0.3±0.8‰). The occurrence of these offsets in GC/IRMS usually result from incomplete combustion of
the target analytes. Since these deviations are reproducible, true analysis can be nevertheless be achieved by bracketing samples with external compound-specific standards and subsequent offset correction. The LC/IRMS
method for δ13C analysis of DPC showed excellent reproducibility over the whole period of analysis (±0.4‰, n
=74), but with an offset of +3.2‰ compared to the reference EA/IRMS value. This offset is likely related to
incomplete wet oxidation of DPC.35 Offset correction is therefore also required for true analyses. Regarding the
derivatization-GC/IRMS method for determining δ15N values of DPC, good precision was achieved (±0.4‰,
n=12), with an offset of -1.6‰ compared to the reference EA/IRMS value.35 For direct injection of M-DPC, good
precision was also achieved (±0.4‰, n=46), with the offset of -1.6‰ compared to the reference EA/IRMS value.
The performance of δ13C and δ15N measurements was also assessed as a function of injected concentration (Fig.
S4 and Fig. S5, Supplementary information) and limits of precise isotope analysis (Limitsinstrument) were then
derived according to the moving mean procedure.61 For δ13C analysis by GC/IRMS for ATR, ACETO, METO and
DEA, instrumental limits of 0.15 to 0.20 mM (corresponding to 1.2-2.8 nmol C) were obtained. For BAM, a higher Limitinstrument of 1.0 mM (7.1 nmol C) was obtained. Similarly, Limitsinstrument for δ15N ranged between 0.10 and
0.25 mM (0.7-6.3 nmol N) for ATR, ACETO, METO and DEA, whereas for BAM the limit amounted to 0.50 mM
(2.5 nmol N). No amount dependency of the precision was observed between 0.15 and 4.1 mM for δ13C and
from 0.10 to 7.5 mM for δ15N for ATR, ACETO, METO and DEA. The linearity ranges for BAM were 1.0-4.1 mM
and 0.5-4.0 mM, respectively. The determined Limitinstrument for LC/IRMS analysis of DPC was 0.14 mM (27.5 nmol
C for an injection volume of 50 µL), and the linearity range was 27.5-133 nmol C. For δ15N of DPC, Limitinstrument
was 0.69 mM (corresponding to 2.1 nmol N), and the linearity range was 0.69-6.9 mM.35 Obtained values are
summarized in the Supplementary information (Table S5).
Validation of the SPE-CSIA procedure for the determination of δ13C and δ15N values of the target compounds
in water samples
For evaluating the effect of the SPE extraction procedure on 13C and δ15N values, standards of the target
compounds of known isotope ratios were spiked into 10 L agricultural drainage water samples to give
concentrations in the range of 0.5-50 µg L-1. Extraction was performed using the cartridges containing 8 g of
SDB-1 and 8 g of Sepra ZT. Results are shown in Fig. 3 and Fig. 4 and listed in the Supplementary information (Table S6). In most cases, both trueness and precision were comparable between SPE extracts and freshly
prepared standards. The SPE-CSIA method therefore induced negligible isotope fractionation, which was within
3 4 5 6 7 8 9 10 11 12 13 14 15 16 17 18 19 20 21 22 23 24 25 26 27 28 29 30 31 32 33 34 35 36 37 38 39 40 41 42 43 44 45 46 47 48 49 50 51 52 53 54 55 56 57 58 59 60
Analyst
Accepted
Manuscript
Published on 13 March 2019. Downloaded by Universitat de Barcelona on 3/13/2019 8:06:38 AM.
View Article Online DOI: 10.1039/C9AN00160C
the uncertainty of analysis. The deviation from the EA/IRMS values of the δ13C values for DEA and DPC and δ15N
values for DPC was almost identical to the offset from the reference value measured without SPE, indicating that
this deviation did not originate from the enrichment procedure. It is worth noting that precise δ13C values for
DPC were obtained despite relatively low extraction efficiencies. In general, for GC/IRMS measurements of the spiked samples, proper chromatographic separation of the target compounds was achieved. Contrary to GC/IRMS, LC/IRMS measurements are more susceptible to interferences that could compromise the accuracy of isotope analysis produced by the concomitant enrichment of organic matrix. The chromatographic resolution was lower and thus there was a higher probability that analytes overlap with matrix compounds. The agricultural drainage water used in this work comes from lysimeters filled with 2.5 m arable soils, containing up to 2% organic
matter, mostly in the first 70 cm.59 Dissolved organic carbon (DOC) content in the water samples, measured by
organic-matter combustion, ranged between 1.1 and 2.4 mg C L-1. Although no attempts were made to
characterize organic compounds of the drainage water, a high content of fulvic acids is expected.63 A previous
study using the same hydrophobic HC-PS-DVB sorbent with ultra-high surface area (Bakerbond SDB-1 cartridges,
with a surface area of 1060 m2g-1) demonstrated that fulvic acids are not retained at neutral pH and thus no
co-retention/co-elution with the target pesticides occurred.52 Similarly, in our study, the DOC did not interfere with
CSIA analysis. Precise δ13C-DPC values were obtained even at concentrations below the instrumental limit of
27.5 nmol C on-column. Examples of resulting GC/IRMS and LC/IRMS chromatograms for both standards and spiked drainage water samples are shown in the Supplementary information (Fig. S6).
SPE-CSIA method limits for precise isotope analyses in water samples
The minimum concentrations of the target analytes in water samples necessary for precise and true isotope
analysis (Limitsmethod) were calculated following Eq. (2). For calculations, extraction recoveries of 25% for DPC
and 95% for the other compounds (Table 3) were applied. A reconstitution volume of 80 μL was assumed, except
for LC/IRMS analysis, for which 150 μL was used. The obtained Limitmethod for ATR, ACETO, METO and DEA ranged
from 0.3 to 0.5 μg L-1 for δ13C and from 0.2 to 0.4 μg L-1 for δ15N values (Table S5, Supplementary information).
Higher limits were obtained for BAM (1.6 and 0.8 μg L-1, respectively) and DPC (1.2 and 3.2 μg L-1, respectively).
Consistent with these calculations, in the validation tests, accurate δ13C and δ15N values (i.e. deviation from
bracketing standards and precision within typical uncertainties of ±0.5‰ and ±1‰, respectively) were obtained for ATR, ACETO and METO at concentrations as low as 0.5 μg L-1. For DEA, the SPE-CSIA method was also
validated for water samples at concentrations as low as 0.5 μg L-1 for δ13C, whereas higher concentrations (2.5
μg L-1) were required for accurate measurements of δ15N. True results (meaning that the deviation from
bracketing standards was within ±1.0‰) were obtained for δ15N of BAM, although the method was only tested
with environmental water samples at concentrations much above the Limitmethod (4 to 10 μg L-1). For δ13C,
however, deviation from bracketing standards (up to +2.2‰) was higher than the typical uncertainty of ±0.5‰.
3 4 5 6 7 8 9 10 11 12 13 14 15 16 17 18 19 20 21 22 23 24 25 26 27 28 29 30 31 32 33 34 35 36 37 38 39 40 41 42 43 44 45 46 47 48 49 50 51 52 53 54 55 56 57 58 59 60
Analyst
Accepted
Manuscript
Published on 13 March 2019. Downloaded by Universitat de Barcelona on 3/13/2019 8:06:38 AM.
View Article Online DOI: 10.1039/C9AN00160C
Nevertheless, the two samples investigated at 0.5 and 1 μg L-1, at concentrations below Limit
method, resulted still
in true results (deviation from bracketing standards within ±0.7‰).
The accuracy of δ15N analysis of DPC was also validated at concentrations as low as 1.0 μg L-1. For δ13C-DPC for
few spiked samples at concentrations close to the calculated method limit, the accuracy of LC/IRMS measurements was compromised since lower signal (m/z 44) sizes than expected were obtained and/or the concomitant enrichment of organic matrix led to interferences. Nevertheless, as stated above, when amplitudes
were higher than those corresponding to the Limitinstrument, accurate δ13C-DPC values were achieved.
Conclusions
With this study, we validate a SPE-CSIA method for analyzing carbon and nitrogen isotope ratios of mixtures of herbicides and metabolites that commonly occur together in environmental water samples. Isotope ratios at
analyte concentrations in the sub-μgL-1-range can be measured accurately with substantial pre-concentration of
up to 200,000-fold. For the optimized SPE method, a hydrophobic hypercrosslinked sorbent with ultra-high surface area (SDB-1) and a polymeric sorbent chemically modified introducing polar functional groups (Sepra ZT) were used to obtain an appropriate balance between selectivity and the ability to retain as many analytes as possible, covering a broad polarity range. SPE followed by CSIA enables carbon and nitrogen isotope
measurements of a mixture of herbicides and metabolites with a wide range of polarity (Kow from -0.4 to 3.1) in
agricultural drainage water. We developed the SPE-CSIA method for compounds that frequently occur in groundwater. For common unconsolidated sand and/or gravel aquifer, the DOC concentration in groundwater
tends to decrease rapidly as function of depth to the water table64, thus limiting matrix effect. Our lysimeter
study59 with a rather shallow layer (1.5 m) between the organic carbon-rich top soil and the water sampling
point represents a rather unfavorable case. Thus, we expect that our method is widely applicable for groundwater. For water samples containing higher DOC contents than in our study (e.g. river water, groundwater from aquifers with organic deposits, waste water treatment plant influent or effluent), additional clean-up steps may be required to reduce the effect of the organic matrix and thus obtain reliable isotope measurements. Further extracts clean-up can for example be performed with preparative HPLC, a technique previously used for various pesticides.30,65,66 Selective clean-up by molecularly-imprinted polymers has also
recently been proposed for CSIA of enriched organic micropollutants.67 The described SPE-CSIA method can also
be extended to other elements, such as hydrogen, given that analytical methods have recently been validated for 2H/1H analysis of some pesticides.18,68,69 Nevertheless, a higher limit for precise isotope analysis is expected
for hydrogen than for carbon, since larger amounts of hydrogen usually need to be injected.37
The method proposed in this study is an important step towards analyzing isotope ratios of pesticide mixtures in aquatic systems. Isotope fractionation during pesticide degradation has been proven at lab scale16,
demonstrating the potential of CSIA for tracing transformation of these contaminants in the environment. Our
3 4 5 6 7 8 9 10 11 12 13 14 15 16 17 18 19 20 21 22 23 24 25 26 27 28 29 30 31 32 33 34 35 36 37 38 39 40 41 42 43 44 45 46 47 48 49 50 51 52 53 54 55 56 57 58 59 60
Analyst
Accepted
Manuscript
Published on 13 March 2019. Downloaded by Universitat de Barcelona on 3/13/2019 8:06:38 AM.
View Article Online DOI: 10.1039/C9AN00160C
study demonstrates that, despite the analytical challenges, multi-element CSIA of wide-polarity mixtures of pesticides at environmentally relevant concentrations is viable. This method will thus enable the application of CSIA to field sites for tracking pesticide sources and transformation processes.
CONFLICTS OF INTEREST
There are no conflicts to declare.
ACKNOWLEDGMENTS
This study was supported by the project CRSII2_141805/1 from the Swiss National Science Foundation (SNSF). The authors would like to thank the NPAC (UNiNE) and Jakov Bolotin (Eawag) for their help in the laboratory. We thank the editor and two anonymous reviewers for comments that improved the quality of the manuscript.
ELECTRONIC SUPPLEMENTARY INFORMARTION
Further details on chemicals and reagents, analytical methods, optimization of the extraction methods, CSIA methods and validation of the SPE-CSIA procedure.
AUTHOR INFORMATION
Corresponding Author
* Phone: +34 934 033 773; e-mail: [email protected]
Present Addresses
† Grup MAiMA, Departament de Mineralogia, Petrologia i Geologia Aplicada, Facultat de Ciències de la Terra, Universitat de Barcelona (UB), C/ Martí i Franquès s/n, 08028, Barcelona, Spain.
REFERENCES
1 M. Leistra and J.J.T.I. Boesten, Agr Ecosyst Environ, 1989, 26, 369.
2 D.W. Kolpin, E.M. Thurman and S.M. Linhart, Arch Environ Contam Toxicol, 1998, 35, 385. 3 D.W. Kolpin, E.M. Thurman and S.M. Linhart, Sci Total Environ, 2000, 248, 115.
4 J.E. Barbash, G.P.D. Thelin, W. Kolpin and R.J. Gilliom, J Environ Qual, 2001, 30, 831.
5 R. Loos, G. Locoro, S. Comero, S. Contini, D. Schwesig, F. Werres, P. Balsaa, O. Gans, S. Weiss, L. Blaha, M. Bolchi and B.M. Gawlik, Water Res, 2010, 44, 4115.
6 K. Fenner, S. Canonica, L.P. Wackett and M. Elsner, Science, 2013, 341, 752.
7 D. Hunkeler, R.U. Meckenstock, B. Sherwood Lollar, T. Schmidt, J. Wilson, T. Schmidt and J. Wilson, A guide for assessing
biodegradation and source identification of organic ground water contaminants using compound specific isotope analysis (CSIA), PA 600/R-08/148, US EPA, Oklahoma, USA, 2008.
8 T.B. Hofstetter, R.P. Shwarzenbach and S.M. Bernasconi, Environ Sci Technol, 2008, 42, 7737. 3 4 5 6 7 8 9 10 11 12 13 14 15 16 17 18 19 20 21 22 23 24 25 26 27 28 29 30 31 32 33 34 35 36 37 38 39 40 41 42 43 44 45 46 47 48 49 50 51 52 53 54 55 56 57 58 59 60
Analyst
Accepted
Manuscript
Published on 13 March 2019. Downloaded by Universitat de Barcelona on 3/13/2019 8:06:38 AM.
View Article Online DOI: 10.1039/C9AN00160C
9 M. Elsner, A. Jochmann, T.B. Hofstetter, D. Hunkeler, A. Bernstein, T.C. Schmidt and A. Schimmelmann, Anal Bioanal Chem, 2012, 403, 2471.
10 M. Braeckevelt, A. Fischer and M. Kästner M, Appl Microbiol Biotechnol, 2012, 94, 1401. 11 M. Elsner, J Environ Monit, 2010, 12, 2005.
12 T.B. Hofstetter and M. Berg, TrAC Trends Anal Chem, 2011, 30, 618.
13 C. Vogt, C. Dorer, F. Musat and H.-H. Richnow, Curr Opin Biotech, 2016, 41, 90.
14 I. Nijenhuis, J. Renpenning, S. Kümmel, H.-H. Richnow and Gehre, Trends Environ Anal Chem, 2016, 11, 1. 15 J. Masbou, G. Drouin, S. Payraudeau and G. Imfeld, Chemosphere, 2018, 213, 368.
16 M. Elsner and G. Imfeld, Curr Opin Biotech, 2016, 41, 60. 17 H. Penning and M. Elsner, Anal Chem, 2007, 79, 8399.
18 A.E, Hartenbach, T.B. Hofstetter, P.R. Tentscher, S. Canonica, M. Berg and R.P. Schwarzenbach, Environ Sci Technol, 2008,
42, 7751.
19 A.H. Meyer, H. Penning, H. Lowag and M. Elsner, Environ Sci Technol, 2008, 42, 7757.
20 S.-L. Badea, C. Vogt, S. Weber, A.-F. Danet and H.-H. Richnow, Environ Sci Technol, 2009, 43, 3155. 21 S. Reinnicke, A. Bernstein, M. Elsner, Anal Chem, 2010, 82, 2013.
22 S.-L. Badea, C. Vogt, M. Gehre, A. Fischer, A.-F. Danet and H.-H. Richnow, Rapid Commun Mass Spectrom, 2011, 25, 363. 23 S. Reinnicke, A. Simonsen, S.R. Sørensen, J. Aamand and M. Elsner, Environ Sci Technol, 2012, 46, 1447.
24 N. Milosevic, S. Qiu, M. Elsner, F. Einsiedl, M.P. Maier, H.K.V. Bensch, H.J. Albrechtsen and P.L. Bjerg, Water Res, 2013,
47, 637.
25 O.F. Elsayed, E. Maillard, S. Vuilleumier, I. Nijenhuis, H.H. Richnow and G. Imfeld, Chemosphere, 2014, 99, 89. 26 N. Ivdra, S. Herrero-Martín and A. Fischer, J Chromatogr A, 2014, 1355, 36.
27 L. Wu, J. Yao, P. Trebse, N. Zhang and H.-H. Richnow, Chemosphere. 2014, 111, 458.
28 E.O. Mogusu, J.B. Wolbert, D.M. Kujawinski, M.A. Jochmann, M. Elsner, Anal Bioanal Chem, 2015, 407, 5249. 29 X. Tang, Y. Yang, W. Huang, M.B. McBride, J. Guo, R. Tao and Y. Dai, Bioresour Technol, 2017, 233, 264. 30 K. Schreglmann, M. Hoeche, S. Steinbeiss, S. Reinnicke and M. Elsner, Anal Bioanal Chem, 2013, 405, 2857. 31 S. Bashir, K.L. Hitzfeld, M. Gehre, H.H. Richnow and A. Fischer, Water Res, 2015, 71, 187.
32 S.R. Lutz, Y.V.D. Velde, O.F. Elsayed, G. Imfeld, M. Lefrancq, S. Payraudeau and B.M. van Breukelen, Hydrol Earth Syst
Sci, 2017, 21, 5243.
33 Y. Liu, S. Bashir, R. Stollberg, R. Trabitzsch, H. Weiß, H. Paschke, I. Nijenhuis and H.-H. Richnow, Environ Sci Technol, 2017,
51, 8909.
34 P. Alvarez-Zaldívar, S. Payraudeau, F. Meite, J. Masbou and G. Imfeld, Water Res. 2018, 139, 198.
35 A. Melsbach, V. Ponsin, C. Torrentó, C. Lihl, T.B. Hofstetter, D. Hunkeler and M. Elsner, Anal Chem. 2019, 91, 3412. 36 ISO 5. 5725–1. Accuracy [Trueness and Precision] of Measurement Methods and Results, Part 1: General Principles and
Definitions, International Standard Organization, Geneve, 1994.
37 T.C. Schmidt and M.A. Jochmann, Annu Rev Anal Chem, 2012, 5, 133.
38 M. Blessing, M.A. Jochmann and T.C. Schmidt, Anal Bioanal Chem, 2008, 390, 591. 39 N. Masqué, R.M. Marcé and F. Borrull, TrAC-Trend Anal Chem, 1998, 17, 384. 40 H. Sabik, R. Jeannot, and B. Rondeau, J Chromatogr A, 2000, 885, 217. 3 4 5 6 7 8 9 10 11 12 13 14 15 16 17 18 19 20 21 22 23 24 25 26 27 28 29 30 31 32 33 34 35 36 37 38 39 40 41 42 43 44 45 46 47 48 49 50 51 52 53 54 55 56 57 58 59 60
Analyst
Accepted
Manuscript
Published on 13 March 2019. Downloaded by Universitat de Barcelona on 3/13/2019 8:06:38 AM.
View Article Online DOI: 10.1039/C9AN00160C
41 N. Fontanals, R.M. Marcé and F. Borrull, J Chromatogr A, 2007, 1152, 14. 42 B. Buszewski and M. Szultka, Crit Rev in Anal Chem, 2012, 42, 198. 43 H. Sabik, and R. Jeannot, J Chromatogr A. 1998, 818, 197.
44 S. Weigel, K. Bester and H. Hühnerfuss, J Chromatogr A, 2001, 912, 151. 45 A. Hildebrandt, S. Lacorte and D. Barceló, Anal Bioanal Chem, 2007, 387, 1459. 46 V. Matamoros, E. Jover and J.M. Bayona, Anal Chem, 2010, 82, 699.
47 T.B. Huff and G.D. Foster, J Environ Sci Heal B, 2011, 46, 723.
48 C. Valls-Cantenys, M. Scheurer, M. Iglesias, F. Sacher, H.-J. Brauch and V. Salvadó, Anal Bioanal Chem, 2016, 408, 6189. 49 L.T.D. Cappelini, D. Cordeiro, S.H.G. Brondi, H.R. Prieto and E.M. Vieira, Environ Technol, 2012, 33, 20, 2299.
50 S.Y. Panshin, D.S. Carter and E.R. Bayless, Environ Sci Technol, 2000, 34, 2131. 51 A. Junker-Buchheit and M. Witzenbacher, J Chromatogr A., 1996, 737, 67
52 V. Pichon, C. Cau-Dit-Coumes, L. Chen, S. Guenu and M.C. Hennion, J Chromatogr A, 1996, 737, 25. 53 N.J. Schatz, PhD Thesis, Karlsruhe Institute of Technology, Karlsruhe, 2012.
54 G. Buttiglieri, M. Peschka, T. Frömel, J. Müller, F. Malpei, P. Seel and T.P. Knepper, Water Res, 2009, 43, 2865. 55 R.A. Yokley, L.C. Mayer, S.-B. Huang and J.D. Vargo, Anal Chem, 2002, 74, 3754.
56 E. Porazzi, M.P. Martinez and F.E. Benfenati, Talanta, 2005, 68, 146.
57 G.G. Jensen, E. Björklund, A. Simonsen and B. Halling-Sørensen, J Chromatogr A, 2009, 1216, 5199. 58 S.-L. McManus, M. Moloney, K.G. Richards, C.E. Coxon and M. Danaher, Molecules, 2014, 19, 20627.
59 C. Torrentó, V. Prasuhn, E. Spiess, V. Ponsin, A. Melsbach, C. Lihl, G. Glauser, T.B. Hofstetter, M. Elsner and D. Hunkeler,
Vadose Zone J, 2018, 17, 170033.
60 S. Spahr, S. Huntscha, J. Bolotin, M.P. Maier, M. Elsner, J. Hollender and T.B. Hofstetter, Anal Bioanal Chem, 2013, 405, 2843.
61 M.A. Jochmann, M. Blessing, S.B. Haderlein and T.C. Schmidt, Rapid Commun Mass Spectrom, 2006, 20, 3639. 62 A.L. Sessions, J Sep Sci, 2006, 29, 1946.
63 R. Artinger, G. Buckau, S. Geyer, P. Fritz, M. Wolf and J.I. Kim, Appl Geochem, 2000, 15, 97. 64 W.J. Pabich, I. Valiela and H.F. Hemond, Biogeochemistry, 2001, 55, 247.
65 H. Penning, S.R. Sørensen, A.H. Meyer, J. Aamand and M. Elsner, Environ Sci Technol, 2010, 44, 2372.
66 H.K.V. Schürner, M.P. Maier, D. Eckert, R. Brejcha, C.-C. Neumann, C. Stumpp, O.A. Cirpka and M. Elsner, Environ Sci
Technol, 2016, 50, 5729.
67 R. Bakkour, J. Bolotin, B. Sellergren and T.B. Hofstetter, Anal Chem, 2018, 90, 7292. 68 L. Wu, S. Kümmel and H.H. Richnow, Anal Bioanal Chem, 2017, 409, 2581.
69 J. Renpenning, S. Kümmel, K.L. Hitzfeld, A. Schimmelmann and M. Gehre, Anal Chem, 2015, 87, 9443. 3 4 5 6 7 8 9 10 11 12 13 14 15 16 17 18 19 20 21 22 23 24 25 26 27 28 29 30 31 32 33 34 35 36 37 38 39 40 41 42 43 44 45 46 47 48 49 50 51 52 53 54 55 56 57 58 59 60
Analyst
Accepted
Manuscript
Published on 13 March 2019. Downloaded by Universitat de Barcelona on 3/13/2019 8:06:38 AM.
View Article Online DOI: 10.1039/C9AN00160C
Table 1. Log KOW values of the target compounds, sorbent characteristics and average extraction recoveries (%)
for sorbent screening using the six selected sorbents. Sorbent specific surface area increases from left column to right column. The average extraction recoveries were obtained from replicated experiments (n= 6 or 11, except for SDB-L, with n= 2). 20-mL of distilled water spiked to 12.5 µg L-1 of each pesticide (25 µg L-1 for DPC)
were extracted. The relative standard deviations (RSD %) are shown in parenthesis. na= for some of the tests, the metabolites M-DPC, DIA and DEA were not added because the standards were not available when the tests were performed.
ENVI-Carb Strata SDB-L Sepra ZT Oasis HLB Bakerbond SDB-1 LiChrolut EN Type of sorbent phase graphitized carbon-based styrene-divinylbenzene (ST-DVB) polystyrene-divinylbenzene (PS-DVB), hidrophilic hypercrosslinked polystyrene-divinylbenzene (HC-PS-DVB) Sorbent area (i.e. amount × specific surface area) 60 m2 (0.5 g, 120 m2g-1) 250 m2 (0.5 g, 500 m2g-1) 152-166 m2 (0.2 g, 760-830 m2g-1) 183-240 m2 (0.2 g, 915-1200 m2g-1) log KOW n=6 n=2 n=6 n=6 n=11 n=11 DPC -0.40 0 0 9 (43) 5 (26) 99 (16) 90 (26) M-DPC -0.30 0 54 (18) 90 (6) 57 (3) 77 (14) na DIA 1.15 na na 106 (7) na 103 (10) 103 (8) DEA 1.51 na na 103 (11) na 99 (9) 98 (15) BAM 0.77 67 (11) 52 (28) 90 (13) 73 (5) 85 (16) 93 (8) CLZ 1.14 0 0 89 (5) 76 (3) 84 (9) 83 (6) ATR 2.61 47 (55) 16 (28) 95 (17) 18 (7) 95 (7) 94 (10) ACETO 3.03 84 (6) 42 (33) 95 (12) 69 (6) 100 (8) 98 (14) METO 3.13 94 (9) 57 (18) 102 (14) 73 (5) 105 (7) 85 (16) 3 4 5 6 7 8 9 10 11 12 13 14 15 16 17 18 19 20 21 22 23 24 25 26 27 28 29 30 31 32 33 34 35 36 37 38 39 40 41 42 43 44 45 46 47 48 49 50 51 52 53 54 55 56 57 58 59 60
Analyst
Accepted
Manuscript
Published on 13 March 2019. Downloaded by Universitat de Barcelona on 3/13/2019 8:06:38 AM.
View Article Online DOI: 10.1039/C9AN00160C
Table 2. Breakthrough effect. Mean recoveries (%) and relative standard deviation (RSDs) are shown, obtained
on loading different sample volumes of distilled water spiked with 0.5 µg with each analyte (1 µg for DPC) on 0.2 g-cartridges of Sepra ZT, SDB-1 or LiChrolut EN, and on layered columns containing 0.2 g Sepra ZT and 0.2 g SDB-1. Tests were performed in duplicate (n=2), except for 100 mL with LiChrolut EN, for which only one test was done. na= for some of the tests, M-DPC was not added because the standard was not available when the tests were performed.
Sepra ZT Bakerbond SDB-1 LiChrolut EN Sepra ZT + SDB-1 20 mL
(n=2) 100 mL (n=2) 500 mL (n=2) 20 mL (n=2) 100 mL (n=2) 20 mL (n=2) 100 mL (n=1) 20 mL (n=2) 100 mL (n=2) log KOW Recovery [%] (RSD) Recovery [%] (RSD) Recovery [%] (RSD) Recovery [%] (RSD)
DPC -0.40 19 (10) 0 0 110 (3) 110 (5) 111 (2) 102 91 (1) 62 (18) M-DPC -0.30 65 (3) 56 (8) 20 (8) 65 (3) na na na 93 (5) 80 (12) DIA 1.15 111 (4) 69 (7) 77 (6) 92 (13) 101 (12) 100 (3) 110 85 (3) 82 (3) DEA 1.51 106 (4) 70 (7) 72 (16) 96 (6) 94 (16) 92 (6) 85 98 (1) 96 (14) BAM 0.77 82 (5) 92 (9) 87 (9) 87 (1) 80 (4) 100 (4) 90 100 (1) 96 (5) CLZ 1.14 91 (2) 90 (10) 89 (12) 75 (2) 76 (4) 81 (7) 85 94 (1) 88 (15) ATR 2.61 100 (8) 60 (12) 65 (17) 90 (1) 92 (1) 96 (2) 81 89 (7) 94 (5) ACETO 3.03 61 (13) 44 (6) 36 (9) 38 (15) 18 (3) 99 (9) 34 89 (8) 101 (8) METO 3.13 83 (9) 51 (6) 45 (6) 56 (3) 39 (6) 82 (14) 81 83 (3) 107 (5) 3 4 5 6 7 8 9 10 11 12 13 14 15 16 17 18 19 20 21 22 23 24 25 26 27 28 29 30 31 32 33 34 35 36 37 38 39 40 41 42 43 44 45 46 47 48 49 50 51 52 53 54 55 56 57 58 59 60
Analyst
Accepted
Manuscript
Published on 13 March 2019. Downloaded by Universitat de Barcelona on 3/13/2019 8:06:38 AM.
View Article Online DOI: 10.1039/C9AN00160C
Table 3. Scale-up of SPE procedure to large sample volumes. Mean recoveries (%) and RSDs (in parenthesis)
obtained on loading 5 or 10 L of tap or agricultural drainage water spiked with 0.5 to 500 µg of each analyte on cartridges containing 5 or 10 g of Sepra ZT, 5 or 10 g of SDB-1 or two layers of 8 g each sorbent. Replicated tests
were performed (n=2 to 9), except for 10 L drainage water at 5 µg L-1 with the layered cartridge, for which
unfortunately only one sample was available. na= for some of the tests, M-DPC was not added because the standard was not available when the tests were performed.
Extraction
material ZT (5 g)Sepra Sepra ZT (10 g) Bakerbond SDB-1 (10 g) Sepra ZT (8 g) + SDB-1 (8 g) Water
source
tap water
tap water tap water tap water drainage water
Volume 5 L 5 L 10 L 5 L 10 L 5 L 10 L 10 L 10 L 10 L 10 L Conc. (µg L-1) 0.1 (n=9) 0.1 (n=7) 0.1 (n=2) 0.1 (n=2) 0.1 (n=2) 0.1 (n=2) 0.1 (n=2) 0.1 (n=2) 1.0 (n=2) 5.0 (n=1) 50 (n=2) Recovery [%] (RSD) DPC 0 3 (126) 0 46 (28) 33 (20) 76 (17) (12)53 (30)24 (15)46 23 (25)24 M-DPC 35 (10) 92 (19) 95 (25) 100 (10) 92 (2) 90 (3) 100 (4) na na na na DIA 96 (15) 96 (13) 89 (4) 68 (7) 79 (3) 104 (9) (10)97 (14)35 (13)30 28 108 (2) DEA 81 (37) 99 (11) 104 (6) 71 (8) 93 (21) 92 (9) (16)109 105 (7) (17)98 97 108 (3) BAM 81 (49) 107 (9) 100 (5) 83 (9) 89 (5) (14)107 (22)90 111 (3) (10)104 114 (12)90 CLZ 101 (28) 102 (13) 113 (3) 101 (2) 97 (7) (10)91 (19)97 (11)92 (29)74 80 109 (6) ATR 103 (3) 108 (5) 112 (5) 94 (4) 101 (5) (16)109 (21)93 (10)95 (10)100 109 113 (4) ACETO 19 (20) 96 (12) 101 (14) 96 (9) 91 (25) 95 (8) 75 (14) 110 (4) 110 (17) 113 104 (4) METO 36 (14) 95 (4) 92 (1) 87 (8) 94 (12) 100 (17) 97 (17) 99 (14) 112 (5) 113 110 (1) 3 4 5 6 7 8 9 10 11 12 13 14 15 16 17 18 19 20 21 22 23 24 25 26 27 28 29 30 31 32 33 34 35 36 37 38 39 40 41 42 43 44 45 46 47 48 49 50 51 52 53 54 55 56 57 58 59 60
Analyst
Accepted
Manuscript
Published on 13 March 2019. Downloaded by Universitat de Barcelona on 3/13/2019 8:06:38 AM.
View Article Online DOI: 10.1039/C9AN00160C
Figure captions
Figure 1. Elution procedure optimization. Extraction efficiencies (mean recoveries, %) for the three different
elution procedures using Sepra ZT and Bakerbond SDB-1 0.2g-cartridges for 20-mL distilled water samples spiked
to 12.5 µg L-1 each analyte (25 µg L-1 for DPC). Error bars show RSDs (n=3). Herbicides are shown in the upper
panel and metabolites, in the lower panel.
Figure 2. Mass load effect. Extraction efficiencies (mean recoveries, %) of Sepra ZT 0.2g-cartridges for 20-mL
distilled water samples spiked with 0.02 to 0.5 µg each analyte. Cartridges were eluted with 3 mL EtAc. Error bars show RSDs (n=3).
Figure 3. Validation of the SPE-CSIA procedure for the determination of carbon isotope ratios of the target
compounds in 10-L drainage water samples (blue circles) spiked with 0.5 to 5 µg L-1 for ATR, ACETO and METO,
0.5 to 10 µg L-1 for DEA and BAM, and 0.5 to 50 µg L-1 for DPC. Results of the amount-dependence tests (red
circles) and EA/IRMS analysis of the standards (green lines) are also shown. The error bars indicate the standard
deviations of quadruplicate measurements. The dashed lines represent the interval of δ13C measured by
EA/IRMS ± 0.5‰. The molecular structure of the target analytes is also shown. For DPC, amplitude and not analyte concentration is shown because different injection volumes (10 to 100 µL) were used and thus there is not a straightforward correlation between injected C mass and DPC concentration.
Figure 4. Validation of the SPE-CSIA procedure for the determination of nitrogen isotope ratios of the target
compounds in 10-L drainage water samples (blue circles) spiked with 0.5 to 5 µg L-1 for ATR, ACETO and METO,
1.0 to 10 µg L-1 for DEA and BAM, and 1.0 to 20 µg L-1 for DPC. Results of the amount-dependence tests (red
circles) and EA/IRMS analysis of the standards (green lines) are also shown. The error bars indicate the standard
deviations of quadruplicate measurements (triplicate for DPC). The dashed lines represent the interval of δ15N
measured by EA/IRMS ± 1.0‰. The molecular structure of the target analytes is also shown.
3 4 5 6 7 8 9 10 11 12 13 14 15 16 17 18 19 20 21 22 23 24 25 26 27 28 29 30 31 32 33 34 35 36 37 38 39 40 41 42 43 44 45 46 47 48 49 50 51 52 53 54 55 56 57 58 59 60
Analyst
Accepted
Manuscript
Published on 13 March 2019. Downloaded by Universitat de Barcelona on 3/13/2019 8:06:38 AM.
View Article Online DOI: 10.1039/C9AN00160C
EtAc MeOH EtAc
+MeOH EtAc MeOH
re co ve ry (% ) re co ve ry (% )
CLZ ATR ACETO METO
M-DPC DPC DIA DEA BAM
Figure 1
EtAc +MeOH 0 20 40 60 80 100 120 140 0 20 40 60 80 100 120 140 Sepra ZT Sepra ZT SDB-1 SDB-1 3 4 5 6 7 8 9 10 11 12 13 14 15 16 17 18 19 20 21 22 23 24 25 26 27 28 29 30 31 32 33 34 35 36 37 38 39 40 41 42 43 44 45 46 47 48 49 50 51 52 53 54 55 56 57 58 59 60Analyst
Accepted
Manuscript
Published on 13 March 2019. Downloaded by Universitat de Barcelona on 3/13/2019 8:06:38 AM.
View Article Online DOI: 10.1039/C9AN00160C
re co ve ry (% )
Figure 2
DPC M-DPC DIA DEA BAM CLZ ATR ACETO METO 0 20 40 60 80 100 120 0.5 µg 0.25 µg 0.125 µg 0.02 µg 3 4 5 6 7 8 9 10 11 12 13 14 15 16 17 18 19 20 21 22 23 24 25 26 27 28 29 30 31 32 33 34 35 36 37 38 39 40 41 42 43 44 45 46 47 48 49 50 51 52 53 54 55 56 57 58 59 60
Analyst
Accepted
Manuscript
Published on 13 March 2019. Downloaded by Universitat de Barcelona on 3/13/2019 8:06:38 AM.
View Article Online DOI: 10.1039/C9AN00160C
acetolochlor (mmol L-1) 0.0 0.5 1.0 1.5 -29 -28 -27 -26 -25 -24 -23 -22 -21 nmol C on column 0 5 10 15 20 atrazine (mmol L-1) 0.0 0.5 1.0 1.5 -32 -31 -30 -29 -28 -27 -26 -25 -24 nmol C on column 0 2 4 6 8 10 12 metolachlor (mmol L-1) 0.0 0.5 1.0 1.5 -32 -31 -30 -29 -28 -27 -26 -25 -24 nmol C on column 0 5 10 15 20 DEA (mmol L-1) 0.0 0.5 1.0 1.5 2.0 2.5 3.0 3.5 4.0 δ C (‰ ) -35 -34 -33 -32 -31 -30 -29 -28 -27 nmol C on column 0 5 10 15 20 25 BAM (mmol L-1) 0.0 0.5 1.0 1.5 2.0 2.5 3.0 3.5 4.0 -32 -31 -30 -29 -28 -27 -26 -25 -24 nmol C on column 0 5 10 15 20 25 DPC (amp 44, mV) 0 2000 4000 6000 8000 10000 -20 -19 -18 -17 -16 -15 -14 -13 -12 nmol C on column 0 20 40 60 80 100 120 140
standards spiked samples
EA-IRMS
Figure 3
13 δ C (‰ ) 13 N N N N N N N NHH N NHH C Cll C CHH33 C C H H33 C CHH33 C CHH33 C C H H33 N N O O C Cll O O C C H H33 N N C CHH33 O O O O C Cll C CHH33 C C H H33 C CHH33 N NHH N N N N H H22 C Cll O O C Cll C Cll N NHH22 O O N N N N N N N NHH22 N NHH C Cll C C H H33 C CHH33 3 4 5 6 7 8 9 10 11 12 13 14 15 16 17 18 19 20 21 22 23 24 25 26 27 28 29 30 31 32 33 34 35 36 37 38 39 40 41 42 43 44 45 46 47 48 49 50 51 52 53 54 55 56 57 58 59 60Analyst
Accepted
Manuscript
Published on 13 March 2019. Downloaded by Universitat de Barcelona on 3/13/2019 8:06:38 AM.
View Article Online DOI: 10.1039/C9AN00160C
acetolochlor (mmol L
δ N (‰
)
standards spiked samples
EA-IRMS
Figure 4
15 δ N (‰ ) 15 -1) 0.0 0.5 1.0 1.5 2.0 2.5 3.0 -5 -4 -3 -2 -10 1 2 3 4 5 nmol N on column 0 5 10 15 atrazine (mmol L-1) 0.0 0.5 1.0 1.5 2.0 2.5 3.0 -5 -4 -3 -2 -10 1 2 3 4 5 nmol N on column 0 10 20 30 40 50 60 70 metolachlor (mmol L-1) 0.0 0.5 1.0 1.5 2.0 2.5 3.0 -5 -4 -3 -2 -10 1 2 3 4 5 nmol N on column 0 5 10 15 DEA (mmol L-1) 0.0 0.5 1.0 1.5 2.0 2.5 3.0 3.5 4.0 -15 -14 -13 -12 -11 -10-9 -8 -7 -6 -5 nmol N on column 0 20 40 60 80 100 BAM (mmol L-1) 0.0 0.5 1.0 1.5 2.0 2.5 3.0 3.5 4.0 -12 -11 -10-9 -8 -7 -6 -5 -4 -3 -2 nmol N on column 0 5 10 15 20 25 DPC (mmol L-1) 0.0 0.5 1.0 1.5 2.0 -10 -9 -8 -7 -6 -5 -4 -3 -2 -10 nmol N on column 0 1 2 3 4 5 6 N N N N N N N NHH N NHH C Cll C CHH33 C C H H33 C CHH3 C CHH33 C C H H33 N N O O C Cll O O C C H H33 N N C CHH33 O O O O C Cll C CHH33 C C H H33 C CHH33 N NHH N N N N H H22 C Cll O O C Cll C Cll N NHH22 O O N N N N N N N NHH22 N NHH C Cll C C H H33 C CHH33 3 4 5 6 7 8 9 10 11 12 13 14 15 16 17 18 19 20 21 22 23 24 25 26 27 28 29 30 31 32 33 34 35 36 37 38 39 40 41 42 43 44 45 46 47 48 49 50 51 52 53 54 55 56 57 58 59 60Analyst
Accepted
Manuscript
Published on 13 March 2019. Downloaded by Universitat de Barcelona on 3/13/2019 8:06:38 AM.
View Article Online DOI: 10.1039/C9AN00160C
Graphical abstract
µg/L
mg/L
atrazine (mmol L-1, in the extract)
0.0 0.5 1.0 1.5 13C ( ‰ ) -32 -31 -30 -29 -28 -27 -26 -25 -24 nmol C on column 0 2 4 6 8 10 12 EA-IRMS standards (n=5) spiked samples (n=4)
We validated a SPE-CSIA method that allows analyzing isotope ratios of mixtures of pesticides that commonly occur together in environmental water samples
3 4 5 6 7 8 9 10 11 12 13 14 15 16 17 18 19 20 21 22 23 24 25 26 27 28 29 30 31 32 33 34 35 36 37 38 39 40 41 42 43 44 45 46 47 48 49 50 51 52 53 54 55 56 57 58 59 60
Analyst
Accepted
Manuscript
Published on 13 March 2019. Downloaded by Universitat de Barcelona on 3/13/2019 8:06:38 AM.
View Article Online DOI: 10.1039/C9AN00160C