Contents lists available atScienceDirect
Remote Sensing of Environment
journal homepage:www.elsevier.com/locate/rseSurface meltwater runoff on the Greenland ice sheet estimated from
remotely sensed supraglacial lake infilling rate
Kang Yang
a,b,∗, Laurence C. Smith
c,d,e, Xavier Fettweis
f, Colin J. Gleason
g, Yao Lu
a,b,
Manchun Li
a,baSchool of Geography and Ocean Science, Nanjing University, Nanjing ,210023, China
bJiangsu Provincial Key Laboratory of Geographic Information Science and Technology, Nanjing, 210023, China cInstitute at Brown for Environment and Society, Brown University, Providence, RI, 02912, USA
dDepartment of Earth, Environmental, and Planetary Sciences, Brown University, Providence, RI 02912, USA eDepartment of Geography, University of California, Los Angeles, CA 90095, USA
fDepartment of Geography, University of Liège, Liège 4000, Belgium
gDepartment of Civil and Environmental Engineering, University of Massachusetts, Amherst, MA 01002, USA
A R T I C L E I N F O Keywords:
Surface runoff Surface mass balance Supraglacial lake ArcticDEM Greenland ice sheet
A B S T R A C T :
Surface runoff constitutes a large percentage of Greenland Ice Sheet (GrIS) mass loss at present but is difficult to measure directly. This study provides a novel method to estimate surface runoff through remote sensing of supraglacial lake volumes. Because terminal, non-draining (consistently expanding during the melt season) lakes impound runoff from their surrounding contributing catchments, such changes reflect runoff produced within the catchment. To estimate supraglacial lake volumes, multi-temporal lake maps derived from Landsat-8 images are intersected with dry lake-bed topographic depressions (showing lake bathymetry) identified for two su-praglacial catchments (~10 km2) in southwestern GrIS, using high-resolution (2 m) ArcticDEMs. Intersecting remotely sensed lake shorelines with their underlying ice surface topography yields multi-temporal lake volume changes, which are then compared with cumulative runoff as simulated by four Surface Mass Balance (SMB) models (HIRHAM5, MAR3.6, RACMO2.3, and MERRA-2). Comparison of cumulative lake infilling with SMB simulations for these two lakes over the period 8–31 July 2015 indicates that SMB models overestimated surface runoff by 106 – 123%. These large offsets improved after early July, overestimating runoff by 40 – 55%. The runoff delay function incorporated into the MAR3.6 model improves simulation of early melt season runoff, signifying the importance of integrating meltwater routing schemes into SMB models for improved under-standing of Greenland supraglacial hydrology and surface mass balance.
1. Introduction
The Greenland Ice Sheet (GrIS) has been one of the most important contributors to global sea level rise in the last two decades (Shepherd and Wingham, 2007;van den Broeke et al., 2009;Hanna et al., 2013; Khan et al., 2015;Mouginot et al., 2019). Negative surface mass bal-ance (SMB) and associated surface runoff contribute 50–84% of the total GrIS mass loss and have received growing attention (Enderlin et al., 2014; van den Broeke et al., 2016). SMB models are the most advanced tools used to estimate ice surface runoff, and these models perform well to predict overall ice sheet mass loss (Vernon et al., 2013; Fettweis et al., 2017;Noël et al., 2018). However, estimating surface runoff from SMB models remains challenging because it requires par-titioning of SMB among several poorly constrained physical processes,
with the model variable “runoff” the residual of the sum of modeled melt production and rainfall minus modeled retention and refreezing (Mernild et al., 2011;Vernon et al., 2013;Shfaqat et al., 2015;Cullather et al., 2016;Smith et al., 2017). This residual runoff term thus contains cumulative uncertainties propagated from each process, with few direct observations of surface runoff on the ice sheet to validate it.
Physically, surface runoff represents excess liquid water generated mainly by ablation of the ice surface that is not refrozen or retained. It creates an extensive and complex supraglacial hydrologic drainage system (supraglacial catchments containing meltwater in snow/firn, rivers, lakes, crevasses, and moulins) on the ablation zone of the southwest GrIS each summer, including densely spaced supraglacial stream/river networks that are the dominant pathways for routing surface meltwater downstream on this part of the ice sheet (Lampkin
https://doi.org/10.1016/j.rse.2019.111459
Received 3 April 2019; Received in revised form 15 August 2019; Accepted 3 October 2019
∗Corresponding author. School of Geography and Ocean Science, Nanjing University, Nanjing, 210023, China. E-mail address:kangyang@nju.edu.cn(K. Yang).
0034-4257/ © 2019 Elsevier Inc. All rights reserved.
and VanderBerg, 2014;Poinar et al., 2015;Smith et al., 2015,2017; King et al., 2016;Yang and Smith, 2016;Yang et al., 2016). All of these hydrologic features are indicative of surface runoff processes including lateral transport, meltwater impoundment in lakes, and surface-to-bed connections via moulins (Andrews et al., 2014;Banwell et al., 2016; Irvine-Fynn and Hubbard, 2016;Pope et al., 2016;Cooper et al., 2018; Flowers, 2018;Hoffman et al., 2018; Koziol and Arnold, 2018;Yang et al., 2018;Pitcher and Smith, 2019).
A growing availability of high-resolution imagery and topographic data is enabling study of these hydrological features in detail.Noh and Howat (2015) used stereo panchromatic WorldView (WV) images (0.5 m resolution) to build 2 m resolution digital elevation models (DEMs) covering the entire GrIS.Yang and Smith (2013)employed 2 m resolution WV imagery to map specific supraglacial stream/river net-works in the southwest GrIS.Pope et al. (2016)used high-resolution DEMs and multi-spectral satellite images to estimate supraglacial lake depths. Linking high-resolution observations of supraglacial hydro-logical features with SMB models, however, is still limited.Smith et al. (2017)presented a novel way to combine field measurements of dis-charge in a large supraglacial river with high-resolution satellite map-ping of upstream runoff-contributing catchment area for the purpose of validating SMB-derived surface runoff (hereafter SMB runoff). During this particular experiment four SMB models were found to overestimate total measured surface runoff by 21–58%. However, this study was for a single location on the ice sheet with a short (72 consecutive hours) investigation period. It required difficult and costly logistic support and would be a prohibitive approach for pan-Greenland estimation of runoff. Development of simpler, remote-sensing approaches to estimate runoff is needed to study GrIS surface runoff over large areas and throughout the melt season.
One such approach might track meltwater storage in supraglacial lakes, which are widely distributed on the ice sheet and can store large volumes of runoff each summer (McMillan et al., 2007;Sundal et al.,
2009; Selmes et al., 2011; Liang et al., 2012; Yang et al., 2015; Moussavi et al., 2016;Pope et al., 2016;Williamson et al., 2018). GrIS supraglacial lakes may be classified into two types based on their connections with supraglacial rivers (Tedesco et al., 2013), namely, those that have observed outflow channels, termed “pathway” lakes, and those that do not, termed “terminal” lakes (Yang et al., 2015). The former provide little impedance to meltwater flow across the ice sheet (Smith et al., 2015), whereas the latter act as surface storage im-poundments on the ice surface (Fitzpatrick et al., 2014). If a terminal lake is empty at the beginning of a melt season (due to slow or rapid drainage in the previous melt season (Tedesco et al., 2013)), the meltwater volume stored in a terminal lake can represent the runoff produced in its upstream contributing catchment area. Additionally, bathymetries of topographical depressions that host those supraglacial lakes are reported stable over time (Banwell et al., 2012;Arnold et al., 2014;Pope et al., 2016). Consequently, ice surface runoff can be di-rectly quantified by accurately estimating the change in volume of terminal supraglacial lakes.
Finding such suitable terminal supraglacial lakes for this purpose is nontrivial. First, during a melt season, a supraglacial lake may change from terminal to a pathway due to overspilling (Banwell et al., 2012; Arnold et al., 2014), or the surface meltwater may be routed down-stream even prior to overspilling via thermal incision of an outflow meltwater channel (Hoffman et al., 2011;Tedesco et al., 2013;Smith et al., 2015;Yang et al., 2015;Yang and Smith, 2016). Second, terminal lakes are prone to draining due to hydro-fracture in response to melt-water mass loading (Catania et al., 2008;Catania and Neumann, 2010) or to ice dynamics caused by nearby moulin-induced meltwater deli-vering into the ice sheet (Stevens et al., 2015), impacting ice dynamics (Tedesco et al., 2013;Clason et al., 2015;Hoffman et al., 2018). Third, non-draining supraglacial lakes commonly impound meltwater from previous years (Arnold et al., 2014;Koenig et al., 2015), thus compli-cating the use of lake storage volume to estimate runoff.
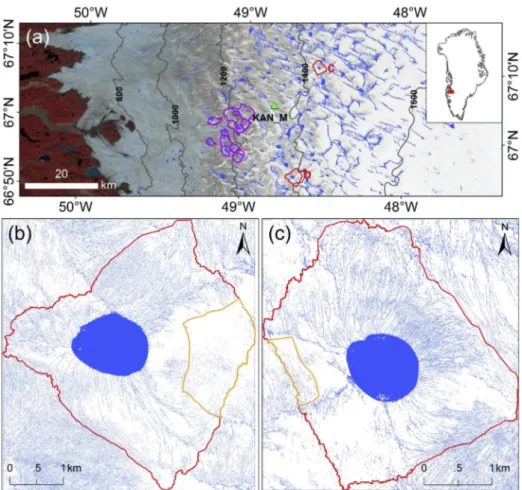
Fig. 1. (a) Landsat-8 image (acquired on DOY 189, 8 July 2015, R5G4B3) of supraglacial lake 1 (SL1) and supraglacial lake 2 (SL2) in the southwest Greenland Ice Sheet. Supraglacial lakes and rivers (in blue) are delineated and overlaid on the Landsat-8 image. Purple line shows the catchment boundaries of the 13 supraglacial lakes used to quantify the SMB runoff on DOY 182. (b) and (c) show supraglacial catchment 1 and 2 in detail. High-resolution supraglacial lakes and rivers (in blue) are delineated from WorldView-2 imagery. Catchment (in red line) and crevasse-field (in yellow line) boundaries are extracted to quantify the surface runoff contributing area of the two supraglacial lakes. (For interpretation of the refer-ences to colour in this figure legend, the reader is referred to the Web version of this article.)
To circumvent these challenges, this paper develops a methodology to: (1) find non-draining terminal lakes that are empty at the beginning of a melt season and consistently fill with surface meltwater runoff during the melt season; (2) estimate multi-temporal lake volumes by intersecting high-resolution satellite imagery with DEMs; (3) compare remotely-sensed infilling of these lake volumes with SMB runoff to in-dependently test the accuracy of SMB models; and (4) discuss how to better parameterize runoff in SMB models.
2. Study sites
Each summer, numerous supraglacial lakes form on the ablation
zone of the southwest GrIS (Box and Ski, 2007;McMillan et al., 2007; Sneed and Hamilton, 2007; Sundal et al., 2009;Selmes et al., 2011; Liang et al., 2012;Fitzpatrick et al., 2014;Leeson et al., 2015;Moussavi et al., 2016;Pope et al., 2016;Yang and Smith, 2016;Williamson et al., 2017). In this area, out of ~400 supraglacial lakes examined (Yang et al., 2015) we found two terminal supraglacial lakes that were empty at the beginning of the 2015 melt season and then filled and expanded from early June to late August (Fig. 1and2). Supraglacial lake 1 (SL1) is located at 66.896° N, 48.675° W, with a mean elevation of 1340 m, while supraglacial lake 2 (SL2) is located at 67.164° N, 48.553° W, with a mean elevation of 1409 m. Small, densely-spaced supraglacial streams drain meltwater into these two supraglacial lakes, forming two
Fig. 2. Multi-temporal Landsat-8 images (R5G4B3) captured during DOY (Day of Year) 189 – 212 (8–31 July), 2015, showing consistent expansion of two su-praglacial lakes and implying complete capture of surrounding runoff without losses to moulin drainage or lateral outflow over the 24 day observation period.
supraglacial lake catchments suitable for the purpose of surface runoff estimation. Moreover, 13 supraglacial lakes (elevation ~1200 m) were found expanding from DOY 180 to 182 so their volumes on DOY 182 can be used to estimate the cumulative runoff produced in the corre-sponding supraglacial catchments before DOY 182 (Fig. 1), furthering illustrating the applicability of the proposed method in a wide area on this part of the ice sheet.
3. Data and methods
3.1. Data sources
Six multi-temporal Landsat-8 Operational Land Imager (OLI) pan-chromatic images (spatial resolution 15 m) were acquired during the 2015 melt season for the two detailed lake study sites (Fig. 2and Table 1). One WorldView-2 image with both multi-spectral (2.0 m) and panchromatic (0.5 m) bands acquired on 24 July 2015 was used to map supraglacial lakes and stream/river networks in detail and to char-acterize lake catchment boundaries (Fig. 1).
ArcticDEMs (released by the Polar Geospatial Center, PGC) were used to delineate catchment boundaries and to estimate supraglacial lake volumes. This high-resolution (2 m) DEM product is made from WorldView stereo-image pairs and provides unprecedented accuracy for studying supraglacial hydrologic features on the GrIS surface (Noh and Howat, 2015,2017;Karlstrom and Yang, 2016;King et al., 2016; Yang et al., 2018). Validation of ArcticDEMs against IceBridge LiDAR point clouds reveals an RMSE of 3.8 m in the horizontal and 2.0 m in the vertical orientation (Noh and Howat, 2015, 2017). Multi-temporal ArcticDEMs of our two study sites are readily available from PGC and we used the 02 August 2014 ArcticDEM for SL1 and the 11 August 2011 for the SL2 for this study. These two supraglacial lake basins were empty prior to stereo-image acquisition and thus contained no im-pounded meltwater would have influenced lake volume calculations. Supraglacial lake (depression) bathymetries are mainly controlled by bedrock topography (Lampkin and VanderBerg, 2011; Igneczi et al., 2016) so the topographic depressions hosting SL1 and SL2 were as-sumed to be stable, followingBanwell et al. (2012)andArnold et al. (2014). To evaluate the impact of different ArcticDEMs on lake volume calculation, two additional ArcticDEMs, acquired on 20 August 2012 and 13 July 2016 respectively, were also used to calculate SL1 volume. As on 02 August 2014, the SL1 basin was empty on 20 August 2012, and contained only a very small lake (~0.1 km2) on 12 July 2016.
These detailed studies of SL1 and SL2 allow full understanding of our method over small catchments. To test the applicability of this method over larger areas (as we suggest this method can be ultimately used), a pre-drainage ArcticDEM was used to calculate supraglacial lake volume and to delineate upstream supraglacial catchment boundaries for the 13 supraglacial lakes (Fig. 1). Two Landsat-8 OLI images were acquired on DOY 180 and 182 for these lakes to test the applicability of the method there (Table 1).
Daily simulations of GrIS meltwater runoff over the 2015 melt season were generated using four state-of-the-art SMB models, i.e., HIRHAM5, MAR3.6, RACMO2.3, and MERRA-2 models used inSmith et al. (2017). To improve comparisons among these models, their out-puts of SMB runoff were reprojected to a common 5 km posting and map projection (i.e. to that of MAR) using nearest neighbor resampling. Detailed descriptions of these SMB models and reprojections are pro-vided inSmith et al. (2017).
3.2. Supraglacial lake and river detection
Supraglacial lakes were delineated using a simple, two-step global and local segmentation method (Yang et al., 2015) applied to the entire raw Landsat-8 and WV2 panchromatic images. A global threshold was set to segment each Landsat-8 or WV2 image to generate initial lake boundaries. Each initial lake boundary was expanded to generate a buffered region and the OTSU method (Otsu, 1979) was used to adaptively classify these buffered regions to yield binary supraglacial lake masks. Floating ice (Fig. 2) was ignored and lake areas thus reflect a continuous polygon within their boundaries. Supraglacial streams and rivers were also delineated from the WV2 panchromatic images using a Gabor filter to enhance cross sections and using path opening to lengthen the river channel continuity (Yang et al., 2017). Then, we used manually determined rectangle extents to extract lakes and rivers in the two catchments (Fig. 1) and focused on those lakes and rivers. As be-fore, these detailed catchments provide a platform for method devel-opment, and we then apply the method at 13 other application lakes. 3.3. Supraglacial lake catchment delineation.
Supraglacial lake catchment boundaries were extracted from entire ArcticDEMs as perKarlstrom and Yang (2016). First, the ArcticDEM was filled to create a sink-free DEM, which was then subtracted from the original DEM to create a depression raster. Second, topographic
Table 1
Remotely sensed datasets used in this study.
Dataset type ID Spatial
resolution Acquisitiondates Purpose WorldView-2
satellite imagery
WV0220150724155445 0.5 m &
2.0 m 18 July 2015 Map supraglacial hydrologic features(supraglacial rivers and lakes) in detail, and assist ice surface catchment boundary delineation WV0220150724155449
Landsat-8 OLI satellite imagery
LC80080132015180LGN00 15 m & 30 m 29 June 2015 Extract supraglacial lake boundaries using the 15 m panchromatic band and map snow cover using 30 m NIR band LC80060132015182LGN00 01 July 2015 LC80070132015189LGN00 08 July 2015 LC80050132015191LGN00 10 July 2015 LC80080132015196LGN00 15 July 2015 LC80060132015198LGN00 17 July 2015 LC80070132015205LGN01 24 July 2015 LC80080132015212LGN00 31 July 2015
ArcticDEM SETSM_WV01_20150418_102001003DE77900_102001003C095500_seg1_2m_v2.0 2.0 m 18 April 2015 Delineate supraglacial catchment boundaries, and extract topographic depressions SETSM_WV03_20160713_104001001F933000_104001001F314E00_seg1_2m_v2.0 13 July 2016 SETSM_W2W2_20140802_103001003457AF00_1030010035AE7A00_seg1_2m_v2.0 2 August 2014 SETSM_WV01_20120820_102001001C65C400_102001001D8D2D00_seg1_2m_v2.0 20 August 2012 SETSM_WV01_20110821_10200100152A5E00_1020010015158C00_seg1_2m_v2.0 21 August 2011
depressions that contain terminal lakes were used as outlets to detect supraglacial catchment boundaries and all the other depressions were filled following Karlstrom and Yang (2016). Third, from the high-re-solution supraglacial river networks mapped from WorldView-2 images (Fig. 1), we determined that surface meltwater in the two catchments is continuously routed to the two terminal lakes without draining into the ice sheet. Therefore, the resultant catchment boundaries indicate the upstream runoff contributing areas for our terminal lakes. During the melt season, small moulins may form (Hoffman et al., 2018) and drain meltwater locally into the ice sheet and thus reduce the amount of meltwater entering lakes and the associated meltwater contributing areas of terminal lakes. However, Smith et al. (2017)show that con-tributing areas for these small moulins are limited (~2.5% of the total catchment area) and thereby can be safely neglected.
Supraglacial stream/river networks delineated from the 0.5 m WV2 panchromatic image were used as reference data to further constrain supraglacial lake catchment boundaries. We followed Smith et al. (2017)to create the maximum topographic catchment boundaries from ArcticDEMs, manually adjusted for small areas of river piracy near catchment boundaries. To constrain the minimum catchment bound-aries, we eliminated crevasse fields from the maximum boundaries as perSmith et al. (2017). The crevasse fields were determined visually as areas exhibiting parallel, semi-linear sets of water-filled fractures, un-drained by actively flowing supraglacial streams (Fig. 1). For the 13 application lakes and their corresponding upstream catchments, cre-vasse fields were not eliminated due to lack of high-resolution WV images.
3.4. Supraglacial lake volume calculation
High-resolution post-drainage ArcticDEMs provide unprecedented accuracy to estimate the volume of supraglacial lakes via measurement of topographic depressions that host them (Moussavi et al., 2016;Pope et al., 2016). Two topographic depressions that contain the two term-inal lakes were extracted from the depression raster using two rectangle extents (Fig. 3) and the value of each pixel indicates its depth from the depression outer boundary (i.e. maximum potential supraglacial lake extent, as determined by ice surface topography). The Landsat-8 mapped supraglacial lake shorelines were then intersected with the depression raster as perMoussavi et al. (2016)andPope et al. (2016). Ideally, a remotely sensed lake shoreline coincides with a depression depth contour. However, due to limitations in DEM accuracy the re-sultant depths can vary along the lake shoreline, inducing uncertainties (Pope et al., 2016). As such, we used the mean ± one standard
deviation depth along the lake shoreline to constrain our supraglacial lake volume estimates. For a sealed terminal supraglacial lake, its vo-lume at a given date indicates the total amount runoff that has been accumulated since the melt season started. The resultant satellite lake volume derived runoff (hereafter SLV runoff) was used to evaluate the performances of SMB models.
3.5. SMB runoff calculation
Four SMB models, HIRHAM5 (Christensen et al., 2006), MAR3.6 (Fettweis et al., 2017), RACMO2.3 (Van Meijgaard et al., 2008), and MERRA-2 (Bosilovich et al., 2016) were used to estimate daily SMB runoff produced in the two supraglacial lake catchments during the 2015 melt season (from 1 June to 31 August 2015). These models are all state-of-the-art regional climate models (HIRHAM5, MAR3.6, RACMO2.3) or climate reanalysis (MERRA-2) widely used in Greenland SMB estimations (Vernon et al., 2013;Cullather et al., 2016). For each supraglacial lake catchment, total SMB runoff within each catchment was obtained by clipping SMB grid cells (5 km × 5 km) with the catchment polygon boundary and summing their values (Pitcher et al., 2016). SMB runoff estimates were derived for all four models and compared with contemporaneous supraglacial lake volumes.
MAR3.6 is the only SMB model examined here that incorporates a runoff delay function to distribute runoff over time (Cullather et al., 2016;Smith et al., 2017;van As et al., 2017). This delay function was originally proposed byZuo and Oerlemans (1996)based on the idea that surface meltwater is likely transported faster when the overall ice surface slope is larger. The resultant SMB runoff is termed “MAR3.6-delayed runoff” in this study. To enable comparison of MAR3.6 “MAR3.6-delayed SMB runoff directly with non-delayed SMB runoff from the other SMB models, we calculated the MAR3.6 non-delayed runoff directly from MAR3.6 variables (runoff = melt + rainfall – refreeze – retention) as pervan den Broeke et al. (2009).3.6 Snow mapping and albedo derivation. To better illustrate the supraglacial hydrological condition of the study area, snow surface was also delineated from multi-temporal Landsat-8 images. The mixture of snow and ice across the ice surface determines runoff melt rates and local albedo, which ultimately con-trols the driving shortwave energy balance. The Landsat-8 NIR band can distinguish snow from bare ice and meltwater (Ryan et al., 2019) so we used manually determined global thresholds to extract snow sur-faces from multi-temporal Landsat-8 images and to calculate snow cover fractions (calculated as snow surface area/total catchment area). The SMB models produce albedo directly, and albedo observed from the PROM-ICE KAN_M station was used as reference data for validation.
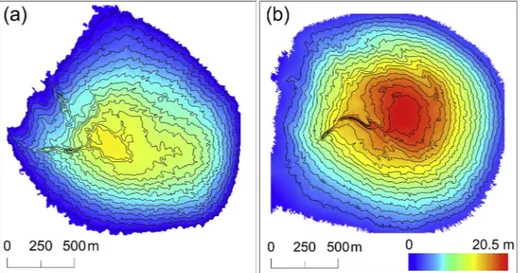
Fig. 3. Topographic depressions extracted from ArcticDEMs for (a) supraglacial lake 1 (SL1) and (b) supraglacial lake 2 (SL2). One meter depth contour (in black lines) are overlaid on the extracted topographic depressions.
The KAN_M station is located at 67.0670ºN, 48.8355ºW, with an ele-vation of 1270 m and ~20 km away from the two catchments (Fig. 1). Moreover, we combined ice and snow albedos by averaging over the horizontal coverage mapped from Landsat-8 satellite images to calcu-late a remotely sensed ‘mixed’ albedo:
= +
albedo albedo snow cover fraction albedo (1 snow cover fraction)
ice snow snow ice
(1) where albedosnowis 0.75 and albedoiceis 0.45.
4. Results
4.1. Mapping of supraglacial lake catchment and volume
Supraglacial lakes SL1 and SL2 both expanded between DOY 189 (8 July) and DOY 212 (31 July), 2015, indicating runoff impoundment in the two lake catchments over this 24 day period (Fig. 2). The area of SL1 increased from 0.6 km2on DOY 189 to 1.2 km2on DOY 212, and the area of SL2 increased from 0.4 km2to 0.8 km2over the same period. The maximum and minimum bounds of catchment 1 are 12.9 km2and 11.0 km2 for SL1 and 9.1 km2 and 8.8 km2 for SL2, respectively. As such, these two catchment areas are typical of supraglacial catchments on this part of the ice sheet (~10 km2,Yang and Smith (2016)). On DOY 205 (24 July), the total stream/river length of catchment 1 is 443.9 km, yielding a drainage density of Dd= 34.4 km/km2, while the
corre-sponding values for catchment 2 are 419.4 km and 46.1 km/km2 re-spectively. The average stream/river width is 2.5 ± 1.2 m in catch-ment 1 and 3.0 ± 1.6 m in catchcatch-ment 2. The maximum depths of the two topographic depressions that host SL1 and SL2 are 14.7 m (calcu-lated from the 02 August 2014 ArcticDEM) and 20.5 m (Fig. 3).
Three ArcticDEMs perform similarly in estimating SL1 volumes (Fig. 4), indicating that the bathymetry of this lake's topographical depression remained stable over the period 2012–2016. The mean SL1 volume difference between 20 August 2012 and 2 August 2014
ArcticDEMs is +4.7%, while the difference between 13 July 2016 and 2 August 2014 ArcticDEMs is −12.8%. The SL1 basin was empty on 20 August 2012 and 2 August 2014 so both ArcticDEMs captured the full SL1 lake bathymetry accurately. The SL1 basin was occupied by a very small lake (~0.1 km2) on 12 July 2016 causing the 13 July 2016 ArcticDEM to slightly underestimate lake volume. This result supports the previous finding that supraglacial topographical divides are stable and high-resolution DEMs can confidently be used to estimate lake volumes (Banwell et al., 2012; Arnold et al., 2014; Moussavi et al., 2016;Pope et al., 2016;Smith et al., 2017).
4.2. Comparison of remotely sensed supraglacial lake volume with cumulative SMB runoff
Supraglacial lake volumes (i.e. SLV runoff) show that the four SMB models (i.e., MAR3.6 non-delayed, HIRHAM5, RACMO2.3 and MERRA-2) all significantly overestimates surface runoff (Fig. 4,Table 2). By the end of July (DOY 212), the four SMB model runs overestimate cumu-lative runoff by 69.8 – 151.7% for catchment 1, and 89.9 – 122.4% for catchment 2, supporting the suggestion that SMB models are likely to overestimate actual meltwater runoff produced on the ice sheet surface (Smith et al., 2017). Most of the overestimations can be attributed to the cumulative SMB- runoff before DOY 189 (8 July). During July (DOY 189 – 212), the corresponding overestimation decreases considerably to 15.0 – 81.8% for catchment 1 and 21.4 – 61.1% for catchment 2 (Fig. S1). This finding suggests that the SMB models perform better during middle and late July, when runoff is likely to be higher, than early July when the runoff is likely to be less.
Among the four SMB model runs, MERRA-2 performs best in mod-eling surface runoff for both catchments (Fig. 4, Table 2), consistent withSmith et al. (2017). After DOY 189, MERRA overestimates SLV runoff by < 25%. On average across these four model runs, runoff is overestimated by 54.6% for catchment 1 and 39.6% for catchment 2 after DOY 189, comparable to the 21.0 – 58.0% overestimation derived from supraglacial river discharge measurements during DOY 201 – 203 (Smith et al., 2017).
In addition to cumulative SLV runoff, the performance of SMB models can also be evaluated by the SLV infilling rate. All four SMB model runs successfully captured the decreasing trend of surface runoff rate at the two catchments, with the mean rate of ~10 mm/day (Fig. 5). MERRA-2 performs best at modelling runoff rate and its variations, while HIRHAM5 also performs well over catchment 2.
The SMB vs. SLV runoff comparison for the 13 application lakes shows that SMB models significantly overestimate surface runoff before DOY 182 (Fig. 6). On average across these four model runs, runoff is overestimated for the 13 application lakes by 439.7%Table 3, higher than the corresponding values for supraglacial lake 1 and 2 on DOY 189 (374.6% and 405.0%, respectively). Among the four SMB model runs, MERRA-2 performs best in modeling surface runoff for the 13 appli-cation lakes as well (Fig. 6,Table 3).
4.3. MAR3.6 delayed vs. non-delayed runoff simulations
The MAR3.6 delayed runoff is very different from SMB runoff ob-tained from the other four SMB model runs (Figs. 4and5). By the end of July (DOY 212), the MAR3.6 delayed runoff performs better than all other SMB runoffs, only overestimating runoff by 67.3% for catchment 1 and 15.7% for catchment 2. We assert that this good performance is mainly due to the model's ability to distribute runoff temporally before DOY 189. Similar results are found for the 13 application lakes: among the five model runs (MAR3.6 non-delayed, MAR3.6 delayed, HIRHAM5, RACMO2.3, and MERRA-2), the MAR3.6 delayed run performs best to simulate cumulative surface runoff on DOY 182, yielding an average overestimation of 48.3%.
Despite this encouraging performance, the MAR3.6 delayed runoff overestimations increase substantially during July (DOY 189 – 212)
Fig. 4. Satellite lake volume derived runoff (SLV runoff) and SMB-derived surface runoff (SMB runoff) produced in (a) catchment 1 and (b) catchment 2 during DOY 189 – 212 (8 – 31 July) 2015.
(Fig. S1, Table 2). Moreover, the MAR3.6 delayed runoff does not capture the decreasing trend of runoff rate compared to the other four model runs, and produces a relatively static runoff rate for both catchments (i.e., ~20 mm/day for catchment 1 and ~15 mm/day for catchment 2) during DOY 189 – 212 (Fig. 5). This finding suggests that the MAR3.6 delay function does not perform well after early July.
The MAR delay function distributes meltwater temporally over the entire melt season, i.e., considerable volumes of surface meltwater are delayed and gradually released in August. At the end of July, the two versions of MAR do not produce the same cumulative runoff (Fig. 7). For catchment 2, meltwater is delayed more significantly than for the catchment 1 so the modeled runoff better matches the SLV runoff. At the end of September 2015 (DOY 273), the delayed runoff is sig-nificantly smaller than the non-delayed runoff. The good performance of runoff delay function (before early July) and the significant differ-ence between delayed and non-delayed runoffs suggest that: first, a runoff delay function should be integrated into SMB models; and second, this runoff delay function should be better designed and its performance should be better validated using remotely sensed or field observations.
4.4. Snow mapping and analysis
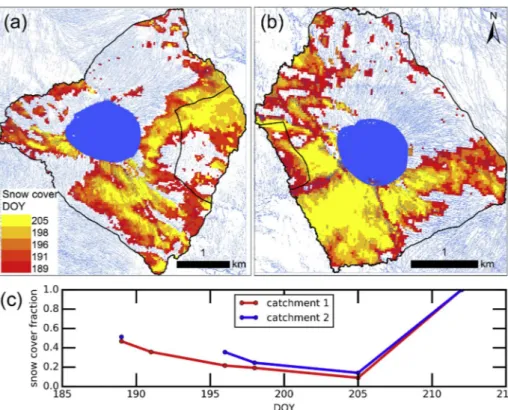
Bright snow surface can be well delineated from the multi-temporal Landsat-8 images for the two supraglacial lake catchments (Fig. 8). Snow surfaces in the two catchments gradually disappear from DOY 189 to DOY 205 (Fig. 9) and the snow cover fractions decrease from ~0.5 to ~0.2. On DOY 212, however, a fresh snowfall covers the ice surface (Fig. 8) and the snow cover fraction increases to 1.0 in both catchments (Fig. 9).
Albedo variables derived from the four models show that except for RACMO2.3, the other three models simulate the decreasing trend of albedo reasonably well, which implies that the SMB models successfully capture the snow-to-ice transition in the two catchments during July 2015. Moreover, all the SMB models capture a sharp albedo increase after DOY 205, which is consistent with the KAN_M observation and the Landsat-8 snow cover mapping, indicating a fresh snowfall during that period (Fig. 10). Therefore, the SMB models simulate a snow surface
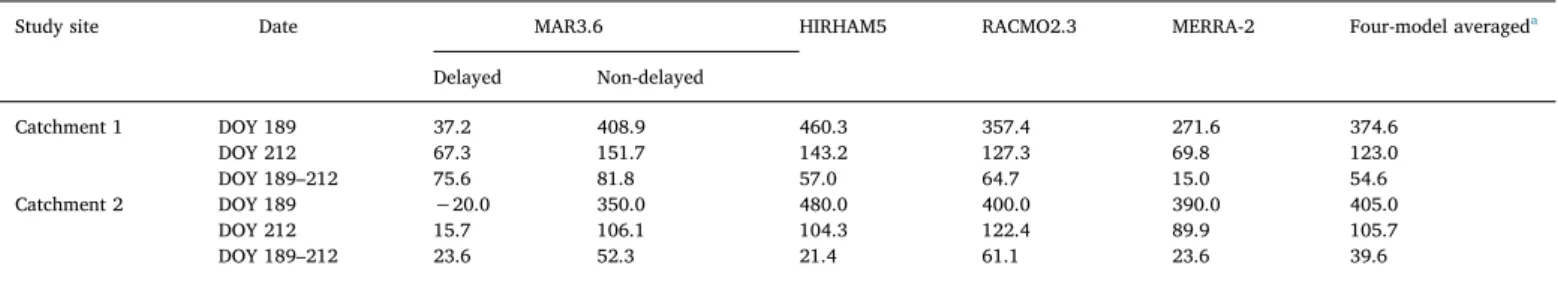
Table 2
Overestimation (unit: %) of SMB runoffs compared to SLV runoffs in two supraglacial catchments during DOY 189 – 212, 2015.
Study site Date MAR3.6 HIRHAM5 RACMO2.3 MERRA-2 Four-model averageda
Delayed Non-delayed Catchment 1 DOY 189 37.2 408.9 460.3 357.4 271.6 374.6 DOY 212 67.3 151.7 143.2 127.3 69.8 123.0 DOY 189–212 75.6 81.8 57.0 64.7 15.0 54.6 Catchment 2 DOY 189 −20.0 350.0 480.0 400.0 390.0 405.0 DOY 212 15.7 106.1 104.3 122.4 89.9 105.7 DOY 189–212 23.6 52.3 21.4 61.1 23.6 39.6
a The MAR3.6 non-delayed runoff is used to calculate the four-model (MAR3.6, HIRHAM5, RACMO2.3, MERRA-2) averaged runoff over-estimation.
Fig. 5. SLV runoff and SMB runoff rate (mm/day) in (a) catchment 1 and (b) catchment 2 during DOY 189 – 212 (8 – 31 July) 2015.
Fig. 6. Comparison of SLV runoff with SMB runoff on DOY 182 for 13 su-praglacial lakes, indicating that SMB models significantly overestimate surface runoff during the early melt season.
Table 3
Overestimation of SMB vs. SLV runoff for 13 supraglacial lakes on DOY 182
SMB model Overestimation (%)
maximum minimum mean std MAR3.6 delayed 286.0 -49.8 48.3 103.4 MAR3.6 non-delayed 1390.5 93.3 461.9 401.2 HIRHAM5 1315.9 82.3 480.3 363.1 RACM02.3 1684.6 97.3 603.1 457.2 MERRA-2 684.3 -22.3 213.6 197.8
gradually melting to reveal an ice surface and the discrepancies be-tween the modeled runoff and measured runoff should be attributed to some other processes, such as meltwater retention.
5. Discussion
5.1. Implications of SMB runoff overestimation
In SMB models, melt and refreezing fundamentally determine runoff as the residual of these climatic variables (Cullather et al., 2016;Smith et al., 2017). Overestimation of SMB runoff, therefore, can be attributed to overestimation of melt, underestimation of refreezing, or a combi-nation of both (Smith et al., 2017). Further quantitative partition of these two effects is challenging and outside of the scope of this study. However, some useful results are revealed by the temporal variations of SMB runoff overestimations quantified in this study. We find that SMB runoff overestimation is highest before early July (Table 2), and it is known that large portions of surface meltwater percolate into and warm the snowpack before early July (Irvine-Fynn and Hubbard, 2016). It is plausible that the SMB models underestimate the volumes of meltwater retention through percolation thereby substantially overestimating the amount of laterally transported surface runoff flowing off of the ice sheet surface. After early July, no or very limited retention is modeled by the SMB models causing a general improvement in the performance of SMB- runoff relative to remotely sensed observations of supraglacial lake infilling rate (Table 2). We remind readers that SMB models si-mulated a snowpack evolution and snow fall reasonably well, so dif-ferences in measured and modeled runoff are likely not a result of snowmelt processes and should be attributed to other surface pro-cesses.5.2 Implications for parameterization of runoff in SMB models.
The runoff delay function incorporated in the MAR3.6 model fun-damentally changes temporal runoff distribution.Zuo and Oerlemans (1996)first proposed the runoff delay function on the basis that surface meltwater likely reaches the supraglacial rivers quicker when the general surface slope is larger: t* = c1+ c2exp(-c3S), where t* is the runoff delay (i.e., time required to drain away meltwater), S is ice surface slope, and c1, c2, and c3 are three coefficients. These three empirical coefficients were calibrated for the delay function by using albedo observations on the ice surface and were determined as 1.5, 25, and 140, respectively (Zuo and Oerlemans, 1996).Lefebre et al. (2003) updated these coefficients to 0.33, 25, and 140 to route meltwater more quickly. The mean slope of the MAR3.6 cell covering catchments 1 and 2 are 0.0106 and 0.0090, respectively. Therefore, for catchments 1 and 2, the resultant MAR3.6 runoff delays are, respectively, 7 and 9 days based onZuo and Oerlemans (1996)and 6 and 7 days based onLefebre
et al. (2003). The non-delayed MAR3.6 model overestimates runoff before early July, similar to the other SMB models (Fig. 4). With the delay function incorporated, the MAR3.6 runoff is delayed temporally (van As et al., 2017) thus decreasing SMB runoff values and inducing better match with the SLV runoff before early July (Fig. 4). However, the delayed runoff is then consistently released throughout the rest of the melt season (Zuo and Oerlemans, 1996;Lefebre et al., 2003;van As et al., 2017) and thereby the cumulative runoff increases at a much higher rate than the measure values, causing large runoff over-estimations after early July (Figs. 5and6).
The runoff delay function performs differently at the two study sites. Before early July, the 7-day runoff delay is too short and the runoff is released too quickly at catchment 1, whereas the 9-day runoff delay is too long and the runoff is released too slowly at catchment 2. As such, the MAR3.6 delayed simulations overestimate runoff at catchment 1 but underestimate runoff at catchment 2 before early July. Unfortunately, it is difficult to evaluate the performance of the runoff delay function after early July because the corresponding runoffs are mixed by the delayed and the present runoffs.
Overall, we suggest that the delay function offers the MAR3.6 model several advantages in runoff modeling and comparisons of this delayed runoff with the measured runoff may raise prospects for integrating meltwater routing schemes into the SMB models in future. Several lumped or distributed models have been proposed to route surface meltwater on the snow or ice surface (Arnold et al., 1998;Willis et al., 2002;Leeson et al., 2012,2014;Clason et al., 2015;Yang et al., 2018). In future, these models can be coupled to SMB models to build better runoff delay functions and eventually to better parameterize surface runoff. The main challenge is to bridge the spatial scale difference be-tween SMB grid cells and supraglacial catchments and to reasonably assign meltwater routing parameters (e.g., Manning's n coefficient, meltwater routing velocities, direct hydrographs, and outlet points) to SMB grid cells.
5.2. Implications for supraglacial meltwater balance
We have shown severe overestimation of melt from these SMB models, but we should interrogate potential physical sources of over-estimation in our method. One such mechanism is evaporation- direct loss of water from the lake surfaces that is not captured in the SLV but is in the SMB, which would lead to apparent overestimation. Directly estimating evaporative loss from the supraglacial lake surface is chal-lenging as there are no field-measured values to apply. However, we suggest that the typical value for the evaporation above open ocean close to Greenland simulated by MAR in summer is ~1 mm/day. We
assume this value is transferrable to the open water on the ice surface so we have conducted a simple experiment to estimate evaporative loss from the supraglacial lake surface. The evaporative loss volume (km3/ day) from the lake surface is calculated as “maximum lake area * evaporative loss rate” to reveal the maximum potential contribution of evaporative loss from the lake surface for the catchment runoff esti-mation. The result shows that evaporative loss volume for both catch-ments are ~1 × 10⁻⁶km3/day, two orders of magnitude lower than the supraglacial lake volume infilling rate (~1 × 10⁻⁴km3/day). Therefore, evaporation is not a likely cause of our observed discrepancy between SMB and SLV runoff.
Another mechanism for apparent overestimation is lake bottom melting. As a lake melts into its substrate, the lake gets deeper and the outer lake boundary will shrink if no meltwater is routed into the lake. This will lead to a decline in the lake volume quantified from satellite mapped lake boundary and DEM topographical depression. This effect will lead to an underestimation of SLV runoff, similar to the evaporative loss from the lake surface.Tedesco et al. (2012)found that the mea-sured ablation rate at the bottom of supraglacial lakes is two times larger than that of bare ice of surrounding areas. In our study, the daily runoff in our two catchments is ~10 mm/day. Therefore, the meltwater production caused by lake bottom melting can be assumed to be
Fig. 8. Snow cover in the two catchments extracted from multi-temporal Landsat-8 images, showing snow gradually disappeared from DOY 189 to 205. On DOY 212, a fresh snowfall covered the ice surface.
~20 mm/day. The density difference between ice and meltwater is 0.1 g/cm3, one tenth of meltwater. Therefore, if the lake area is ~1 km2 and a hemisphere lake shape is assumed, meltwater volume loss in-duced by bottom melting is 3.6 mm/day (3.6 × 10⁻⁶km3/day when water rates are converted to volume fluxes) and can be safely neglected, similar to the evaporative loss from the lake surface.5.4 Limitations and future opportunities.
Limitations of the supraglacial lake volume (SLV) method present here are that the ablation of supraglacial lake bottoms is not included in runoff estimations and that some parts of the meltwater runoff likely evaporates or percolate into the ice sheet before reaching the su-praglacial lake.Tedesco et al. (2012)reported that the measured ab-lation rates at the bottom of two supraglacial lakes are two times larger than the bare ice of surrounding areas. This suggests that a portion of measured lake volumes is attributed to bottom melt rather than catchment surface runoff. As a result, the actual surface runoff is even smaller than the volume of supraglacial lakes, further enlarging the offsets between observations and models if we assume that the melt-water produced upstream reaches the supraglacial lakes. We suggest modeling or observing lake bottom ablation will better quantify surface runoff cumulated in supraglacial lakes and should be investigated.
Additionally, some modeled meltwater runoff evaporates prior reaching supraglacial lakes. This process is considered negligible and not included in the SMB models at present (Vernon et al., 2013). However, for typical-size (~10 km2) supraglacial catchments (Yang and Smith, 2016), meltwater needs to be routed a considerable time (> 5 h) before reaching the terminal lake (Yang et al., 2018) so evaporation may not be negligible. Moreover, only one snapshot is used here to estimate runoff contributing areas (Fig. 1), but supraglacial hydrology is highly dynamic even over short times (Yang et al., 2017;Hoffman et al., 2018).
Small moulins may form and drain meltwater locally into the ice sheet (Smith et al., 2017) and change meltwater contributing areas of terminal lakes. Both evaporation and small moulin losses may therefore lead to underestimation of accumulated meltwater volume in su-praglacial lakes and overestimation of discrepancy between observa-tions and models. These effects should be investigated in future studies. We have devised a method for pan-Greenland meltwater analysis, yet our spatial scale is small, especially in references to the grid size of the SMB data. However, most investigations of GrIS surface hydrology rely on SMB models that simulate meltwater production but do not explicitly represent the hydrologic networks that route surface melt-water from the ice sheet surface to surrounding oceans. Direct
Fig. 9. Remotely sensed snow cover in (a) catchment 1 and (b) catchment 2. (c) Snow cover fractions show that snow gradually disappeared from DOY 189 to 205 and snow cover fraction in catchment 1 is lower than that in catchment 2.
Fig. 10. Ice surface albedo of (a) catchment 1 and (b) catchment 2 modeled by four SMB models (MAR3.6, HIRHAM5, RACMO2.3, and MERRA-2), observed by PROM-ICE KAN_M station, and calculated from Landsat-8 snow cover mapping.
observations of surface meltwater routing and storage are rare, but where available, provide important validation of these widely-used SMB models. Therefore, the main contribution of this study is to pro-pose a straightforward and easy-to-use method to estimate SMB runoff directly using satellite observations. The results have three important implications for improving the routing schemes of the SMB models: 1) a delay function should be integrated into the SMB models to distribute runoff temporally; 2) the MAR delay function performs well before July but does not perform well in July; and 3) the SMB models simulate ice surface conditions well so the runoff overestimation is mainly attrib-uted to the way they simulate meltwater retention. We suggest that the proposed method should thus be considered to be more analogous to a small number of point locations – not unlike an automatic weather station (AWS) network – rather than blanketing the entire ablation zone in remotely sensed runoff observations.
6. Conclusion
Estimating supraglacial meltwater runoff on the Greenland Ice Sheet is challenging, and our knowledge of supraglacial water bodies and their roles in meltwater routing and storage on the ice surface is still limited. Accurate characterizations of supraglacial river discharge (Smith et al., 2015, 2017; Gleason et al., 2016) and lake volume changes (Sneed and Hamilton, 2007; Fitzpatrick et al., 2014; Pope et al., 2016) are relatively few. However, with the development of high-resolution topography data (in particular WorldView ArcticDEMs), it is now possible to accurately calculate supraglacial lake volumes (Moussavi et al., 2016;Pope et al., 2016) for the purpose of estimating supraglacial meltwater runoff and validating SMB models. This idea is actually an inverse approach of previous studies (Banwell et al., 2012; Leeson et al., 2012;Arnold et al., 2014) which used such models to simulate lake infilling, rather than using remotely sensed lake infilling rates to test SMB runoff models.
The main contribution of this study is to propose a novel method to estimate runoff generated on the ice surface through remote sensing of supraglacial lake volumes using high-resolution satellite imagery and topography data. Four state-of-the-art SMB models all significantly overestimate runoff at two supraglacial catchments (~10 km2) during July 2015, raising the question of those SMB models to properly si-mulate the production and/or retention of meltwater runoff at this spatial and temporal scale.
In this and previous papers (Smith et al., 2015,2017), we advance the practice of using remotely sensed observations of supraglacial meltwater to inform SMB models. Through independent runoff esti-mates retrieved from satellite observation, models will become better constrained and missing physical processes, such as meltwater retention in bare-ice weathering crust (Cooper et al., 2018), identified. Finally, introducing meltwater routing schemes into SMB models, aided with remotely sensed observations, represents an important and achievable direction for future research.
Acknowledgements
Kang Yang acknowledges the support of the National Key R&D Program (2018YFC1406101), the National Natural Science Foundation of China (41871327), and the Fundamental Research Funds for the Central Universities (14380070). Laurence C. Smith acknowledges the support of the NASA Cryosphere Program (80NSSC19K0942) managed by Drs. Thorsten Markus and Colene Haffke. WorldView imagery and geospatial support for this work was provided by the Polar Geospatial Center, University of Minnesota, under NSF PLR awards 1043681 & 1559691.
Appendix A. Supplementary data
Supplementary data to this article can be found online athttps:// doi.org/10.1016/j.rse.2019.111459.
References
Andrews, L.C., Catania, G.A., Hoffman, M.J., Gulley, J.D., Luthi, M.P., Ryser, C., Hawley, R.L., Neumann, T.A., 2014. Direct observations of evolving subglacial drainage be-neath the Greenland Ice Sheet. Nature 514, 80–83.
Arnold, N.S., Banwell, A.F., Willis, I.C., 2014. High-resolution modelling of the seasonal evolution of surface water storage on the Greenland Ice Sheet. Cryosphere 8, 1149–1160.
Arnold, N.S., Richards, K., Willis, I., Sharp, M., 1998. Initial results from a distributed, physically based model of glacier hydrology. Hydrol. Process. 12, 191–219.
Banwell, A.F., Arnold, N.S., Willis, I.C., Tedesco, M., Ahlstrøm, A.P., 2012. Modeling supraglacial water routing and lake filling on the Greenland Ice Sheet. J. Geophys. Res. 117, F04012.
Banwell, A.F., Hewitt, I., Willis, I., Arnold, N., 2016. Moulin density controls drainage development beneath the Greenland Ice Sheet. J. Geophys. Res. Earth Surf. 121, 2248–2269.
Bosilovich, M.G., Akella, S., Coy, L., Cullather, R., Draper, C., Gelaro, R., 2016. MERRA-2. Initial evaluation of the climate. In: Koster, R.D. (Ed.), Technical Report Series on Global Modeling and Data Assimilation. National Aeronautics and Space Administration, Greenbelt, Maryland.
Box, J.E., Ski, K., 2007. Remote sounding of Greenland supraglacial melt lakes: im-plications for subglacial hydraulics. J. Glaciol. 53, 257–265.
Catania, G.A., Neumann, T.A., 2010. Persistent englacial drainage features in the Greenland Ice Sheet. Geophys. Res. Lett. 37, L02501.
Catania, G.A., Neumann, T.A., Price, S.F., 2008. Characterizing englacial drainage in the ablation zone of the Greenland ice sheet. J. Glaciol. 54, 567–578.
Christensen, O.B., Drews, M., Christensen, J.H., Dethloff, K., Ketelsen, K., Hebestadt, I., Rinke, A., 2006. The HIRHAM5 Regional Climate Model. Version 5, Danish Meteorological Institute Technical Report.
Clason, C.C., Mair, D.W.F., Nienow, P.W., Bartholomew, I.D., Sole, A., Palmer, S., Schwanghart, W., 2015. Modelling the transfer of supraglacial meltwater to the bed of Leverett Glacier, Southwest Greenland. Cryosphere 9, 123–138.
Cooper, M.G., Smith, L.C., Rennermalm, A.K., Miège, C., Pitcher, L.H., Ryan, J.C., Yang, K., Cooley, S., 2018. Meltwater storage in low-density near-surface bare ice in the Greenland ice sheet ablation zone. Cryosphere 12, 955–970.
Cullather, R.I., Nowicki, S.M.J., Zhao, B., Koenig, L.S., 2016. A characterization of Greenland ice sheet surface melt and runoff in contemporary reanalyses and a re-gional climate model. Front. Earth Sci. 4.
Enderlin, E.M., Howat, I.M., Jeong, S., Noh, M.-J., van Angelen, J.H., van den Broeke, M.R., 2014. An improved mass budget for the Greenland ice sheet. Geophys. Res. Lett. 41, 866–872.
Fettweis, X., Box, J.E., Agosta, C., Amory, C., Kittel, C., Lang, C., van As, D., Machguth, H., Gallée, H., 2017. Reconstructions of the 1900–2015 Greenland ice sheet surface mass balance using the regional climate MAR model. Cryosphere 11, 1015–1033.
Fitzpatrick, A.A.W., Hubbard, A.L., Box, J.E., Quincey, D.J., van As, D., Mikkelsen, A.P.B., Doyle, S.H., Dow, C.F., Hasholt, B., Jones, G.A., 2014. A decade of supraglacial lake volume estimates across a land-terminating margin of the Greenland Ice Sheet. Cryosphere 8, 107–121.
Flowers, G.E., 2018. Hydrology and the future of the Greenland ice sheet. Nat. Commun. 9, 2729.
Gleason, C.J., Smith, L.C., Chu, V.W., Legleiter, C.J., Pitcher, L.H., Overstreet, B.T., Rennermalm, A.K., Forster, R.R., Yang, K., 2016. Characterizing supraglacial melt-water channel hydraulics on the Greenland Ice Sheet from in situ observations. Earth Surf. Process. Landforms 41, 2111–2122.
Hanna, E., Navarro, F.J., Pattyn, F., Domingues, C.M., Fettweis, X., Ivins, E.R., Nicholls, R.J., Ritz, C., Smith, B., Tulaczyk, S., Whitehouse, P.L., Zwally, H.J., 2013. Ice-sheet mass balance and climate change. Nature 498, 51–59.
Hoffman, M.J., Catania, G.A., Neumann, T.A., Andrews, L.C., Rumrill, J.A., 2011. Links between acceleration, melting, and supraglacial lake drainage of the western Greenland Ice Sheet. J. Geophys. Res. Earth Surf. 116.
Hoffman, M.J., Perego, M., Andrews, L.C., Price, S.F., Neumann, T.A., Johnson, J.V., Catania, G., Lüthi, M.P., 2018. Widespread moulin formation during supraglacial lake drainages in Greenland. Geophys. Res. Lett. 45, 778–788.
Igneczi, A., Sole, A.J., Livingstone, S.J., Leeson, A.A., Fettweis, X., Selmes, N., Gourmelen, N., Briggs, K., 2016. Northeast sector of the Greenland Ice Sheet to undergo the greatest inland expansion of supraglacial lakes during the 21st century. Geophys. Res. Lett. 43, 9729–9738.
Irvine-Fynn, T., Hubbard, B., 2016. Glacier Hydrology and Runoff, International Encyclopedia of Geography: People, the Earth, Environment and Technology. John Wiley & Sons, Ltd.
Karlstrom, L., Yang, K., 2016. Fluvial supraglacial landscape evolution on the Greenland Ice Sheet. Geophys. Res. Lett. 43, 2683–2692.
Khan, S.A., Aschwanden, A., Bjørk, A.A., Wahr, J., Kjeldsen, K.K., Kjær, K.H., 2015. Greenland ice sheet mass balance: a review. Rep. Prog. Phys. 78, 046801.
King, L., Hassan, M., Yang, K., Flowers, G., 2016. Flow routing for delineating su-praglacial meltwater channel networks. Remote Sens. 8, 988.
Koenig, L.S., Lampkin, D.J., Montgomery, L.N., Hamilton, S.L., Turrin, J.B., Joseph, C.A., Moutsafa, S.E., Panzer, B., Casey, K.A., Paden, J.D., Leuschen, C., Gogineni, P., 2015. Wintertime storage of water in buried supraglacial lakes across the Greenland Ice Sheet. Cryosphere 9, 1333–1342.
Koziol, C.P., Arnold, N., 2018. Modelling seasonal meltwater forcing of the velocity of land-terminating margins of the Greenland Ice Sheet. Cryosphere 12, 971–991.
Lampkin, D.J., VanderBerg, J., 2011. A preliminary investigation of the influence of basal and surface topography on supraglacial lake distribution near Jakobshavn Isbrae, western Greenland. Hydrol. Process. 25, 3347–3355.
Lampkin, D.J., VanderBerg, J., 2014. Supraglacial melt channel networks in the Jakobshavn Isbræ region during the 2007 melt season. Hydrol. Process. 28, 6038–6053.
Leeson, A.A., Shepherd, A., Briggs, K., Howat, I., Fettweis, X., Morlighem, M., Rignot, E., 2014. Supraglacial lakes on the Greenland ice sheet advance inland under warming climate. Nat. Clim. Chang. 5, 51.
Leeson, A.A., Shepherd, A., Briggs, K., Howat, I., Fettweis, X., Morlighem, M., Rignot, E., 2015. Supraglacial lakes on the Greenland ice sheet advance inland under warming climate. Nat. Clim. Chang. 5, 51–55.
Leeson, A.A., Shepherd, A., Palmer, S., Sundal, A., Fettweis, X., 2012. Simulating the growth of supraglacial lakes at the western margin of the Greenland ice sheet. Cryosphere 6, 1077–1086.
Lefebre, F., Gallée, H., van Ypersele, J.-P., Greuell, W., 2003. Modeling of snow and ice melt at ETH Camp (West Greenland): a study of surface albedo. J. Geophys. Res. Atmospheres 108, 16.
Liang, Y.-L., Colgan, W., Lv, Q., Steffen, K., Abdalati, W., Stroeve, J., Gallaher, D., Bayou, N., 2012. A decadal investigation of supraglacial lakes in West Greenland using a fully automatic detection and tracking algorithm. Remote Sens. Environ. 123, 127–138.
McMillan, M., Nienow, P., Shepherd, A., Benham, T., Sole, A., 2007. Seasonal evolution of supra-glacial lakes on the Greenland Ice Sheet. Earth Planet. Sci. Lett. 262, 484–492.
Mernild, S.H., Liston, G.E., Hiemstra, C.A., Christensen, J.H., Stendel, M., Hasholt, B., 2011. Surface mass balance and runoff modeling using HIRHAM4 RCM at Kangerlussuaq (Sondre Stromfjord), west Greenland, 1950-2080. J. Clim. 24, 609–623.
Mouginot, J., Rignot, E., Bjørk, A.A., van den Broeke, M., Millan, R., Morlighem, M., Noël, B., Scheuchl, B., Wood, M., 2019. Forty-six years of Greenland Ice Sheet mass balance from 1972 to 2018. Proc. Natl. Acad. Sci. U.S.A. 116, 9239–9244.
Moussavi, M.S., Abdalati, W., Pope, A., Scambos, T., Tedesco, M., MacFerrin, M., Grigsby, S., 2016. Derivation and validation of supraglacial lake volumes on the Greenland Ice Sheet from high-resolution satellite imagery. Remote Sens. Environ. 183, 294–303.
Noël, B., van de Berg, W.J., van Wessem, J.M., van Meijgaard, E., van As, D., Lenaerts, J.T.M., Lhermitte, S., Kuipers Munneke, P., Smeets, C.J.P.P., van Ulft, L.H., van de Wal, R.S.W., van den Broeke, M.R., 2018. Modelling the climate and surface mass balance of polar ice sheets using RACMO2 – Part 1: Greenland (1958–2016). Cryosphere 12, 811–831.
Noh, M.-J., Howat, I.M., 2015. Automated stereo-photogrammetric DEM generation at high latitudes: surface Extraction with TIN-based Search-space Minimization (SETSM) validation and demonstration over glaciated regions. GIsci. Remote Sens. 52, 198–217.
Noh, M.-J., Howat, I.M., 2017. The surface extraction from TIN based search-space minimization (SETSM) algorithm. ISPRS J. Photogrammetry Remote Sens. 129, 55–76.
Otsu, N., 1979. A threshold selection method from gray-level histograms. Systems, Man and Cybernetics. IEEE Transactions on 9, 62–66.
Pitcher, L.H., Smith, L.C., 2019. Supraglacial streams and rivers. Annu. Rev. Earth Planet Sci. 47 null.
Pitcher, L.H., Smith, L.C., Gleason, C.J., 2016. CryoSheds: a GIS modeling framework for generating hydrologic watersheds for land-terminating glaciers and ice sheets using digital elevation models and remote sensing. GIsci. Remote Sens. 53, 707–722.
Poinar, K., Joughin, I., Das, S.B., Behn, M.D., Lenaerts, J.T.M., van den Broeke, M.R., 2015. Limits to future expansion of surface-melt-enhanced ice flow into the interior of western Greenland. Geophys. Res. Lett. 42, 1800–1807.
Pope, A., Scambos, T.A., Moussavi, M., Tedesco, M., Willis, M., Shean, D., Grigsby, S., 2016. Estimating supraglacial lake depth in West Greenland using Landsat 8 and comparison with other multispectral methods. Cryosphere 10, 15–27.
Ryan, J.C., Smith, L.C., van As, D., Cooley, S.W., Cooper, M.G., Pitcher, L.H., Hubbard, A., 2019. Greenland Ice Sheet surface melt amplified by snowline migration and bare ice exposure. Sci. Adv. 5, eaav3738.
Selmes, N., Murray, T., James, T.D., 2011. Fast draining lakes on the Greenland ice sheet. Geophys. Res. Lett. 38, L15501.
Shepherd, A., Wingham, D., 2007. Recent sea-level contributions of the antarctic and Greenland ice sheets. Science 315, 1529–1532.
Shfaqat, A.K., Andy, A., Anders, A.B., John, W., Kristian, K.K., Kurt, H.K., 2015. Greenland ice sheet mass balance: a review. Rep. Prog. Phys. 78, 046801.
Smith, L.C., Chu, V.W., Yang, K., Gleason, C.J., Pitcher, L.H., Rennermalm, A.K., Legleiter, C.J., Behar, A.E., Overstreet, B.T., Moustafa, S.E., Tedesco, M., Forster, R.R.,
LeWinter, A.L., Finnegan, D.C., Sheng, Y., Balog, J., 2015. Efficient meltwater drai-nage through supraglacial streams and rivers on the southwest Greenland ice sheet. Proc. Natl. Acad. Sci. U.S.A. 112, 1001–1006.
Smith, L.C., Yang, K., Pitcher, L.H., B.T.,O., Chu, V.W., Rennermalm, A.K., Ryan, J., Cooper, M.G., Gleason, C.J., Tedesco, M., 2017. Direct measurements of meltwater runoff on the Greenland ice sheet surface. Proc. Natl. Acad. Sci. U.S.A. 114, E10622–E10631.
Sneed, W.A., Hamilton, G.S., 2007. Evolution of melt pond volume on the surface of the Greenland Ice Sheet. Geophys. Res. Lett. 34, L03501.
Stevens, L.A., Behn, M.D., McGuire, J.J., Das, S.B., Joughin, I., Herring, T., Shean, D.E., King, M.A., 2015. Greenland supraglacial lake drainages triggered by hydrologically induced basal slip. Nature 522, 73.
Sundal, A.V., Shepherd, A., Nienow, P., Hanna, E., Palmer, S., Huybrechts, P., 2009. Evolution of supra-glacial lakes across the Greenland ice sheet. Remote Sens. Environ. 113, 2164–2171.
Tedesco, M., Lüthje, M., Steffen, K., Steiner, N., Fettweis, X., Willis, I., Bayou, N., Banwell, A., 2012. Measurement and modeling of ablation of the bottom of supraglacial lakes in western Greenland. Geophys. Res. Lett. 39, L02502.
Tedesco, M., Willis, I.C., Hoffman, M.J., Banwell, A.F., Alexander, P., Arnold, N.S., 2013. Ice dynamic response to two modes of surface lake drainage on the Greenland ice sheet. Environ. Res. Lett. 8, 034007.
van As, D., Bech Mikkelsen, A., Holtegaard Nielsen, M., Box, J., Claesson Liljedahl, L., Lindbäck, K., Pitcher, L., Hasholt, B., 2017. Hypsometric amplification and routing moderation of Greenland ice sheet meltwater release. Cryosphere 11, 1371–1386.
van den Broeke, M.R., Bamber, J., Ettema, J., Rignot, E., Schrama, E., van de Berg, W.J., van Meijgaard, E., Velicogna, I., Wouters, B., 2009. Partitioning recent Greenland mass loss. Science 326, 984–986.
van den Broeke, M.R., Enderlin, E.M., Howat, I.M., Kuipers Munneke, P., Noël, B.P.Y., van de Berg, W.J., van Meijgaard, E., Wouters, B., 2016. On the recent contribution of the Greenland ice sheet to sea level change. Cryosphere 10, 1933–1946.
Van Meijgaard, E., Ulft, L.H.v., Berg, W.J.v.d., Bosveld, F.C., Hurk, B.v.d., Lenderink, G., Siebesma, A.P., 2008. Technical Report: the KNMI Regional Atmospheric Climate Model RACMO Version 2.1. Royal Netherlands Meteorological Institute, De Bilt.
Vernon, C.L., Bamber, J.L., Box, J.E., van den Broeke, M.R., Fettweis, X., Hanna, E., Huybrechts, P., 2013. Surface mass balance model intercomparison for the Greenland ice sheet. Cryosphere 7, 599–614.
Williamson, A.G., Arnold, N.S., Banwell, A.F., Willis, I.C., 2017. A Fully Automated Supraglacial lake area and volume Tracking (“FAST”) algorithm: development and application using MODIS imagery of West Greenland. Remote Sens. Environ. 196, 113–133.
Williamson, A.G., Banwell, A.F., Willis, I.C., Arnold, N.S., 2018. Dual-satellite (Sentinel-2 and Landsat 8) remote sensing of supraglacial lakes in Greenland. Cryosphere 12, 3045–3065.
Willis, I.C., Arnold, N.S., Brock, B.W., 2002. Effect of snowpack removal on energy bal-ance, melt and runoff in a small supraglacial catchment. Hydrol. Process. 16, 2721–2749.
Yang, K., Karlstrom, L., Smith, L.C., Li, M., 2017. Automated high resolution satellite image registration using supraglacial rivers on the Greenland Ice Sheet. IEEE J. Sel. Topics Appl. Earth Observ. Remote Sens. 10, 845–856.
Yang, K., Smith, L.C., 2013. Supraglacial streams on the Greenland ice sheet delineated from combined spectral-shape information in high-resolution satellite imagery. IEEE Geosci. Remote Sens. Lett. 10, 801–805.
Yang, K., Smith, L.C., 2016. Internally drained catchments dominate supraglacial hy-drology of the southwest Greenland Ice Sheet. J. Geophys. Res. Earth Surf. 121, 1891–1910.
Yang, K., Smith, L.C., Chu, V.W., Gleason, C.J., Li, M., 2015. A caution on the use of surface digital elevation models to simulate supraglacial hydrology of the Greenland Ice Sheet. IEEE J. Sel. Topics Appl. Earth Observ. Remote Sens. 8, 5212–5224.
Yang, K., Smith, L.C., Chu, V.W., Pitcher, L.H., Gleason, C.J., Rennermalm, A.K., Li, M., 2016. Fluvial morphometry of supraglacial river networks on the southwest Greenland Ice Sheet. GIScience Remote Sens. 53, 459–482.
Yang, K., Smith, L.C., Karlstrom, L., Cooper, M.G., Tedesco, M., van As, D., Cheng, X., Chen, Z., Li, M., 2018. A new surface meltwater routing model for use on the Greenland Ice Sheet surface. Cryosphere 12, 3791–3811.
Zuo, Z., Oerlemans, J., 1996. Modelling albedo and specific balance of the Greenland ice sheet: calculations for the Søndre Strømfjord transect. J. Glaciol. 42, 305–317.