Geo-Eco-Trop., 2020, 44, 4 : 541-552
Using the CARAIB dynamic vegetation model to simulate crop yields in Belgium: validation and projections for the 2035 horizon
Utilisation du modèle dynamique de végétation CARAIB pour simuler les rendements en Belgique: validation et projections à l’horizon 2035
Ingrid JACQUEMIN 1,2, Julie BERCKMANS 3,4, Alexandra-Jane HENROT 2, Marie DURY 2,
Bernard TYCHON 1, Alain HAMBUCKERS 5, Rafiq HAMDI 3 & Louis FRANCOIS 2
Résumé: Le modèle CARAIB a été initialement développé pour décrire la dynamique des écosystèmes naturels et pour étudier le rôle de la végétation dans le cycle global du carbone. Afin de pouvoir répondre à de nouveaux défis (comme l’étude des rétroactions climat-végétation ou encore l’évaluation des services écosystémiques), le modèle a été doté d’un nouveau module lui permettant de couvrir l’ensemble de la végétation, naturelle et celle dite « managée », comme les cultures. Avant de pouvoir être appliqué sur la Belgique, le modèle a été validé à deux échelles et selon 2 types de données: (1) sur un site de mesure par la méthode de covariance des turbulences, et (2) à l’échelle nationale belge sur base des données de rendements moyens par région agricole et pour le passé récent. Le modèle a ensuite été appliqué à l’échelle belge, forcé par deux scénarios climatiques futurs jusqu’à l’horizon 2035, afin d’évaluer les potentiels impacts du changements climatiques sur les rendements agricoles des six principales cultures du pays (froment d’hiver, orge d’hiver, pommes de terre, maïs, betteraves sucrières et colza) et donc, les risques encourus par les agriculteurs.
Mots-clés: modèle dynamique de végétation, cultures agricoles, changement climatique, CARAIB, Belgique.
Abstract: The CARAIB model was initially designed to describe the dynamics of natural ecosystems and to study the role of vegetation in the global carbon cycle. In order to be able to respond to new challenges (such as the study of climate-vegetation feedback or the evaluation of ecosystem services), the model has been adapted with a new module allowing it to cover all vegetation, natural and managed, such as cultures. Before it can be applied over Belgium, the model was validated at two scales and according to two types of data: (1) on an eddy-covariance measurement site, and (2) on a Belgian national scale based on average yield data by agricultural region and for the recent past. The model was then applied at the Belgian scale, forced under two future climate scenarios up to the year 2035, in order to assess the potential impacts of climate change on the agricultural yields of the six main crops of the country (winter wheat, winter barley, potatoes, maize, sugar beet and rapeseed) and therefore the risks incurred by farmers.
Keywords: dynamic vegetation model, agricultural crops, climate change, CARAIB, Belgium.
INTRODUCTION
Dynamic vegetation models, such as CARAIB ("CARbon Assimilation In the Biosphere"), were initially developed to study the dynamics of natural vegetation, its role in the global carbon cycle and its response to climate change. The characteristics of these models allow for many other applications and improvements, such as the coupling with climate models (DAVIN et al., 2011; DELIRE et al. 2011) or the development of a module dedicated to crop growth (BONDEAU et al., 2007; WU et al., 2016). This addition enables the model to propose a system of complete management of vegetation, both natural and human-controlled. It also opens the door to more global research projects such as the study of
1 Eau, Environnement, Développement, U.R. SPHERES, Département des Sciences et Gestion de l’Environnement (Arlon
Campus Environnement), Faculté des Sciences, Université de Liège, Bât. BE-009, Avenue de Longwy 185, 6700 Arlon, Belgique [Auteur correspondant: [email protected]]
2 Unité de Modélisation du Climat et Cycles Biogéochimiques, U.R. SPHERES, Département d’Astrophysique, Géophysique
et Océanographie, Faculté des Sciences, Université de Liège, Bât. B5c, 19c Allée du 6 Août, 4000 Liège, Belgique [Auteur correspondant: [email protected]]
3 Institut Royal Météorologique, Bruxelles, Belgique
4 R&D Unit RMA – Environmental Modelling, VITO, Mol, Belgique
5 Unité de Biologie du Comportement, U.R. SPHERES, Département de Biologie, Ecologie et Evolution, Université de Liège,
ecosystem services (FONTAINE et al., 2014) or the study of the climate-vegetation feedback as undertaken in the framework of the MASC project (FRANÇOIS et al., 2019).
In this project, we aimed to study interactions between vegetation and the climate, which are complex and for which feedback processes are numerous. The climate can modify ecosystem functions and structures, alter photosynthesis or impact water balance. All these changes will inevitably modify some climate system parameters, such as surface properties (albedo or evapotranspiration) and greenhouse gas emissions (mainly CO2). The impacts of climate change, particularly on crops, can have
socio-economic consequences and lead to changes in agricultural practices: a crop with declining production may gradually be replaced by another crop that is more adapted to the new climatic conditions. These changes will therefore also have consequences for the climate system. The final objective of the project, executed at the Belgian level, was to provide climate simulations that take into account these changes in land properties and cover. To achieve this goal, 3 models were combined: (1) CARAIB, to assess climate change impacts on (natural and managed) vegetation productivity and other climate parameters, (2) ADAM, an agent-based model (ABM, BECKERS et al., 2018) to simulate land use changes and (3) ALARO(-SURFEX), the Belgian regional climate model.
It is in this context that we have improved the crop module in CARAIB. The crop module has been used previously in the African context (DURY et al., 2019). Here, it has been adapted for different crops, the Belgian context and the high resolution required by the project. It was therefore important to be able to validate the model and, as a prelude to coupled simulations (CARAIB-ADAM), assess the risks to Belgian agricultural yields in the future. The validation was carried out in two stages. First, we used the data taken from the eddy-covariance fluxes measured at the Lonzée site (Belgium). We compared the model outputs with the carbon flows for primary productivity, evapotranspiration and net ecosystem productivity over several years and for several crops. Then, the model was applied at the country level, and the average yields simulated by CARAIB were compared with data from Belgian agricultural statistics.
MATERIALS AND METHODS CARAIB model
CARAIB (CARbon Assimilation In the Biosphere) is a dynamic vegetation model developed to study the role of vegetation in the global carbon cycle (WARNANT et al., 1994; GÉRARD et al., 1999) and to study vegetation distribution in the past (FRANÇOIS et al., 1998, 2011; HENROT et al., 2017), in the present and in the future (LAURENT et al., 2008; DURY et al., 2011). The model is composed of several modules dealing with (i) soil hydrology, (ii) photosynthesis and stomatal regulation, (iii) carbon allocation and biomass growth, (iv) soil and litter carbon dynamics, (v) vegetation dynamics, (vi) seed dispersal and (vii) natural vegetation fires. CARAIB was recently improved by the use of species-specific traits (DURY et al., 2018) and by the addition of the crop module. As for natural vegetation, crop growth is driven by photosynthetic activity but differs on the use of phenological stages. The scheme is very simple as only two stages are defined (from sowing to emergence, and from emergence to harvesting) and they are limited by the reaching of a certain level of heat accumulation. This accumulation is based on the growing degree days, which is the sum of daily temperature (°C) above a temperature threshold (or base temperature) below which the plant does not grow. The heat accumulation needed and the base temperature are fixed for each crop or variety. Since the allocation scheme of the model is relatively simple and does not allow allocation to a storage organ (e.g. grain or fruit), the yield is therefore estimated from net primary productivity using a harvest index (GERBENS-LEENES et al., 2009) and the water content to get the green weight (Tab. 1). This crop module has been tested in several contexts: grasslands (MINET et al., 2015) and wheat at the local level (PIRTTIOJA et
al., 2015; FRONZEK et al., 2018) and for North and Sub-Saharan Africa (DURY et al., 2019).
For the Belgian context, the different crop parameters were adapted (Tab. 1) and 2 cultivars of each crop were used to better represent the spatial variability over Belgium. These cultivars differ on the required heat accumulation and the sowing dates in order to match the field reality as closely as possible, where sowing dates and harvests often occurred later in the south than in the north of the country. In addition, in order to avoid extending to the next year the period over which the accumulation must be reached, we fixed a specific maximum growing season length for each crop or variety.
Table 1: Crop parameters (for the 2 varieties) used in CARAIB for the Belgian case study. Base temp. (°C) GDD for emergence (°C) GDD for harvesting (°C) Sowing date (day number) Maximum Season length (days) Harvest index (fraction) Water content (%) Winter Wheat 0 140 2450 315 320 0.42 15 2800 315 Winter Barley 0 110 2200 270 310 0.42 15 2700 270 Silage Maize 6 50 1400 135 210 0.90 50 1600 125 Sugar Beets 3 90 2200 105 250 0.66 79 2400 95 Potatoes 3 170 1850 135 210 0.70 75 1950 125 Rapeseed 0 110 2250 255 330 0.32 26 2400 255 Soil data
The model can be applied at different scales and therefore with different resolutions: from the global scale to a specific plot of land (FONTAINE et al., 2014). The high resolution (kilometre) simulations required for the MASC project necessitate the adaptation of some input data. We improved the soil texture database (Fig. 1), initially drawn from the Harmonized World Soil Database (HWSD - FAO/IIASA/ISRIC/ISS-CAS/JRC, 2009. Harmonized World Soil Database. FAO, Rome, Italy and IIASA, Laxenburg, Austria), on the basis of the Soil Associations’ Map of Flanders (AGIV – GDI Vlaanderen) and the Digital Soils Map of Wallonia (http://geoportail.wallonie.be/catalogue-cartes). Average textures were defined for each of the main soil classes.
Figure 1: Top: Former soil texture map from the “Harmonized World Soil Database”. Bottom: New soil texture map provided by the MASC project.
Land use and land cover data
For these simulations, we used a fixed land use/land cover (LULC) across the country. We computed the land use fractions (agricultural, urban, natural vegetation, crops, meadows, bare soil and water areas) per pixel based on the ECOPLAN (project funded by the Flemish agency for Innovation by Science and Technology, 2013-2016) for Flanders and on the Walloon land use map (COS-W -
http://geoportail.wallonie.be/catalogue-cartes). Regarding the soil cover within the agricultural areas (Fig. 2), we fixed the percentage of each crop following the analysis of the agricultural statistics by municipality from the Federal Public Service “Economy” (Fig. 3). Over the period 2000 to 2007, we selected the 5 most important crops (winter wheat, winter barley, potatoes, sugar beets and silage maize), to which we added rapeseed (which has experienced an important cultivated area increase over the last 15 years).
Figure 2: Agricultural regions of Belgium.
Climate data
In the framework of this study, we used outputs from the Regional Climate Model (RCM) ALARO (GERARD et al., 2009), coupled with SURFEX (MASSON et al., 2013). SURFEX is a surface modelling platform, used by the RCM for the integration of the exchanges of energy and water between the low-level atmosphere, vegetation and the soil surface. CARAIB was run over the Belgian territory for crops using two different datasets of ALARO daily climate forcing (1 km climate derived from 4 km-ALARO simulation). The first dataset comprises outputs from km-ALARO itself forced by (ERA-interim) climate reanalyses between 1990 and 2010. The objective of this simulation was to validate CARAIB outputs over the last twenty years. Another dataset was provided by ALARO for near-future climate changes (between 2006 and 2035) under the assumptions of greenhouse gas concentration trajectories (from IPCC Fifth Assessment Report, scenarios RCP 8.5 with 467 ppmv and RCP 4.5 with ~447 ppmv in 2035).
Validation data
The first simulations were dedicated to the validation of the crop module over Belgium, and were conducted in 3 steps: for (1) spatial and (2) temporal validation over the country, and (3) temporal validation with eddy-flux measurement data. For the first two steps, we used yearly yield data from the Federal Public Service Economy, collected between 1990 and 2016. The disadvantage of these data is that they are not available at the kilometre square resolution required for the MASC project, but at the scales of the country and of the agricultural regions for which spatial variability can be important. Regarding eddy-covariance measurements, we used data from the Belgian Lonzée site included in the FLUXNET network. We focused on the ability of the model to reproduce 3 of the measured water and carbon fluxes: the gross primary productivity (GPP), the net ecosystem productivity (NEP) and evapotranspiration (ET). This site is located in the centre of the country, in the loamy region, the most important (and productive) agricultural region of the country and the model proposed a crop rotation of winter wheat, sugar beets, potatoes and maize (AUBINET et al., 2009; DUFRANNE et al., 2011; BUYSSE et al., 2017).
RESULTS AND DISCUSSION Validation at the site level
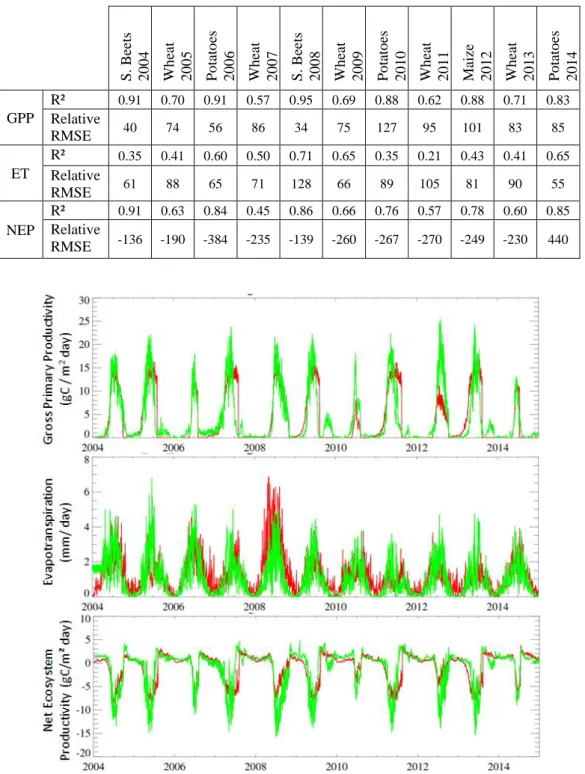
We compared the CARAIB outputs with the eddy-covariance data measured at the Lonzée site. Globally, the determination coefficients between the data and measurements are relatively good (Tab. 2), especially for GPP with a minimum of 0.57 for winter wheat in 2007 and a maximum of 0.95 for sugar beets in 2008 (with a large contribution of seasonality through the years), despite a much worse relative RMSE. We also notice that CARAIB tends to globally underestimate the GPP (Tab. 2 & Fig. 4), and this is particularly true for maize. This underestimation can be attributed to a highly simplified photosynthetic scheme, especially for C4 plants like maize. At this detailed scale, various processes should also be considered as the possible underestimation of diffuse radiation, which is more efficient than direct radiation for photosynthesis. We can also highlight that the model suffers from a lack of development of the different crop growth stages. This is particularly clear for cereals, for which the important senescence phase is not reproduced by CARAIB. We can observe that the GPP calculated by CARAIB falls abruptly at the time of harvest, while the GPP should gradually decrease during the senescence phase at the end of the vegetative period (Fig. 4). To get around these issues, the coupling with more detailed models or site-specific models (VUICHARD et al., 2016) could be considered. Current yields: spatial and temporal validation
At the Belgian scale, the challenge was quite different as we have to accommodate reasonable spatial and temporal variability. We calibrated the model on the basis of the eddy-covariance results and we corrected the cultivars using the country statistics on crop yields (FPS Economy). CARAIB was run over the Belgian territory for crops with ALARO daily climate forcing (1 km climate interpolated derived from 4 km-ALARO simulation forced by climate reanalysis) and with a fixed LULC and crop fractions across agricultural areas (Figs. 2 & 3).
Table 2: Coefficients of determination R² and relative RMSE (%) for the 3 parameters (GPP – gross primary productivity, ET – evapotranspiration and NEP – net ecosystem productivity) for the Lonzée site.
S. B ee ts 2004 W h ea t 2005 Po tato es 2006 W h ea t 2007 S. B ee ts 2008 W h ea t 2009 Po tato es 2010 W h ea t 2011 Ma ize 2012 W h ea t 2013 Po tato es 2014 GPP R² 0.91 0.70 0.91 0.57 0.95 0.69 0.88 0.62 0.88 0.71 0.83 Relative RMSE 40 74 56 86 34 75 127 95 101 83 85 ET R² 0.35 0.41 0.60 0.50 0.71 0.65 0.35 0.21 0.43 0.41 0.65 Relative RMSE 61 88 65 71 128 66 89 105 81 90 55 NEP R² 0.91 0.63 0.84 0.45 0.86 0.66 0.76 0.57 0.78 0.60 0.85 Relative RMSE -136 -190 -384 -235 -139 -260 -267 -270 -249 -230 440
Figure 4: Comparison of (a) gross primary productivity (GPP), (b) evapotraspiration (ET), and (c) net ecosystem productivity (NEP) outputs from CARAIB (in red) with measurements from the eddy covariance sites (in green)
of Lonzée (Belgium).
Before analysing the different results, we have to emphasize that no information is available on the sampling method used to compute the agricultural statistics; we thus consider every parcel/pixel where the crop is cultivated (weighted by the effective cover fraction). Some differences observed over the country can be partly explained by differences in crop management (new techniques, sowing density, fertiliser, etc.) that we are not able to take into account in the model. This also can be due to cultivation of different cultivars that we are also not able to reproduce due to lack of data. Obviously, the dynamic vegetation model can not simulate the impact of some natural hazards (crop laying, diseases, etc.) on crop yields.
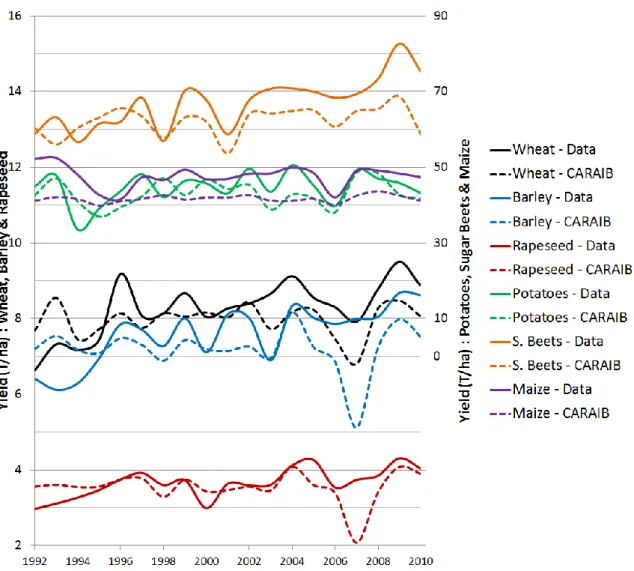
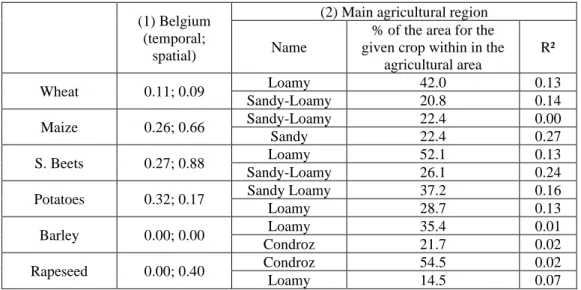
Figure 5 gives an overview of the inter-annual variation of the average Belgian yields compared with average yields calculated by CARAIB. Globally, the model tends to reproduce the average yield well, but with a slight underestimation of the amplitude of inter-annual variability. At the Belgian scale, yields of maize and sugar beets show a good distribution over the country and a satisfactory variability with determination coefficients R2 of 0.66 and 0.88, respectively, for the spatial variability (Tab. 3). At
the agricultural region scale, we concentrated our analysis on the two regions with the largest proportion of maize and sugar beet cultivation. For maize, 44.8% of its cultivated area is within the sandy-loamy and the sandy regions, and more than 78% of sugar beet cultivation is across the loamy and sandy-loamy regions. The correlation coefficient can be very different from one agricultural region to another, with zero to 0.27 for maize. But globally, simulations for maize and sugar beets show a good distribution over the country. The results are not as good for winter wheat at the country scale but show less temporal variability for agricultural regions (Tab. 3). Both mainly located in the south of the country, rapeseed and barley show a quite uniform yields, confirmed by a less satisfactory R² at the global and regional scales.
At the beginning of the MASC project, the simulations provided almost uniform results over Belgium with a slight yield increase in the south of the country. In addition, the average Belgian yield was quite far from the yield given in the agricultural statistics. Results presented here illustrate the progress made during this project, but they also highlight the need to better capture the practices which take place in the different regions of the country. For example, this could be done by the use of more cultivars but, faced with a lack of data, this would imply an important calibration step.
Figure 5: Average yield for Belgium calculated by CARAIB (forced by ALARO outputs, itself forced by climate reanalyses) and compared to yield statistics between 1991 and 2010.
Table 3: Determination coefficients (R²) for the temporal and spatial (average yield at the agricultural area scale) variabilty over (1) Belgium. For each crop (2), we gave the name and the percentage area of the two most
important agricultural regions in terms of area and their related R². (1) Belgium
(temporal; spatial)
(2) Main agricultural region Name
% of the area for the given crop within in the
agricultural area R² Wheat 0.11; 0.09 Loamy 42.0 0.13 Sandy-Loamy 20.8 0.14 Maize 0.26; 0.66 Sandy-Loamy 22.4 0.00 Sandy 22.4 0.27 S. Beets 0.27; 0.88 Loamy 52.1 0.13 Sandy-Loamy 26.1 0.24
Potatoes 0.32; 0.17 Sandy Loamy 37.2 0.16
Loamy 28.7 0.13 Barley 0.00; 0.00 Loamy 35.4 0.01 Condroz 21.7 0.02 Rapeseed 0.00; 0.40 Condroz 54.5 0.02 Loamy 14.5 0.07 Future yields
For these future simulations, CARAIB was forced with the two climate scenarios (RCP 4.5 and 8.5) in order to analyse the impact on productivity and especially on crop yields. Yields are positively impacted (Fig. 6) by a combination of climate change and, in a negligible extent, by the fertilisation effect of the rising atmospheric CO2. Indeed, yields differences between simulations with or without
CO2 forcing (i.e., with a constant atmospheric CO2 after 2010 fixed to 389 ppm) are not significant. On
the other hand, differences are clearer between the two climatic scenarios (Tab. 4). But on the whole, we could also observe that, while the inter-annual variability remains reasonable within the climate scenario used for the validation (Fig. 5), inter-annual variability increases with these simulations. The global trend is significantly more positive under scenario RCP 8.5 than for scenario RCP 4.5. But, due to the higher inter-annual variability, the relative increase between the average for period 2006-2010 and 2031-2035 is more contrasted. While winter wheat, maize and potatoes show higher increase under scenario RCP 4.5, the same is observed for sugar beets, barley and rapeseed but under scenario RCP 8.5 (Tab. 4). This difference can be explained by a different water stress sensitivity (this is especially true for potatoes), while droughts seem to be more frequent under scenario RCP 8.5.
Table 4: Percentage of yield increase between the average 2006-2010 and 2031-2036 under the two climate scenarios RCP 4.5 and 8.5.
% of increase RCP 4.5 RCP 8.5 Winter wheat 14.1 13.0 Maize 10.5 9.5 Potatoes 20.1 19.4 S. Beets 9.0 14.5 Barley 7.2 13.5 Rapeseed 3.4 9.4
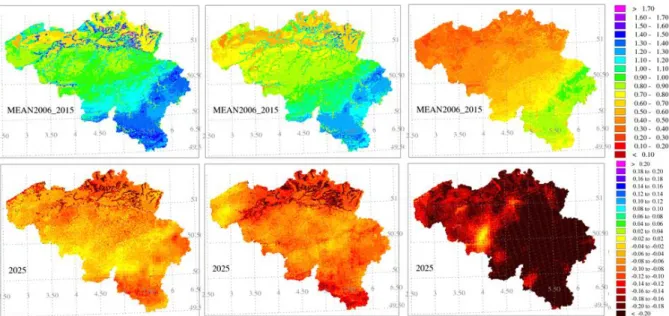
If we focus on the year 2025, we note that the drop is mainly due to a severe drought. The analysis of the soil water outputs show a slight drought (compared to the average soil water of the same trimester between 2006 and 2015) that is already present during winter (December, January and February). This situation persists during the second trimester and peaks between June and August (Fig. 7). We could make the same observation for other low-yield years, such as in 2017. In addition, we also highlight that in 2025, the growing period is slightly shorter for some crops, inducing a shorter period of photosynthetic activity in the model.
Figure 6: Average yields for Belgium calculated by CARAIB between 2010 and 2035 for the six crops, under climate scenarios RCP 4.5 and 8.5.
Figure 7: Top: Average soil water between 2006-2015 (reference) under scenario RCP 8.5, (a) during winter (December, January and February), (b) during spring (March, April and May) and (c) during summer (June, July
and August). Bottom: Anomaly maps of the differences between 2025 (RCP 8.5) and the reference (above) for the same three quarters. Soil water is defined as: (soil water – wilting point) / (field capacity – wilting point).
CONCLUSION & PERSPECTIVES
At the local (Belgian) scale and at this high resolution, we knew that the challenge would not be easy to address. From a starting point where yields were spatially unrealistic across the country, we achieved reasonable results for the six most important crops. This is especially true when faced with a lack of precise data that is readily available for validation. Obviously, the new module needs to be improved and emphasis should be placed on the development of phenological stages. In a second step, the next challenge will be to gather enough spatial and temporal data to carry out a detailed validation of high-resolution simulations.
The model was satisfactorily validated on both the temporal and spatial variability across the country, and on the basis of eddy-covariance measurements observed at the Lonzée site. The use of eddy-covariance highlights the need for improvement in the model regarding some physical and ecophysiological processes. As far as future projections are concerned, the simulation shows increasing yields for the 6 selected crops but also increasing inter-annual variability. While the trends is positive, but with a different magnitude under the two climate scenarios, the different yield reductions observed seem to be a consequence of severe and longer droughts, which will occur more frequently in the future, even in Belgium.
By the addition of the crop module, the dynamic vegetation model CARAIB becomes an interesting tool integrating the natural and managed vegetation. The next step of our research will be to couple the CARAIB model with an agent-based model able to simulate the land cover changes over agricultural areas as a function of the socio-economic context associated with the two future climate scenarios. As crop yields are important components of the socio-economic system of a society, the agent-based model is sensitive to crop yield changes. In this way, with CARAIB we would be able to assess the changes of some surface parameters and, with the help of a regional climate model, to assess their impact on the climatic system.
ACKNOWLEDGEMENT
We acknowledge the Belgian Science Policy Office (BELSPO) for funding this research (MASC project, 2014-2018).
REFERENCES
AUBINET, M., MOUREAUX, C., BODSON, B., DUFRANNE, B., HEINESCH, B., SULEAU, M., VANCUTSEM, F. & VILRET, A., 2009. Carbon sequestration by a crop over a 4-year sugar beet/winter wheat/seed potato/winter wheat rotation cycle. Agricultural and Forest Meteorology, 149: 407-418.
BECKERS, V., BECKERS, J., VANMAERCKE, M., VAN HECKE, E., VAN ROMPAEY, A. & DENDONCKER, N., 2018. Modelling farm growth and its impact on agricultural land use: A country scale application of an agent-based model. Land, 7(3), 109.
BONDEAU, A., SMITH, P., ZAEHLE, S., SCHAPHOFF, S., LUCHT, W., CRAMER, W., GERTEN, D., LOTZE-CAMPEN, H., MÜLLER, C., REICHSTEIN, M. & SMITH, B., 2007. Modelling the role of agriculture
for the 20th century global terrestrial carbon balance. Global Change Biology, 13: 679–706.
BUYSSE, P., BODSON, B., DEBACQ, A., DE LIGNE, A., HEINESCH, B., MANISE, T., MOUREAUX, C. & AUBINET, M., 2017. Carbon budget measurement over 12 years at a crop production site in the silty-loam region in Belgium. Agricultural and Forest Meteorology, 246: 241-255.
DAVIN, E.L., STÖCKLI, R., JAEGER, E.B., LEVIS, S. & SENEVIRATNE, S.I., 2011. COSMO-CLM2: a new version of the COSMO-CLM model coupled to the Community Land Model. Climate Dynamics, 37: 1889-1907. DELIRE, Ch., DE NOBLET, N., SIMA, A. & GOUIRAND, I., 2011. Vegetation dynamics enhancing long-term climate variability confirmed by two models. Journal of Climate, 24: 2238-2257.
DUFRANNE, D., MOUREAUX, C., VANCUTSEM, F., BODSON, B. & AUBINET, M., 2011: Comparison of carbon fluxes, growth and productivity of a winter wheat crop in three contrasting growing seasons. Agriculture,
Ecosystems and Environment, 141: 133-142.
DURY, M., HAMBUCKERS, A., WARNANT, P., HENROT, A.-J., FAVRE, E., OUBERDOUS, M. &
FRANÇOIS, L., 2011. Response of the European forests to climate change: a modelling approach for the 21st
DURY, M., MERTENS, L., FAYOLLE, A., VERBEECK, H., HAMBUCKERS, A. & FRANÇOIS, L., 2018. Refining species traits in a dynamic vegetation model to project the impacts of climate change on tropical trees in Central Africa. Forest, 9, 722.
DURY, M., JACQUEMIN, I., HENROT, A.-J. & FRANÇOIS, L., 2019. Estimation of present and future soil water balance and its impacts on wheat yields over North and sub-Saharan Africa using a dynamic vegetation model. Geo-Eco-Trop, 43: 317-326.
FONTAINE, C.M., DENDONCKER, N., DE VRESSE, R., JACQUEMIN, I., MAREK, A., VAN HERZELE, A., DEVILLET, G., MORTERLMANS, D., & FRANÇOIS, L., 2014. Towards participatory integrated valuation and modelling of ecosystem services under land-use change. Journal of Land Use Science, 9: 278-303.
FRANÇOIS, L.M., DELIRE, C., WARNANT, P., & MUNHOVEN, G., 1998. Modelling the glacial-interglacial changes in the continental biosphere. Global and Planetary Change, 16-17: 37-52.
FRANÇOIS, L., UTESCHER, T., FAVRE, E., HENROT, A.-J., WARNANT, P., MICHEELS, A., ERDEI, B., SUC, J.-P., CHEDDADI, R. & MOSBRUGGER, V., 2011. Modelling late Miocene vegetation in Europe: results of the CARAIB model and comparison with palaeo-vegetation data. Palaeogeography, Palaeoclimatology,
Palaeoecology, 304: 359-378.
FRANCOIS, L., JACQUEMIN, I., HENROT, A-J., HAMBUCKERS, A., TYCHON, B., BERCKMANS, J., HAMDI, R., BECKERS, V., DENDONCKER, N., HOREMANS, J., CEULEMANS, R., DECKMYN, G., DEBUSSCHER, B., DE WULF, R., VAN COILLIE, F., LAANAIA, N., CALVET, J.-C. & CARRER, D., 2019. Modelling and Assessing Surface Change impacts on Belgian and Western European climate. MASC project final report, Belgian Research Action through Interdisciplinary Networks (BRAIN-be), Belgian Science Policy (BELSPO), Brussels, Belgium, 85 pp.
FRONZEK, S., PIRTTIOJA, N., CARTER, T.R., BINDI, M., HOFFMANN, H., PALOSUO, T., RUIZ-RAMOS, M., TAO, F., TRNKA, M., ACUTIS, M., ASSENG, S., BARANOWSKI, P., BASSO, B., BODIN, P., BUIS, S., CAMMARANO, D., DELIGIOS, P., DESTAIN, M.-F., DUMONT, B., EWERT, F., FERRISE, R., FRANÇOIS, L., GAISER, T., HLAVINKA, P., JACQUEMIN, I., KERSEBAUM, K.C., KOLLAS, C., KRZYSZCZAK, J., LORITE, I.J., MINET, J., MINGUEZ, M.I., MONTESINO, M., MORIONDO, M., MÜLLER, C., NENDEL, C., ÖZTÜRK, I., PEREGO, A., RODRÍGUEZ, A., RUANE, A.C., RUGET, F., SANNA, M., SEMENOV, M.A., SLAWINSKI, C., STRATONOVITCH, P., SUPIT, I., WAHA, K., WANG, E., WU, L., ZHAO, Z. & RÖTTER, R.P., 2018. Classifying multi-model wheat yield impact response surfaces showing sensitivity to temperature and precipitation change. Agricultural Systems, 159: 209-224.
GÉRARD, J.-C., NEMRY, B., FRANÇOIS, L. & WARNANT, P., 1999. The interannual change of atmospheric CO2: contribution of subtropical ecosystems ? Geophysical Research Letters, 26: 243-246.
GERARD, L., PIRIOU, J. M., BROZKOVA, R., GELEYN, J. F. & BANCIU, D., 2009. Cloud and Precipitation parameterization in a Meso-Gamma-Scale operational weather prediction model. Monthly Weather Review, 137: 3960-3977.
GERBENS-LEENES, P.W., HOEKSTRA, A.Y. & VAN DER MEER, T., 2009. The water footprint of energy from biomass: A quantitative assessment and consequences of an increasing share of bio-energy in energy supply.
Ecological Economics, 68: 1052-1060.
HENROT, A.-J., UTESCHER, T., ERDEI, B., DURY, M., HAMON, N., RAMSTEIN, G., KRAPP, M., HEROLD, N., GOLDNER, A., FAVRE, E., MUNHOVEN, G. & FRANÇOIS, L., 2017. Middle Miocene climate and vegetation models and their validation with proxy data. Palaeogeography, Palaeoclimatology, Palaeoecology, 467: 95-119.
LAURENT, J.-M., FRANÇOIS, L., BAR-HEN, A., BEL, L. & CHEDDADI, R., 2008. European bioclimatic affinity groups: data-model comparisons. Global and Planetary Change, 61: 28-40.
MASSON, V., LE MOIGNE, P., MARTIN, E., FAROUX, S., ALIAS, A., ALKAMA, R., BELAMARI, S., BARBU, A., BOONE, A., BOUYSSEL, F., BROUSSEAU, P., BRUN, E., CALVET, J.-C., CARRER, D., DECHARME, B., DELIRE, C., DONIET, S., ESSAOUINI, K., GIBELIN, A.-L., GIORDANI, H., HABETS, F., JIDANE, M., KERDRAON, G., KOURZENEVA, E., LAFAYSSE, M., LAFONT, S., LEBEAUPIN BROSSIER, C., LEMONSU, A., MAHFOUF, J.-F., MARGUINAUD, P., MOKHTARI, M., MORIN, S., PIGEON, G., SALGADO, R., SEITY, Y., TAILLEFER, F., TANGUY, G., TULET, P., VINCENDON, B., VIONNER, V. & VOLDOIRE, A., 2013. The SURFEXv7.2 land and ocean surface platform for coupled or offline simulation of Earth surface variables and fluxes. Geoscientific Model Development, 6: 929-960.
MINET, J., LALOY, E., TYCHON, B. & FRANÇOIS, L., 2015. Bayesian inversions of a dynamic vegetation model at four European grassland sites. Biogeosciences, 12: 2809-2829.
PIRTTIOJA, N., CARTER, T.R., FRONZEK, S., BINDI, M., HOFFMANN, H., PALOSUO, T., RUIZ-RAMOS, M., TAO, F., TRNKA, M., ACUTIS, M., ASSENG, S., BARANOWSKI, P., BASSO, B., BODIN, P., BUIS, S., CAMMARANO, D., DELIGIOS, P., DESTAIN, M.-F., DUMONT, B., EWERT, F., FERRISE, R., FRANÇOIS, L., GAISER, T., HLAVINKA, P., JACQUEMIN, I., KERSEBAUM, K. C., KOLLAS, C., KRZYSZCZAK, J., LORITE, I. J., MINET, J., MINGUEZ, M.I., MONTESINO, M., MORIONDO, M., MÜLLER, C., NENDEL, C., ÖZTÜRK, I., PEREGO, A., RODRÍGUEZ, A., RUANE, A. C., RUGET, F., SANNA, M., SEMENOV, M. A., SLAWINSKI, C., STRATONOVITCH, P., SUPIT, I., WAHA, K., WANG, E., WU, L., ZHAO, Z. & RÖTTER, R.P., 2015. A crop model ensemble analysis of temperature and precipitation effects on wheat yield across a European transect using impact response surfaces. Climate Research, 65: 87-105.
VUICHARD, N., CIAIS, P., VIOVY, N., LI, L., CESCHIA, E., WATTENBACH, M., BERNHOFER, C., EMMEL, C., GRÜNWALD, T., JANS, W., LOUBET, B. & WU, X., 2016. Simulating the net ecosystem CO2 exchange and its components over winter wheat cultivation sites across a large climate gradient in Europe using the ORCHIDEE-STICS generic model. Agriculture, Ecosystems and Environment, 226: 1-17.
WARNANT, P., FRANÇOIS, L., STRIVAY, D. & GERARD, J.C., 1994. CARAIB: a global model of terrestrial biological productivity. Global Biogeochemical Cycles, 8: 255-270.
WU, X., VUICHARD, N., CIAIS, P., VIOVY, N., DE NOBLET-DUCOUDRÉ, N., WANG, X., MAGLIULO, V., WATTENBACH, M., VITALE, L., DI TOMMASI, P., MOORS, E.J., JANS, W., ELBERS, J., CESCHIA, E., TALLEC, T., BERNHOFER, C., GRÜNWALD, T., MOUREAUX, C., MANISE, T., LIGNE, A., CELLIER, P., LOUBET, B., LARMANOU, E. & RIPOCHE, D., 2016. OCHIDEE-CROP (v0), a new process-based agro-land surface model: model description and evaluation over Europe. Geoscientific Model Development, 9: 857-873.