A SIMPLIFIED APPROACH FOR WHEAT YIELD ESTIMATES BASED ON METRICS DERIVED FROM GREEN AREA INDEX DECREASING CURVES
L. Kouadio1, B. Djaby1, M. El Jarroudi 1, F. Giraud2,.3, P. Delfosse3, L. Hoffmann3and, P. Defourny4,
B. Tychon 1
1
University of Liege, 185, Avenue de Longwy B-6700, Arlon, Belgium
2
nouvelle adresse : Staphyt/BIORIZON, Rue Magendie/Bordeaux Montesquieu F-33650 Martillac, France
3
Centre de Recherche Public - Gabriel Lippmann, Département Environnement et Agro-biotechnologies (EVA), 41 Rue du Brill, L-4422 Belvaux, Luxembourg.
4
Université catholique de Louvain (UCL), Louvain-la-Neuve, Belgium. Croix du Sud, 2 bte 16B-1348 Louvain-la-Neuve (Belgium)
Introduction
Over the last decade, studies on crop breeding showed that there is a close relation between leaf area during maturation and grain yield in wheat (Reynolds et al., 2000 ; Richards, 2000 in Blandino, 2009). Fungicides have been associated with yield increases due to the maintenance of the photosynthetic life of the canopy during grain filling (Dimmock, et al., 2002; Pepler et al., 2005). Flag leaf photosynthesis in wheat contributes to about 30–50% of the assimilates for grain filling (Sylvester-Bradley et al., 1990) and initiation of grain filling coincides with the onset of senescence. Therefore, photosynthesis of the flag leaf is crucial for the formation of the grain yield as well as the onset and rate of leaves senescence. The duration of the green leaf area of flag leaves is particularly important because it is the last leaf to senesce, it intercepts more light than lower leaves, and it is in closer vascular proximity to ears than lower leaves (Gooding et al., 2000). This last study also showed that the fractional decline in green leaf area of flag leaves can be adequately described by a Gompertz curve where just the rate of green leaf area decline (k) and the time of curve inflection (m or 37% green leaf area remaining) have to be estimated. However, studies dealing with wheat yield modelling based on Green Area Index (GAI) and relations from metrics which could be derived from the GAI decreasing curves are lacking. The aim of this study is to explore a simplified approach to model relations between wheat yield and GAI curves metrics at plot level.
Material and Methods The data
Field campaign was carried out in 2009 on about thirty wheat plots in France and in the G-D of Luxembourg. The data collection consists in phenology determination and taking hemispherical photography for GAI calculation. Weather data were gathered from weather stations within 1 km of the field sites. Luxembourg fields were included within a large project dealing with wheat diseases monitoring (El Jarroudi et al., 2009), and we took into account only control plots (no treatment) and plots with 2 and 3 fungicides treatments. French sites are all located into the Lorraine Region and are randomly chosen according to Earth Observation data acquisition and other criteria (such as field size, national representativeness of the region for wheat production).
Hemispherical images taken over the growth cycle were analysed by the CAN-EYE software (http://www.avignon.inra.fr/can_eye). The variable of interest for this study is the GAI. GAI decreasing curves are fitted by a modified Gompertz model and a logistic model developed by Gooding et al (2000), and metrics m and k are pulled out from them. Time period (expressed in growing degree days) begins at the date where GAI is equal to the maximum (GAIm). Thermal time is set to 0 when GAI=GAIm and then cumulated for the next days.
The models
Inputs used to model wheat yield estimate are observed yields, GAIm and metrics m and k derived for the two functions listed above. Two cases of multilinear regressions were done related to each curve-fitting function. Over all sites, plots taken into account for multilinear regression are those where yields are weighted. Metrics m and k are determined by least-squares non linear estimate of
STATISTICA (vers. 8). Other calculations (stepwise regression, and leave-one-out cross-validation) were carried out with SAS software (vers. 9.1.3 pack 2).
Results
Variances that could be accounted for (VAF) by the adjusted functions are established. Over all analyses, average value for both functions is around 96%.
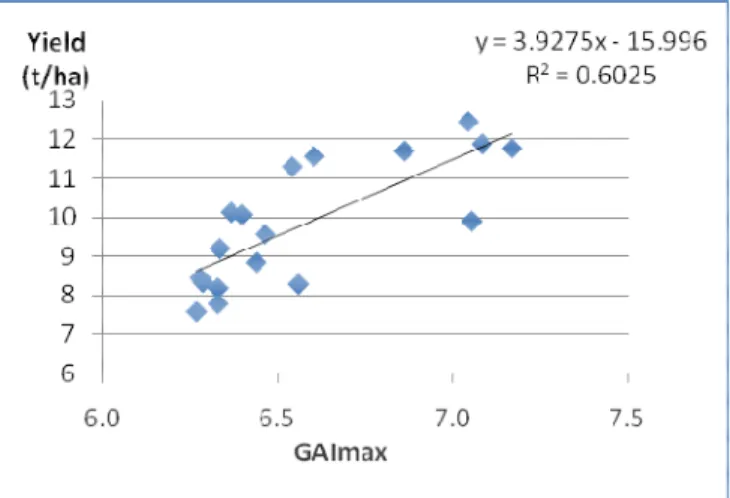
Analysis between yield and each parameter reveals weak correlations, excepted with GAIm where r²≈ 60% (fig. 1). Although this relation seems to be good, we note that a difference up to 3 tons/ha can be observed for a same GAIm value (i.e GAImax = 6.6). For a better yield estimate, multilinear regressions are performed. For both two cases of regression, four models can be estimated (table 1).
Fig.1. Relation between Observed yields and GAImax
With the first one, only one model is founded, while for the second, three models can be expressed.
Model 1 provides best characteristics as yield estimate model. As shown in figure 1, GAIm can explain around 60% of observed yield variance. By adding senescence rate kgomp in
this model, r² is improved to 78% (RMSE = 0.65 t/ha). For the second case of regression, model M2 can be chosen for yield estimate.
Discussion and conclusion
Considering differences which can exist between fields (varieties, soil properties, etc), this first result at plot level is very interesting. Using two ways to derive metrics from GAI decreasing curves, we found that wheat yield can be best estimated by the maximum of GAI and the senescence rate. Although the set of analysis refers to only one year of field experiments, results obtained can lead to further studies with longer time-series of yield and GAI. This kind of simple model (3 parameters) using information potentially available from remote sensing suits particularly well for regional wheat yield forecasting in operational systems. An analysis based on this approach will be upscaled at this level by the use of GAI values derived from Remote Sensing data.
References
Blandino M. and Reyneri A (2009). European Journal of Agronomy 30(4): 275-282
Dimmock JPRE and Gooding MJ. (2002). The Journal of Agricultural Science 138(01): 1-16
El Jarroudi M., Delfosse P, Maraite H, Hoffmann L and Tychon B (2009). Plant Disease 93(10): 983-992.
Gooding MJ, Dimmock JPRE., France J et Jones SA (2000). Annals of Applied Biology
136(1): 77-84
Pepler S, Gooding MJ, Ford KE, Ellis RH et Jones SA (2005). European Journal of Agronomy 22(4): 405-416.
Sylvester-Bradley R, Scott, RK and Wright CE (1990). Home-Grown Cereals Authority Research Review. 18.
Model Terms RMSE
(t/ha) R²aj RRMSE M1 GAIm, kgomp 0.65 0.78 6.6% M2 GAIm, klog, mlog 0.71 0.71 7.5% M3 GAIm, mlog 0.77 0.60 8.4% M4 GAIm, klog 0.74 0.67 7.6%