HAL Id: hal-01427322
https://hal-lara.archives-ouvertes.fr/hal-01427322
Submitted on 5 Jan 2017
HAL is a multi-disciplinary open access archive for the deposit and dissemination of sci-entific research documents, whether they are pub-lished or not. The documents may come from teaching and research institutions in France or abroad, or from public or private research centers.
L’archive ouverte pluridisciplinaire HAL, est destinée au dépôt et à la diffusion de documents scientifiques de niveau recherche, publiés ou non, émanant des établissements d’enseignement et de recherche français ou étrangers, des laboratoires publics ou privés.
Bearing force distribution over knee protectors
P. Marchal, M. Jacques
To cite this version:
P. Marchal, M. Jacques. Bearing force distribution over knee protectors. [Research Report] Notes scientifiques et techniques de l’INRS NS 318, Institut National de Recherche et de Sécurité (INRS). 2014, 19 p., ill., bibliogr. �hal-01427322�
NS 318
Bearing force distribution
over knee protectors
Bearing force distribution
over knee protectors
Patrice Marchal
Michel Jacques
Bearing force distribution over
knee protectors
Abstract
Many work situations require the use of knee protectors, which are tested according to European Standard EN 14404. The objective of this study was to analyse the relevance of certain parameters for testing bearing force distribution, in particular the three force measurement points, the artificial test knee used, and the limit value of 30 N.
The three sensor positions defined in the standard do not guarantee that the maximum pressure will be measured. The grid of pressure sensors implemented in this study maps the bearing force distribution fully and immediately.
Three artificial knees of different sizes and a simplified knee were defined and compared: depending on the type of knee protector, the force distribution can vary. But, the pressures obtained with the simplified knee are within the range of those recorded with the other knees. Use of the simplified knee can therefore be considered in place of the currently used test knee, which is difficult to fabricate and is not representative of morphological diversity.
Finally, based on the sample group of protectors evaluated during subjective tests, we can conclude that the 30 N limit specified by the standard is consistent with the degree of comfort felt by the test subjects.
Bearing force distribution over
knee protectors
Contents
1. Reasons and objectives ... 5
2. Equipment and method ... 6
2.1. Knee protector ... 6
2.2. Relevance of the 3 measurement points ... 7
2.3. Representativeness of the knee ... 7
2.3.1. Producing the knees representative of different sizes and the simplified knee .. 7
2.3.2. Measurements of the force distribution with the different knees ... 8
2.4. Validation of the maximum force specified by the standard ... 8
2.4.1. Choice of the test position ... 9
2.4.2. Evaluation of the knee protectors ... 9
3. Main Results ... 10
3.1. Validation of the grid of pressure sensors ... 10
3.2. Comparison of the maximum pressure ... 11
3.3. Representativeness of the knees ... 12
3.3.1. Artificial knees representative of different sizes ... 12
3.3.2. Comparative measurements with the 3 knees and with the simplified knee .... 12
3.4. Validation of the specification ... 15
4. Discussion and conclusions ... 17
1. Reasons and objectives
Prepatellar bursitis is a periarticular disorder that produces an inflammation of the subcutaneous tissue of the bearing zones of the knee where weight is put during kneeling. It mainly affects people who often work on their knees (floor tilers, floor covering fitters, electricians, roofers, plumbers, etc.). In 2012, about 400 occupational disease cases were declared in France (Table N 57D).
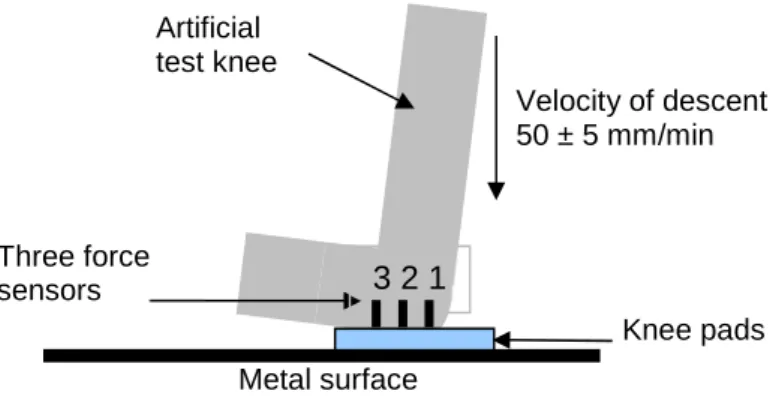
To limit these risks, workers are equipped with knee protectors that are tested according to European Standard EN 14404 [1]. That standard defines the specifications and testing methods for knee protectors. In particular, it gives a limit value for the bearing force at the knee and a test method for measuring it. The test consists in applying a force of 750 N to an artificial test knee equipped with the knee protector to be tested. Three force sensors are disposed on the knee and they make it possible to measure the force distribution, which should not exceed 30 N per sensor (cf. Figure 1).
For the tests, the standard defines a reference knee, whose dimensions were determined by moulding on a human subject. We do not know the criteria that led to that subject being chosen, and, to our knowledge, no validation of that knee was performed to verify that it is representative in terms of force distribution and of bearing contact area. We might question whether a human knee exists that is representative of an average population, and whether it is possible to design a knee with geometrical shapes that are simple and readily reproducible, and with which results can be obtained that are fully relevant.
The standardised method of measuring the force distribution specifies only 3 force sensors located at the most critical places, but that method does not make it possible to obtain sufficient mapping of the force distribution, and in particular to determine the maximum value of the force, in the zone in which the bursitis is likely to develop. For example, if the surface of the protector is designed to reduce the pressure at the 3 sensors, a protector made of a material of poor quality would comply with the standard, despite not procuring satisfactory comfort for users. Given the variability of knees and of the places that are critical for prepatellar bursitis, this study takes into account the maximum force, regardless of the place at which it is applied.
The limit value of 30 N was defined from a consensus between the various participants in the standardisation group on the basis of knee protectors that were deemed by the group to be comfortable, without a study being conducted on subjects to endorse that value.
Figure 1: diagrammatic view of the bench for measuring the force distribution.
Metal surface Artificial test knee Velocity of descent 50 ± 5 mm/min Knee pads Three force sensors 3 2 1
NS 318, April 2014
The objective of this study is to analyse the relevance of the following test parameters:
- the 3 positions of the points at which the bearing force is measured and the
measurement means used;
- the artificial test knee defined in the standard; and
- the limit value of 30 N.
The relevance of the other parameters of that test is not called into question.
2. Equipment and method
Prior to the study, and in collaboration with INRS's physiology experts, a bibliographic search was conducted to identify studies on prepatellar bursitis and the means for preventing it [2, 3].
All that was found were means for treating the disease. We did not identify any study showing a relationship of cause and effect between the kneeling position without protectors and the appearance of prepatellar bursitis.
It appears relevant to consider that the lower and the wider-spread the pressure on the knee, the more limited the risk of prepatellar bursitis will be. But in the absence of scientific data on the topic, validation of the specification of the standard was based on the degree of comfort felt by the test subjects.
In the remainder of this document, all of the values given by the force sensors are converted into pressure so that it is possible to compare the results of the various measuring means. Thus, the limit value of 30 N defined by Standard EN14404 and associated with a force sensor whose bearing contact area is constituted by a disk that is 1 cm in diameter corresponds to a pressure of 38 N/cm².
2.1. Knee protector
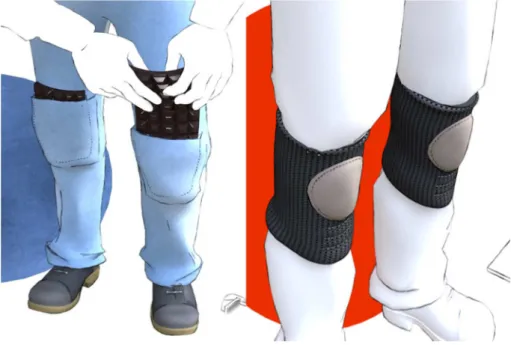
A sample group of 71 protectors was selected to cover a broad range of force distribution and of forms (shaped or otherwise) available on the market. They are made of fabrics, foam or rubber with or without shells (cf. Figures 2 and 3).
In this study, we considered two main families of knee protectors:
- plane homogeneous foams of constant thickness; and
- shaped knee protectors.
Of the 71 protectors, 10 were selected to be evaluated by subjects. They had to be representative of the forms available on the market and of the various fastening means. They also had to make it possible to propose a force distribution, as measured using the protocol defined by the standard, that was very wide: the maximum pressures lay in the range 15 N/cm² to 145 N/cm².
2.2. Relevance of the 3 measurement points
The objective of this phase was to determine the maximum pressure on a sample group of knee protectors, so as to verify whether or not it corresponds to the pressure recorded at one of the positions of the three measurement points defined in the standard.
It was necessary to find means for measuring the force or pressure distribution over the entire bearing contact area of the knee, so that it was possible to establish mapping of the distribution, and to determine the maximum of the force and the position of that maximum. Furthermore, those means needed to be usable not only with an artificial test knee, but also during evaluations with the test subjects.
The means chosen were constituted by a 16 cm x 16 cm grid of pressure sensors that was equipped with 1024 pressure sensors whose sides were 5 mm in length. Those means offered the advantage of operating with the Nowell system that is present at INRS, and that had already been evaluated through other studies.
Measurement with the grid as compared with the measurement method recommended by Standard EN14404 was validated with knee protectors of different designs (insert pads, and shaped knee protectors), by superposing the grid of pressure sensors on the standardised knee as equipped with the three force sensors.
During the comparison of that grid with the 3 force sensors, the maximum pressure was recorded.
2.3. Representativeness of the knee
The objective of this phase was to evaluate the influence of the size and of the shape of the knee on the distribution of the bearing force, and thus on the maximum pressure. For this purpose, the following were defined and fabricated:
- three knees of different sizes and having shapes representative of human knees; and
- a simplified knee made up of simple geometric shapes that were easy to represent.
Then, the measurements of the force distribution were taken on knee pads with the 4 knees in succession.
2.3.1. Producing the knees representative of different sizes and the simplified knee
The objective was to define and to make 3 knees that were representative of different sizes: large, medium, and small.
For this purpose, the right knees of 40 subjects of varied morphologies were digitized by being scanned. Their heights varied from 1.57 m to 1.90 m, and their weights varied from 51 kg to 126 kg. A theoretical mean knee was computed by taking the mean of the 40 scans. Each scanned knee was then compared with the theoretical mean knee, in order to find the one that was closest to the mean: that knee was then taken as being the representative mean knee and was fabricated.
NS 318, April 2014
In the same way, a knee representative of the small sizes was defined on the basis of the 20 smallest scanned knees, and a knee representative of the large sizes was defined on the basis of the 20 largest knees.
The dimensions of the simplified knee were defined on the basis of the representative mean knee.
2.3.2. Measurements of the force distribution with the different knees
The force distribution was measured with the 4 knees (small, medium, and large size knees, and the simplified knee) on various foams and knee protectors, with the defined grid of pressure sensors. The other test parameters remained unchanged and were those of Standard EN 14404.
The following were recorded:
- the pressure values at the 3 measurement positions defined in the standard: these
positions were determined on the new knees in the same manner as on the
standardised knee: the position of the 2nd force sensor, in a central point, is the first
surface that comes into contact with the floor; the other 2 positions are on the axis of the leg, on either side of the central point and placed at 2.5 cm therefrom;
- the value of the maximum pressure.
Measurements of the force distribution on plane foams
In a first stage, the measurements were taken on the plane and homogeneous foams by applying the force of 750 N regardless of the knee. The pressures recorded with the different knees on the same foam were compared.
In a second stage, considering that the bearing force is a function of subject morphology, measurements were taken while modulating the bearing force as a function of knee size: it was kept at 750 N with the large knee and it was adjusted with the other knees until it reached the maximum pressure obtained when measuring with the large knee.
The bearing forces obtained with the small and medium sizes and with the simplified knee were compared with theoretical forces reduced in proportion to the mean weights of the subjects. Considering that the force of 750 N applied to the large knee was proportional to the mean weight of the 20 heaviest test subjects, the theoretical forces for the other knees were defined as follows:
- for the medium size and for the simplified knee, it was proportional to the mean
weight of all of the subjects;
- for the small size, it was proportional to the mean weight of the 20 lightest subjects.
Measurements of the force distribution on shaped knee protectors
The measurements were taken on a series of shaped knee protectors, by applying the standardised force of 750 N, in order to compare, for the same protector, the pressures obtained with the different knees.
2.4. Validation of the maximum force specified by the standard
The object of this phase was to validate the limit of 30 N specified in the standard or to redefine it on the basis of evaluation by test subjects. The principle consisted in evaluating the degree of comfort afforded by the protectors as felt by the subjects, and, in parallel, in measuring the maximum pressure at the knee. The limit value selected had to be positioned in such a manner that only those knee protectors that were deemed to be comfortable could be deemed to conform.
The protocol and the measurement means had to be defined:
- choice and duration of the kneeling positions;
- sample group of test subjects;
- comfort scale;
- number and period of the measurements and notations; and
- means for measuring the pressure.
2.4.1. Choice of the test position
A kneeling position, representative of a working situation and inducing a maximum weight on the knees, was defined. It had to be stable and balanced (from front to back and from right to left) in order to limit the variations in bearing pressure on each of the knees during the tests, so as to avoid differences during the measurements.
Various postures, shown diagrammatically in Table 1, were evaluated with 10 test subjects. Their heights varied from 1.72 m to 1.85 m, and their weights varied from 64 kg to 96 kg. The distribution of the weight over the knees was measured using the following method:
- the subjects were weighed; and
- they successively took up the positions indicated in Table 1, and each knee of the
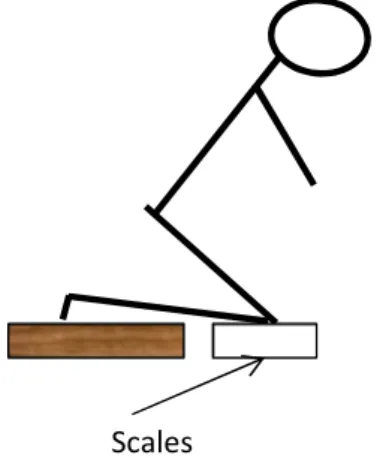
test subjects was placed on scales (cf. Figure 4) in order to record the distribution of the weight over each of the knees.
Table 1: diagrammatic representation of the kneeling positions.
Figure 4: kneeling position for measuring the distribution over each of the 2 knees.
2.4.2. Evaluation of the knee protectors
A test protocol was established: it simulated the working conditions in the defined kneeling position. Half of the 10 test subjects were students, and therefore did not have any experience with knee protectors, and the other half were trade professionals using the protectors regularly.
The maximum pressure on the knee was measured and the degree of comfort felt was recorded at 3 different times:
P1 P2 P3 P4 P5 P6
NS 318, April 2014
- T1: on kneeling down;
- T3: after 3 minutes of kneeling on both knees without moving;
- T6: after 6 minutes, with, between T3 and T6 a series of movements defined in the
protocol having been made by the test subjects.
The degree of comfort felt by the test subjects was evaluated on a scale from 0 (the least comfortable) to 10 (the most comfortable).
For measuring the maximum pressure, the above-defined grid of pressure sensors was positioned between the knee of the subject and the knee protector.
3. Main Results
3.1. Validation of the grid of pressure sensors
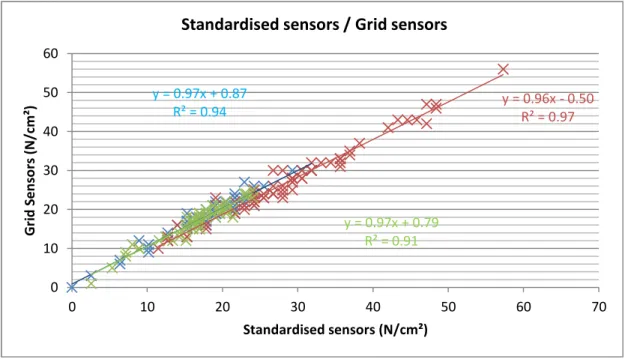
For each of the three measurement positions defined by the standard (in blue: position 1; in red: position 2; and in green: position 3), Figure 5 shows the correlation between the pressure measurements obtained by means of the three standardised force sensors and the pressure measurements obtained with the grid of pressure sensors, on the entire sample group of the 71 protectors.
Figure 5: comparison of the grid of pressure sensors with the force sensors defined in the standard.
We can observe that this correlation does not depend on the type of knee protector, or on the position of the force sensor 1, 2, or 3. All three of the coefficients of determination (R²) are greater than 0.9 and all three of the slopes of the linear regression lines are very close to 1 with ordinates at the origin lying in the range 0.9 to -0.5.
The correlation between the set of measurements obtained with the three force sensors and those obtained with the grid of pressure sensors is high. The coefficient of determination R² is equal to 0.96. The slope of the line is 0.91 with an ordinate at the origin equal to 1.6. The grid of pressure sensors was thus used for the remainder of the study, i.e. with the various artificial test knees studied and with the human subjects.
y = 0.97x + 0.87 R² = 0.94 y = 0.96x - 0.50 R² = 0.97 y = 0.97x + 0.79 R² = 0.91 0 10 20 30 40 50 60 0 10 20 30 40 50 60 70 G ri d S e n so rs ( N /c m ²) Standardised sensors (N/cm²)
3.2. Comparison of the maximum pressure
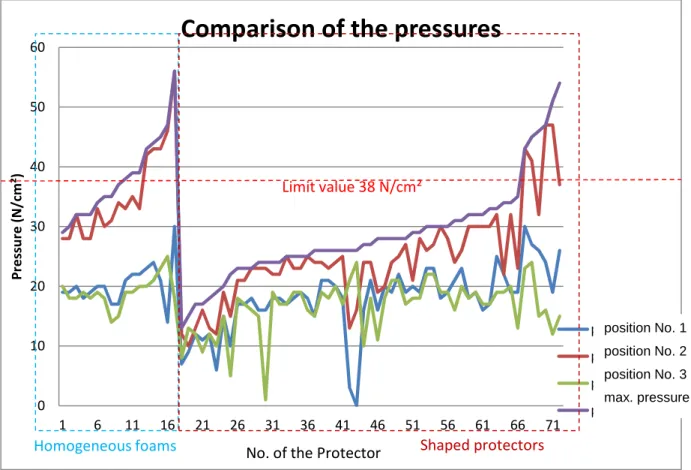
For a sample group of knee protectors, Figure 6 gives the pressure values obtained with the grid of sensors at the three measurement positions defined by the standard, and the maximum value.
Figure 6: comparison of the maximum pressure with the pressures at the positions defined by the standard.
The maximum value of the pressure was very often higher than the values measured at the three positions defined by the standard.
The protectors numbered from 1 to 17 were plane homogeneous foams of constant thickness, and the maximum pressure was, in general, located in the vicinity of sensor No. 2. On the other knee protectors numbered from 18 to 71, the surfaces had, for example, deep grooves, projections, or holes, and the maximum pressure could be located at positions different from the positions of the measurement points defined by the standard.
These curves confirm that the measurement positions specified by the standard do not make it possible to guarantee that the maximum value will be found regardless of the protector. For the majority of the products, their conformity was not called into question: of the 72 protectors tested, 13% were found not to conform when the test protocol defined by the standard was applied, and 18% appeared not to conform when maximum pressure was taken into account. The three protectors for which the conformity is called into question are samples Nos. 12, 69, and 72: they are provided with large grooves for improving their flexibility. If, during the measurement, the knee protector finds itself positioned in such a manner that the groove faces the force sensors, the measured pressure is very low and underestimates the real pressure on the knee.
0 10 20 30 40 50 60 1 6 11 16 21 26 31 36 41 46 51 56 61 66 71 P re ss u re ( N /c m ²)
Comparison of the pressures
position n°1 position n°2 position n°3 pression max.
No. of the Protector
Limit value 38 N/cm² Shaped protectors Homogeneous foams position No. 1 position No. 2 position No. 3 max. pressure
NS 318, April 2014
The force recorded at sensor 1 (cf. Figure 1) was systematically lower than the pressure at sensor 2, or than the pressure at sensor 3. The zero pressure obtained in the zone of sensor No. 1 with protector No. 43 is due to its particular shape that eliminates the bearing pressure at the front of the knee and shifts it to the tibia.
3.3. Representativeness of the knees
3.3.1. Artificial knees representative of different sizes
The dimensions of the scanned knees varied considerably.
On the basis of the scans of 40 real knees, three mean knees representative of large, medium, and small sizes were fabricated. The choice of the 20 smallest and the 20 largest knees was made on the basis of the intercondylar distance. It lay in the range 8 cm to 12 cm. After the three knees had been fabricated, a knee of simplified shapes and that was easy to make was defined for a low cost (less than €150).
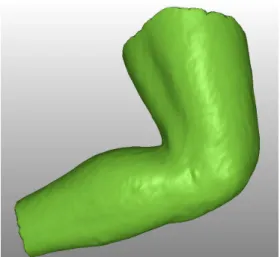
Figure 7 gives an example of a modelled knee.
Figure 7: example of a modelled knee.
3.3.2. Comparative measurements with the 3 knees and with the simplified knee
The comparative maximum pressure measurements as a function of the various knees can be broken down into two main families of protectors.
Plane foams of constant thickness
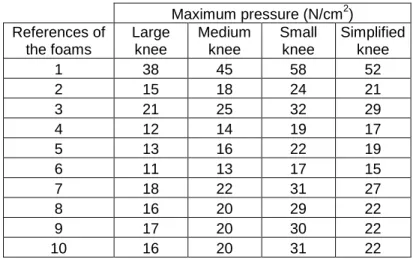
Table 2 gives the maximum pressure recorded during the measurements on the different foams with the knees of different sizes and with the simplified knee while applying the force of 750 N.
Maximum pressure (N/cm2) References of the foams Large knee Medium knee Small knee Simplified knee 1 38 45 58 52 2 15 18 24 21 3 21 25 32 29 4 12 14 19 17 5 13 16 22 19 6 11 13 17 15 7 18 22 31 27 8 16 20 29 22 9 17 20 30 22 10 16 20 31 22
Table 2: maximum pressures obtained with the different knees for a bearing force of 750 N.
We can observe that the foams conforming to the standard remain conforming regardless of the artificial knee used, and foam No. 1 that did not conform with the large knee remained non-conforming with the other three knees.
For the same bearing force, the maximum pressure was a function of the size of the knee: the smaller the knee, the higher it was.
Regardless of the knees, including the simplified knee, the correlation between the maximum pressure values recorded on the various foams with the various knees was high: the coefficient of determination R² was greater than 0.95.
The pressures recorded with the simplified knee lay between the pressures recorded with the small knee and the pressures recorded with the medium-size knee.
Measurements were taken while modulating the bearing force as a function of knee size. Table 3 gives the force to be applied to the various different knees in order to obtain the maximum pressure obtained with the large knee with a bearing force of 750 N.
References of the foams Maximum pressure (N/cm2) Bearing force (N) Large knee Medium knee Small knee Simplified knee 1 41 750 650 470 580 2 16 750 620 440 570 3 23 750 610 450 560 4 12 750 580 430 540 5 14 750 610 400 530 6 12 750 600 440 540 7 19 750 610 440 540 8 16 750 620 410 580 9 17 750 640 430 580 10 17 750 620 420 580
NS 318, April 2014
Table 4 gives:
- firstly, the theoretical forces that should be applied to the knees of different sizes in
order to take account of the mean weight of the subjects corresponding to that size; they were computed by taking as a reference the value of 750 N of the standard that corresponds to the large knee (mean weight of 82 kg), and then for the other two knees by applying the rule of three: F = 750 N x Mean Weight / 82;
- secondly, the mean force to be applied to the various knees in order to obtain the
same maximum pressure. These values are indicated in Table 3. Mean weight
(kg)
Theoretical force
(N)
Mean force applied (N)
Small knee 20 smallest
subjects 61 550 433
Medium knee All of the
subjects 71 650 616
Large knee 20 largest
subjects 82 750 750
Table 4: comparison between the theoretical forces to be applied to the different knees and the force giving the same maximum pressure.
These tables show that if the size of the knee decreases, and even if the bearing force is reduced so as to be proportional to the weights of the corresponding subjects, the reduction in the bearing contact area is such that the maximum pressure recorded is greater than the maximum pressure recorded with a knee of larger size.
Shaped knee protectors a) Maximum pressure
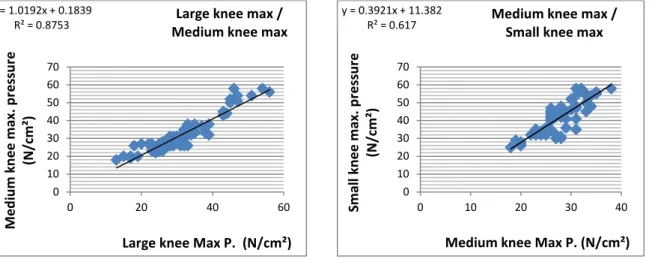
Figures 8 and 9 give examples of lines of correlation between the maximum pressures obtained with the various different knees and with the sample group of knee protectors.
Figure 8: correlation between the maximum pressures with the knees of large and medium sizes.
Figure 9: correlation between the maximum pressures with the knees of medium and small sizes.
The correlation between the knees of large and medium sizes and the simplified knee is relatively good: the R² coefficient is approximately in the range 0.8 to 0.9. The slopes of the linear regression lines are close to 1.
y = 1.0192x + 0.1839 R² = 0.8753 0 10 20 30 40 50 60 70 0 20 40 60 M e d iu m k n e e m a x . p re ss u re (N /c m ²)
Large knee Max P. (N/cm²) Large knee max / Medium knee max
y = 0.3921x + 11.382 R² = 0.617 0 10 20 30 40 50 60 70 0 10 20 30 40 S m a ll k n e e m a x . p re ss u re (N /c m ²)
Medium knee Max P. (N/cm²) Medium knee max /
Conversely, the correlation of the small knee with the other three is poor, the values for R² decrease to 0.6 and the slopes of the linear regression lines can reach 0.4. The different distribution of the bearing force can be explained by the bonier shape of the small knee.
b) Pressures recorded at the positions defined in the standard
In the same way, analyses made it possible to compare the pressures recorded at the 3 measurement positions of the standard using the various different knees.
At the level of sensor 2, the correlations are correct: the R² coefficients vary in the range 0.8 to 0.9. In particular, the slopes a and b of the line of linear regression between the medium knee and the simplified knee are close to 1: the simplified knee gave values comparable to those obtained with the medium-size knee. This good correlation can be explained by the fact that, in general, the position of this sensor corresponds to the first point of bearing contact of the knee.
At the sensors 1 and 3, the correlations are lower: the R2 coefficients vary in the range 0.4 to 0.9. These results can be explained by a distribution of the pressure as function of the respective shapes of the knee protector and of the knee. That was observed in particular on certain knee protectors having a particularly large reinforcement at the tibia so as to limit the bearing pressure at the patella. That leads to the bearing points being shifted, that shift varying from one knee to another, especially with the small knee, which has a more bony and more knobbly shape.
3.4. Validation of the specification
The position for performing the subjective tests was chosen on the basis of 3 criteria:
- the percentage of the weight on the knee should be as high as possible;
- the position should be as stable as possible; and
- the position should be as repeatable as possible by the various subjects.
Position 2 shown in Table No. 1 was selected. It gives the lowest standard deviation, with a weight on the knees of close to 50% of the weight of the individual. It corresponds to the torso and the legs being perpendicular to the floor, to the arms being down along the body, and to the head being up.
It should be noted that the value for the bearing force of 750 N that is specified by the standard corresponds to the pressure on the knee of an individual weighing about 120 kg in the down-on-one-knee position as in position No. 5.
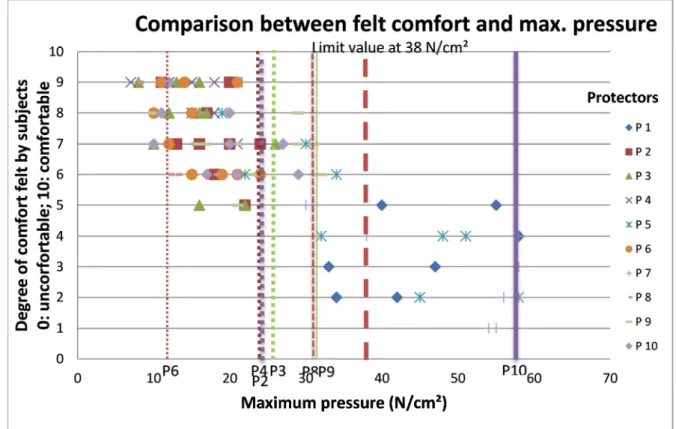
Figure 10 shows the comparison of the degree of comfort felt by the test subjects relative to the maximum pressure recorded on their knee for each subject and for the 10 protectors chosen. The vertical lines show the maximum pressure measured on the protector with the test bench specified by the standard.
The limit as from which the evaluations of the degree of comfort felt by the subjects were considered as acceptable degrees of comfort was set at 5. That limit was defined arbitrarily. This information was not given to the test subjects.
In order to give them some reference points, the first protector they evaluated gave very good force distribution values using the standardised test and the second they evaluated gave very poor ones. The subjects were free to evaluate them on a scale of 0 to 10.
NS 318, April 2014
Figure 10: comparison between the degree of comfort felt and the maximum pressure.
The protectors P1, P5, and P7 that were considered to be poor by the test subjects gave, with the knees of the subjects, pressure values that were high, lying in the range 19 N/cm² to 58 N/cm² (58 N/cm² being the maximum pressure it is possible to measure with the grid of pressure sensors) and means that lay in the range 38 N/cm² to 53 N/cm². The measured pressures were thus consistent with the degree of comfort felt by the subjects, who evaluated them as being uncomfortable. Furthermore, when those three protectors were measured on the test bench using the force sensors defined by the standard, they gave maximum pressures lying in the range 85 N/cm² to 145 N/cm² and thus they do not conform to Standard EN 14404.
The 6 knee protectors P2, P3, P4, P6, P8 and P9 were considered to be comfortable by the subjects. The pressures measured with the knees of the subjects were less than 38 N/cm² except for one measurement with a subject that was 50 N/cm². The values obtained on the standardised test bench were also less than 38 N/cm².
The protector P10 does not conform to Standard EN 14404 even though it was evaluated as comfortable by the test subjects. The maximum pressure measured during the subjective tests was 37 N/cm², i.e. a value less than the limit of 38 N/cm². The pressure measured during the standardised test was considerably higher than the pressure recorded on the knees of the subjects. The standardised force of 750 N corresponds to the force on the knee of an individual weighing about 120 kg in the kneeling down on one knee position, which is an extreme situation that was not reached during the tests on the test subjects.
To recapitulate:
- 6 knee protectors conforming to the standard were deemed comfortable by the
subjects;
- 3 knee protectors deemed uncomfortable by the subjects did not conform to the
standard; and
4. Discussion and conclusions
The objective of this study was to analyse the relevance of the parameters for testing force distribution that are defined in Standard EN 14404, in particular:
- the positions of the three points at which the bearing force is measured;
- the artificial test knee defined in the standard; and
- a limit value of 30 N, for force sensors whose measurement area is constituted by
a disk having a diameter of 1 cm.
This study shows that, for the plane and homogeneous foams, the maximum pressure is often situated at sensor No. 2. Conversely, whenever the protectors have shapes that, for example, include grooves or projections in order to shift the bearing points, the maximum pressure can be situated outside the 3 measurement positions defined by the standard. The difference between the maximum pressure and the measurements taken at the standardised positions may be considerable depending on the shapes of the knee protectors: it is therefore advantageous to have the possibility of measuring that pressure at any point over the knee.
The grid of pressure sensors used for this study makes it possible to procure immediate mapping of the force distribution.
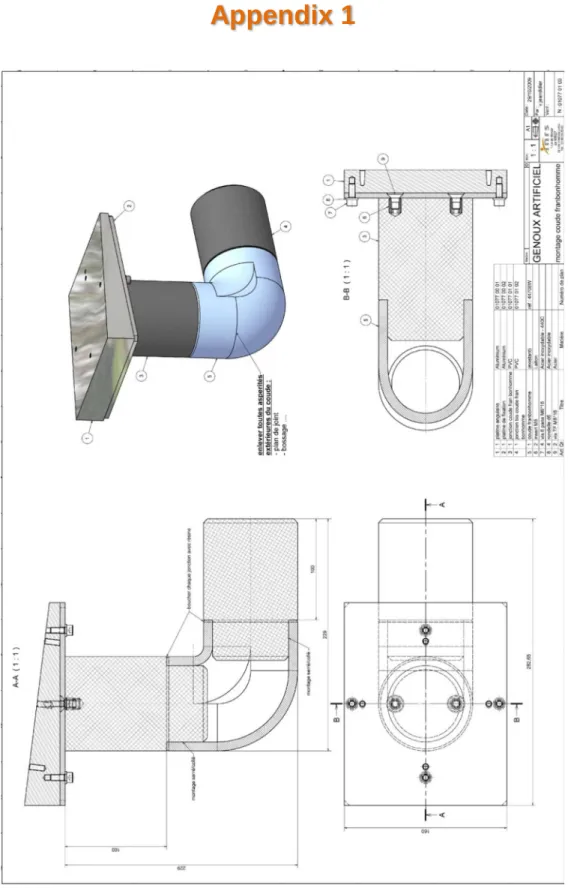
Three knees representative of large, medium, and small sizes were defined on the basis of scans of 40 real knees. After the three knees had been fabricated, a knee of simplified shapes (cf. Appendix 1) and that was easy to make was defined for a low cost.
Comparing the maximum pressures obtained with the three representative knees and with the simplified knee gave a good correlation when the measurements were taken on plane foams, whereas the correlation became relatively poor with protectors having a variety of shapes.
Generally, when the same bearing force is applied to knees of different sizes, the smaller the knee, the higher the pressure is. This can be explained by the smaller bearing contact area when the size of knee is smaller.
When the size of the knee decreases, and even if the bearing force is reduced so as to be proportional to the weights of the corresponding subjects, the reduction in the bearing contact area is such that the maximum pressure recorded is greater than the maximum pressure recorded with a knee of larger size. Relatively speaking, the measurements with a smaller knee and a lower bearing force give pressures higher than measurements with a larger knee and a higher bearing force. We can thus note that it was not relevant, in the normalised method, to take a knee of very large size that distributes the pressures better than a smaller knee does, but, conversely, the specified bearing force of 750 N would appear to be higher than the real weight bearing on the knee.
The pressures obtained with the simplified knee are within the range of those recorded with the other knees, and in particular with the medium size knee. Use of the simplified knee may therefore be considered in place of an artificial knee that is difficult to fabricate and that is not representative of morphological diversity.
A comfort evaluation on a sample group of 10 knee protectors was conducted by 10 test subjects in order to validate the limit specified by the standard. That evaluation made it possible to arrive at the general conclusion that the specified limit of 30 N for a force sensor whose bearing contact area is constituted by a disk having a diameter of 1 cm is consistent: it made it possible to distinguish between the protectors recognised as comfortable and appropriate by the test subjects.
NS 318, April 2014
5. Bibliography
[1] Standard EN 14404: 2010: “Personal protective equipment – Knee protectors for work
in the kneeling position”.
[2] The Swedish Construction Industry's Organisation for Work Environment Safety and
Health (BYGGHÄLSAN), presentation for the XXth International Congress on
Occupational Health, Cairo, 25 September to 1 October 1981.
[3] GONELLA M., LORTIE M., DENIS D. - Prévenir les risques dans les petites
entreprises : intervenir grâce aux équipements de protection individuels chez les poseurs de revêtements de sol : in Journées de réflexion scientifique de l'Institut santé et société : La recherche intervention en santé à l'UQAM (St-Paulin, Canada), 23-24 April 2007.