Standing economy: does the heterogeneity in the energy
cost of posture maintenance reside in differential patterns
of spontaneous weight-shifting?
Jennifer L. Miles-Chan1 · Elie-Jacques Fares1 · Redina Berkachy2 ·
Philippe Jacquet1,3 · Laurie Isacco4 · Yves Schutz1 · Jean-Pierre Montani1 · Abdul G. Dulloo1
Results Despite heterogeneity in EE response to
steady-state standing, no differences were found in the amount or pattern of spontaneous weight-shifting between the two phenotypes. Whilst experimentally induced weight-shift-ing resulted in a mean EE increase of only 11% (range: 0–25%), intermittent leg/body displacement increased EE to >1.5 METs in all participants.
Conclusions Although the variability in
spontane-ous weight-shifting signatures between individuals does not appear to underlie heterogeneity in the energy cost of standing posture maintenance, these studies underscore the fact that leg/body displacement, rather than standing pos-ture alone, is needed to increase EE above the currently defined sedentary threshold.
Keywords Energy expenditure · Standing · Posture · Weight-shifting · Sedentary behaviour
Abbreviations
ANOVA Analysis of variance BMI Body mass index BR Breathing rate EE Energy expenditure
EI_WS Experimentally induced weight-shifting FFT Fast Fourier transformation
HR Heart rate
MET Metabolic equivalent PCA Principal component analysis RER Respiratory exchange ratio SEM Standard error of the mean SP_WS Spontaneous weight-shifting
WS Weight-shifting
Abstract
Purpose Due to sedentarity-associated disease risks,
there is much interest in methods to increase low-intensity physical activity. In this context, it is widely assumed that altering posture allocation can modify energy expenditure (EE) to impact body-weight regulation and health. How-ever, we have recently shown the existence of two distinct phenotypes pertaining to the energy cost of standing—with most individuals having no sustained increase in EE dur-ing steady-state standdur-ing relative to sittdur-ing comfortably. Here, we investigated whether these distinct phenotypes are related to the presence/absence of spontaneous “weight-shifting”, i.e. the redistribution of body-weight from one foot to the other.
Methods Using indirect calorimetry to measure EE in
young adults during sitting and 10 min of steady-state standing, we examined: (i) heterogeneity in EE during standing (n = 36); (ii) EE and spontaneous weight-shifting patterns (n = 18); (iii) EE during spontaneous weight-shift-ing versus experimentally induced weight-shiftweight-shift-ing (n = 7), and; (iv) EE during spontaneous weight-shifting versus intermittent leg/body displacement (n = 6).
Jennifer L. Miles-Chan [email protected]
1
Department of Medicine/Physiology, University of Fribourg, Chemin du Musée 5, 1700 Fribourg, Switzerland
2 Department of Informatics, University of Fribourg, Fribourg,
Switzerland
3
Department of Plant Molecular Biology, University of Lausanne, Lausanne, Switzerland
4 EA3920 and EPSI Platform, Bourgogne Franche-Comté
University, 25000 Besançon, France
http://doc.rero.ch
Published in "European Journal of Applied Physiology 117(4): 795–807, 2017"
which should be cited to refer to this work.
Introduction
With the health risks associated with sedentary behav-iour now firmly established, independently of regular, moderate-to-vigorous exercise (Hamilton et al. 2007; Hen-son et al. 2016; Schmid et al. 2015), there is much inter-est concerning incorporating and/or maximising low-level physical activities in our daily routines. As such, standing, either intermittently (Thorp et al. 2015) or for more pro-longed periods [i.e. at standing workstations (Tudor-Locke et al. 2014)], is now widely promoted as a means to mini-mise the risk for sedentary-related disease (Henson et al.
2016; Wijndaele and Healy 2016). Indeed, several stud-ies have shown that interrupting sitting with intermittent standing increases energy expenditure (EE) (Judice et al.
2016; Levine et al. 2005). However, such studies often require participants to stand motionless (Judice et al. 2016; Levine et al. 2005), thus imposing restriction on the low-level movements (e.g. spontaneous weight-shifting) that naturally occur during standing, or are focused on the ener-getic cost of the postural transition (Hatamoto et al. 2016; Judice et al. 2016) or a combination of postural transitions and low-level ambulation (Bailey et al. 2016; Swartz et al.
2011) rather than that of posture maintenance per se. In contrast, we have recently shown the existence of two distinct phenotypes pertaining to the energy cost of stand-ing—with the majority of individuals having little increase (<5%), or no sustained increase in EE during steady-state standing relative to sitting comfortably (i.e. “energy-sav-ers”), and only ~20% of individuals showing a sustained increase (>5%) in energy expenditure across a 10-min standing period (i.e. “energy-spenders”) (Miles-Chan et al.
2013). However, the underlying metabolic and psychomo-tor basis of this heterogeneity is unknown.
In daily-life, standing is rarely performed rigidly motionless. Instead body weight is often redistributed from one foot to the other to minimise discomfort or maintain postural balance. This small, often subconscious displace-ment is termed “spontaneous weight-shifting” (WS), and has been well characterised in relation to aging and dis-ease [e.g. brain and spinal injury (Kitatani et al. 2016; Lemay et al. 2013), Parkinson’s disease (van den Heuvel et al. 2016), cerebral palsy (Rojas et al. 2013)], but little is known regarding variability in spontaneous WS in young, healthy adults, nor how this variability relates to variability in energy cost.
In the present study, we aimed to determine whether or not the two distinct EE phenotypes observed during stand-ing could be related to the presence/absence of spontane-ous WS. Secondly, in order to determine an activity level required to achieve a 50% increase in EE (i.e. 1.5 METs)— the commonly described sedentary behaviour threshold (Mansoubi et al. 2015; Sedentary Behaviour Research
Network 2012)—we compared the energy cost of spontane-ous WS to that of experimentally induced weight-shifting and minimal low-level ambulation.
Methods
Overall, 44 healthy young adults participated across the 3 studies described below, with 5 individuals participating in both Study I and II. The sample size for Study I was calcu-lated using an online calculator ( http://www.statisticalsolu-tions.net/calculators.php) and data obtained from previous investigations by our laboratory (Miles-Chan et al. 2013; Monnard and Miles-Chan 2017). As Studies Ib and II were exploratory studies, no data previous data were available to conduct a priori sample size calculations. Study III was designed to have sufficient power (α = 0.05, β > 80%) to detect a 50% increase in EE relative to resting (seated) EE based on mean resting EE values and variability measured in our laboratory during previous studies (Miles-Chan et al.
2013; Monnard and Miles-Chan 2017).
Study Ia: measurement of the energy cost of standing
Participants
36 young, healthy adult participants (18 men, 18 women) of European descent participated in Study I (Table 1). All participants were weight stable, with less than 3% body weight variation in the 6 months preceding the study. Smokers, pregnant or breast-feeding women, claustropho-bic individuals, individuals taking medication, and those with any metabolic disease were excluded. Women were only tested during the follicular phase of their menstrual cycle. Written consent was obtained from all participants and all study procedures were followed in accordance with the tenets of the Helsinki Declaration of 1975 as revised in 1983, and approved by the Cantonal Ethics Committee (025/13-CER-FR).
Experimental design
Prior to the day of testing, participants visited the labora-tory to complete a questionnaire regarding their lifestyle and medical history, and to familiarise themselves with the experimental procedure and equipment. All partici-pants were requested to avoid moderate or vigorous physi-cal activities, caffeine, and dietary supplements in the 24 h prior to testing. On the day of testing, participants arrived at the laboratory at 8 h following a 12 h overnight fast. After the participant voided their bladder, body weight and height were measured using a mechanical column scale with integrated stadiometer (Seca model 709, Hamburg,
Germany), and body composition determined by multi-frequency bioelectrical impedance analysis (Inbody 720, Biospace Co., Ltd, Seoul, Korea), as described previously (Miles-Chan et al. 2013). EE and respiratory exchange ratio (RER) were measured by breath-by-breath indirect calo-rimetry (Cosmed Quark, Cosmed srl, Rome, Italy) using a silicon V2 facemask (Hans Rudolph, Kansas, USA). RER was calculated as VCO2/VO2. EE was calculated accord-ing to the Weir equation (Weir 1949): EE = 5.68 VO2 + 1.59 VCO2− 2.17 Nu, where Nu is the total urinary nitrogen excreted. As short-term urinary collections to assess total
Nu may not be representative of the protein oxidised dur-ing the measurement itself, they were not obtained in this study, and assumed to be 13 g/24 h, as described previously (Charriere et al. 2016; Fares et al. 2016; Sarafian et al.
2016).
The experimental outline is shown in Fig. 1. Partici-pants were seated comfortably in a car seat adapted for calorimetric monitoring, with metabolic measurement con-ducted until stabilisation of EE for at least 15 min, after
half an hour of rest. During this period, the participant was instructed to relax and avoid movement. The partici-pant (barefoot) was then asked to stand relaxed and “natu-rally”, but avoiding large movements. Data collected dur-ing the postural transition (maximum 2 min) were excluded from analyses. After 10 min of steady-state standing, the participant then returned to the seated position and meas-urements were continued for a further sitting period, last-ing at least 15 min. To reduce boredom and accompanylast-ing stress, participants were permitted to watch a calm movie or a documentary throughout the metabolic measurements. In addition, heart rate (HR) and breathing rate (BR) were measured throughout the protocol by a wireless physiologi-cal monitoring system (Equivital EQ-01, Hidalgo, Cam-bridgeshire, UK).
9 participants repeated this protocol on separate days to assess the repeatability of cardiometabolic responses.
The participants were categorised as “energy-savers” and “energy-spenders” according to our previous definition (Miles-Chan et al. 2013), namely:
Table 1 Characteristics of
participants for each study Study Variable All Men Women
Mean SEM Mean SEM Mean SEM
Ia n 36 – 18 – 18 – Age (year) 23.2 0.4 23.2 0.6 23.2 0.5 Height (cm) 171.6 1.7 179.5 1.1 163.8 1.7 Weight (kg) 68.2 2.1 77.6 1.9 58.7 2 BMI (kg/m2) 23 0.4 24.1 0.5 21.9 0.6 Spenders (n) 7 – 4 – 3 – Spenders (%) 19 – 22 – 17 – Ib n 18 – 9 – 9 – Age (year) 23.4 0.7 23.7 1.0 23.2 0.9 Height (cm) 172.1 2.7 180.9 1.3 163.2 3.2 Weight (kg) 68.3 3.5 79.4 3.1 57.3 3.3 BMI (kg/m2) 23 0.6 24.2 0.8 21.4 0.8 Spenders (n) 4 – 2 – 2 – Spenders (%) 22 – 22 – 22 – II n – – 7 – – – Age (year) – – 24.7 1.4 – – Height (cm) – – 180.0 1.9 – – Weight (kg) – – 76.4 3.4 – – BMI (kg/m2) – – 23.6 0.9 – – Spenders (n) – – 2 – – – Spenders (%) – – 29 – – – III n – – 6 – – – Age (year) – – 23.2 1.7 – – Height (cm) – – 177.7 3.3 – – Weight (kg) – – 65.5 1.4 – – BMI (kg/m2) – – 20.8 0.9 – – Spenders (n) – – 1 – – – Spenders (%) – – 17 – – –
http://doc.rero.ch
1. Energy-savers Those who showed little or no change in EE [a rise in EE of <5%) during 10-min standing period relative to sitting (previously referred to as “Non-Responders” (Miles-Chan et al. 2013)], and also those who increased EE [a rise in EE of >5%) during first 5 min of the 10-min standing period relative to sit-ting but subsequently decreased EE (by >30% of the rise) during the second 5 min of this standing period (previously referred to as “Responder Droppers” (Miles-Chan et al. 2013)]. We chose to group together these two sub-categories to minimise any confounding effect of the carry-over of the energy cost of the
pos-tural transition and, therefore, focus on the energy cost of the postural maintenance.
2. Energy-spenders Those who (i) increased EE (a rise in EE of >5%) during first 5 min of the 10-min standing period relative to sitting, and (ii) maintained an ele-vated EE throughout the entire 10-min standing period (drop in EE during second 5 min <30% of the rise in EE during first 5 of standing period).
Study Ib: analysis of spontaneous weight-shifting
Spontaneous WS during the 10-min standing period was assessed in a subset of participants during Study
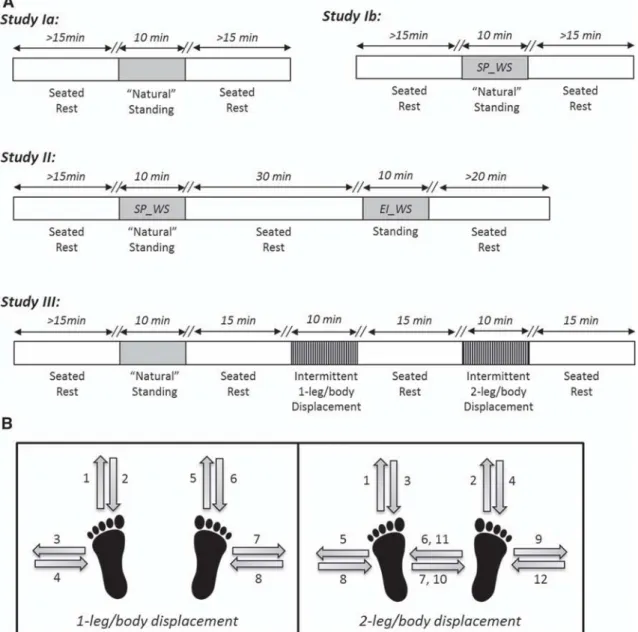
Fig. 1 Experimental protocols to measure the energy cost of
stand-ing versus intermittent leg/body displacement. a Sequence and timstand-ing of the activities performed during each study. SP_WS spontaneous weight-shifting, EI_WS experimentally induced weight-shifting. b
The order of movements performed during the two 10-min intermit-tent leg/body displacement activities of Study III, with each minute consisting of 30 s movement and 30 s rest, as described in the text
Ia (n = 18, 9 men, 9 women; Table 1). As indicated in Fig. 1, during the 10 min of steady-state standing period, participants (barefoot) were asked to stand relaxed and “naturally”, but avoiding large movements, with each foot on one of two balances (Seca 862, Hamburg, Ger-many) placed directly adjacent and level to one another. The weight on each of the two balances was recorded every 0.5 s using custom software, with “weight-shifting” defined as the delta weight (kg) between the two balances expressed as a percentage of body weight. Cumulative weight-shifted was calculated as the absolute sum of dif-ferences between consecutive delta weight values across the 10-min steady-state period.
To identify patterns of movement, the “weight-shift-ing” data were organised as an nxp weight-shift matrix X, where each of the n rows represents a different participant and each of the p columns specifies a particular time point. A principal component analysis (PCA) and a Fast Fourier Transform (FFT) were realised using the computational software R (version 3.1.2, R Foundation for Statistical Computing, Vienna, Austria).
Study II: energy cost of spontaneous versus experimentally induced weight-shift
Participants
7 young, healthy men participated in Study II (Table 1), with inclusion and exclusion criteria as per Study I.
Experimental design
As in Studies Ia and Ib, all participants were familiarised with techniques and procedures prior to experimental test-ing, and precautions were taken regarding the standardisa-tion of pre-testing diet and exercise. As shown in Fig. 1, following the baseline, seated facemask indirect calorim-etry (Cosmed Quark), HR and BR measurements were performed as described above, and participants were asked to stand “naturally” for 10 min on the dual-balance system (referred to as spontaneous WS). After a second seated resting period of 30 min, the participant was then asked to stand again. During this standing period, the participant was requested to shift their body weight from one leg to the other such that the body weight was unevenly distrib-uted between the two legs for the entire 10 min period, this being referred to as experimentally induced WS. The par-ticipant returned to the seated position for a third and final resting measurement of at least 20 min.
3 participants repeated this protocol on separate days to assess repeatability in weight-shifting patterns.
Study III: energy cost of standing versus intermittent leg/body displacement
Participants
6 young, healthy men participated in Study III (Table 1), with inclusion and exclusion criteria as per Study I.
Experimental design
As in Studies I and II, all participants were familiarised with techniques and procedures prior to experimental test-ing, and precautions were taken regarding the standardi-sation of pre-testing diet and exercise. Resting metabolic measurements were conducted for 15–20 min following 45 min of rest. The following activities were then under-taken (as shown in Fig. 1), with measurements obtained during postural transition excluded from analyses:
1. 10 min of steady-state ‘natural’ standing (spontaneous WS);
2. 15-min seated rest;
3. 10 min of standing with intermittent 1-leg/body dis-placement i.e. slow, “salsa-type” stepping where weight is rocked forward, back, or sideward on one foot while the other remains stationary in a fixed position; each min consisting of 30 s movement and 30 s rest (Fig. 1b);
4. 15-min seated rest;
5. 10 min of standing with intermittent 2-leg/body placement i.e. slow stepping where both feet are dis-placed one step forward, back, or sideward; each min consisting of 30 s movement and 30 s rest (Fig. 1b); 6. 15-min seated rest;
A metronome was used during the leg/body displace-ment, such that the movements occurred at a frequency of 1 per 1.5 s (40 beats per min).
Data and statistical analyses
All data are presented as mean (95% confidence interval) unless otherwise stated. Change in EE was calculated as the %change in EE relative to baseline, sitting EE [i.e. (EE dur-ing standdur-ing–EE durdur-ing sittdur-ing)/(EE durdur-ing sittdur-ing)]. Delta RER, HR and BR were calculated as the absolute change from baseline, sitting values (e.g. standing RER–sitting RER). The statistical treatment of data, by repeated-meas-ures ANOVA followed by Dunnett’s multiple comparison tests (versus baseline) or Bonferroni post-tests (between groups), or by linear regression, was performed using the computer software STATISTIX 8 (Analytical Software, St. Paul, MN, USA).
Results
Study Ia: measurement of the energy cost of standing
Energy expenditure
29 of the 36 participants (81%) were classified as “energy-savers” (13 Non-Responders and 16 Responder Droppers); i.e. showed little (<5%) or no increase in EE during the 10-min standing period versus sitting comfort-ably, or showed no sustained increase in EE (increased by >5% in the first 5 min of the standing period, followed by a decrease in EE during the second 5 min of the standing period of >30% of the initial rise). The minute-by-minute EE profiles of these energy-savers during standing as a function of time, indicate no significant increase rela-tive to sitting (Fig. 2a, b). By contrast, the remaining 7 participants (19%), defined as “energy-spenders” showed sustained increases in EE across the entire 10 min stand-ing period, namely 11.3% [0.15 (0.08, 0.22) kcal/min,
p < 0.01] compared to resting, seated values. In
partici-pants who repeated the protocol on two or three different days, the EE response to standing to be categorised as an “energy-spender” or an “energy-saver” (Fig. 3) was found to be reproducible in all 4 energy-spenders (i.e. partic-ipants M1, M2, W3, and W4) and in 4 out of 5 of the energy-savers (i.e. participants W1, W2, W5, M4).
Whilst absolute sitting EE values were lower in women when compared to men [women: 1.00 (0.96, 1.05); men: 1.36 (1.30, 1.43) kcal/min; p < 0.001], there was no significant difference between these two gender groups in terms of percentage change between sitting and 10-min standing means (p = 0.9). Similarly, there was no difference in the proportion of savers and energy-spenders between men and women (Fisher’s exact test;
p = 1).
There were no significant differences between energy-savers and energy-spenders in any of the measured anthropometry or body composition parameters (body weight, height, BMI, sitting height, skeletal muscle mass, fat mass, waist circumference). Furthermore, no signifi-cant correlation was found between the %change in EE (integrated over either the entire 10 min period) and any of these parameters. However, when considering the standing period as two 5-min epochs, there was a signifi-cant, albeit modest, correlation between height (r = 0.45,
p < 0.01) and %change in EE during the first 5 min of the
standing period relative to sitting EE, but no such cor-relation with BMI or body composition. No significant correlations were found between %change in EE during standing relative to sitting and height, other anthropomet-ric indices or body composition across the second 5 min epoch.
Respiratory exchange ratio
When all participants were pooled, RER significantly decreased during 10 min of standing as compared to sitting [0.872 (0.846, 0.897) vs. 0.838 (0.824, 0.852);
p < 0.001]. However, there was no significant difference
between the energy-savers and energy-spenders in terms of baseline, sitting RER (p = 0.6) or delta RER (stand-ing-sitting; p = 0.5); their min-by-min values are shown in Fig. 2c, d. Furthermore, no correlation was found between delta RER and %change in EE (r = −0.002,
p = 0.99).
Heart rate
Standing significantly increased HR compared to sit-ting, with mean values when all participants were pooled being 80 (75, 84) versus 67 (62, 71) beats/min (p < 0.001;
n = 29), respectively. This change was consistent across
both energy-savers and energy-spenders (p = 0.4). Simi-larly, there was no significant difference in resting HR between energy-savers and energy-spenders (Fig. 2e, f), and no correlation was observed between change in HR and change in EE.
Breathing rate
When all participants were pooled, BR did not dif-fer between the sitting and standing periods (p = 0.19). Although BR relative to sitting did increase with time in the energy-spenders (p < 0.005), but not in energy-savers, this increase was small (1–2 breaths/min) and there were no significant differences between the energy-savers and energy-spenders in resting BR (p = 0.4), or in terms of overall delta BR (p = 0.06) (Fig. 2g, h).
Study Ib: analysis of spontaneous weight-shifting
Despite large inter-individual variability, there was no significant difference between savers and energy-spenders in terms of the amount of WS (assessed as cumulative %body weight shifted) over the first 5 min (Fig. 4; p = 0.99), second 5 min (p = 0.48), or entire 10 min (p = 0.67) of the standing period.
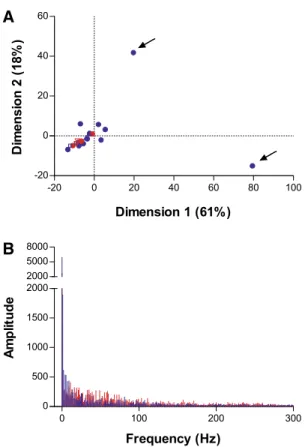
The results of the PCA and FFT for the second 5 min of the standing period are shown in Fig. 5. The PCA, which basically projects the n participant vectors from a p-dimensional space to a 2-dimentional plane while preserving as much variance as possible, shows that all participants are grouped together, except for two outliers (both energy-savers; Fig. 5a). Removing these outliers
reveals more clearly that the savers and spenders are mixed together and, thus, cannot be identified as two sep-arate groups.
Nevertheless, to identify movement patterns from noisy signals in the time domain and further understand
the behaviour and changes in weight-shifting, an FFT algorithm, which transforms time-based data into fre-quency-based data, was applied to the mean weight-shift saver and spender signals (Fig. 5b). The results of this pattern analysis show that both signals oscillate about
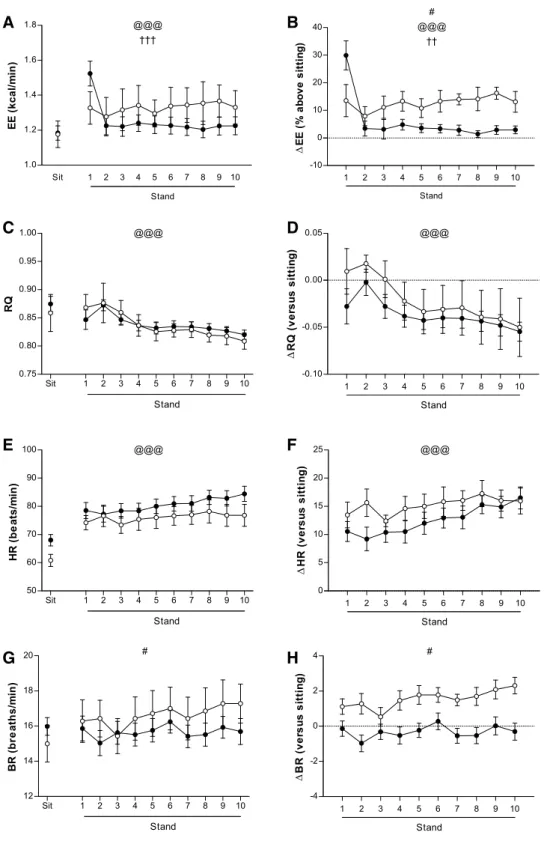
Fig. 2 Energy expenditure
(EE), respiratory exchange ratio (RER), heart rate (HR) and breathing rate (BR) during 10 min of steady-state standing as compared to sitting. Left
pan-els (a, c, e, g) show mean raw
values, right panels (b, d, f, h) show mean change from sitting values. Closed circles represent energy-savers (i.e. no change or no sustained change in EE versus baseline; n = 29), open circles represent energy-spend-ers (i.e. a sustained increase (>5% vs. baseline) in EE across the entire standing period;
n = 7). Mean ± SEM;
Statisti-cal significance of differences, assessed by two-factor ANOVA, is indicated as follows: #
Group effect (energy-spenders vs. energy-savers); @Time effect;
†
Group x diet interaction. Sin-gle, double, and triple symbols imply p < 0.05, p < 0.01, and p < 0.001, respectively A B C D E F G H
http://doc.rero.ch
the same value, but spenders seem to oscillate faster than savers.
Study II: energy cost of spontaneous versus experimentally induced weight-shift
Energy expenditure
EE during ‘natural’ standing (spontaneous WS) did not significantly differ compared to sitting (Table 2); the analysis of individual values (n = 7) revealed that two participants were energy-spenders. In response to experimentally induced WS, EE increased significantly
compared to sitting values [1.51 (1.30, 1.71) vs. 1.34 (1.20, 1.48) kcal/min; p < 0.05], with no observed differ-ences between energy-savers and energy-spenders.
Respiratory exchange ratio
Although RER tended to be lower in response to spon-taneous WS and induced WS (relative to sitting), no sig-nificant differences were found between sitting, the two types of WS (Table 2) or between energy-savers and energy-spenders.
Heart rate and breathing rate
There was a significant effect of standing on heart rate (+ 12 to 16 beats/min; p < 0.001), with heart rate equally higher during both spontaneous WS and induced WS as compared to sitting (Table 2). However, BR did not change between the three different activities (Table 2). No differ-ences were found in HR and BR between energy-savers and energy-spenders.
Fig. 3 Repeatability of change in energy expenditure during standing
compared to sitting in 9 individuals. Each bar represents a separate day, with each participant measured over 2 or 3 separate days. Men and women are denoted by M and W, respectively
Fig. 4 Individual data (n = 18) of change in energy expenditure (EE)
and cumulative weight shifted (as a % of body weight) during the first 5 min of the steady-state standing period. Closed circles repre-sent energy-savers, open circles reprerepre-sent energy-spenders. Group classification is, as described in the “Methods” section, according to previously published criteria (Miles-Chan et al. 2013), specifically: Energy-spenders are those who (i) increased EE (a rise in EE of >5%) during first 5 min of the 10-min standing period relative to sit-ting, and (ii) maintained an elevated EE throughout the entire 10 min standing period (drop in EE during second 5 min being <30% of the rise in EE during first 5 min of standing period)
A
B
Fig. 5 Analysis of weight-shifting patterns. a Results of the
princi-pal components analyses (PCA) for the second 5 min of the standing period including the two outliers (indicated with arrows). b Ampli-tude spectrums obtained after FFT analysis. Energy-savers are shown in blue; energy-spenders are shown in red. (Color figure online)
Study III: energy cost of standing versus intermittent leg/body displacement
Energy expenditure
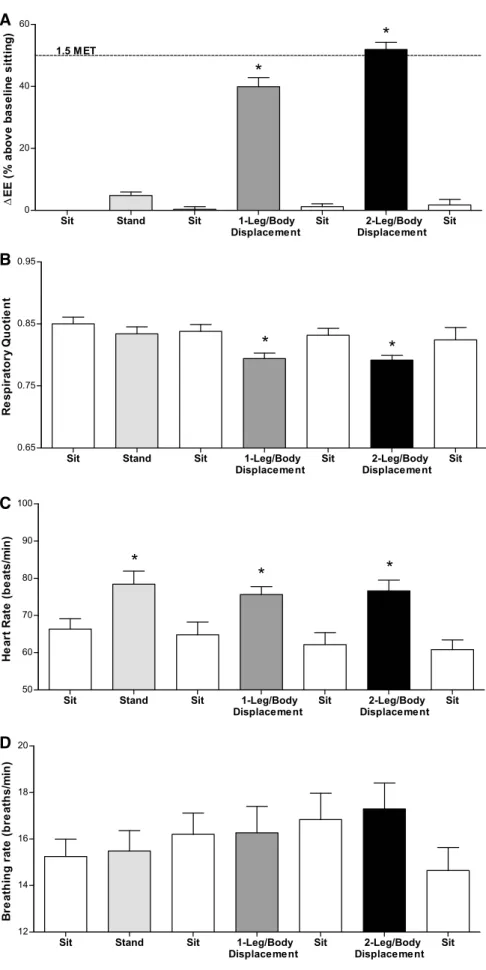
EE during steady state standing alone did not significantly increase relative to sitting (Fig. 6a); Only 1 of the 6 par-ticipants could be classified as an energy-spender. Increases in EE relative to baseline were observed in all participants during the intermittent leg/body displacement tasks: 1-leg/ body displacement [+40% (32, 47), 1.4 METs; p < 0.05] and 2-leg/body displacement [+52% (46, 58), 1.5 METs;
p < 0.05]. No difference in EE was observed between any of
the seated periods.
Respiratory exchange ratio
Standing alone did not alter RER relative to sitting; how-ever, RER significantly decreased during both the intermit-tent leg/body displacement activities (Fig. 6b), an effect that was reversed by subsequent sitting.
Heart rate and breathing rate
The three upright activities (standing, intermittent 1-leg/ body displacement, intermittent 2-leg/body displacement) all increased HR above seated, resting values by ~11 bpm (Fig. 6c). However, there was no significant difference between these three upright conditions. There was no effect of any of the activities performed on BR (p = 0.2, Fig. 6d).
Discussion
In our study here, the application of continuous indirect calorimetric monitoring to determine the time course of EE change during steady-state standing reveals a large het-erogeneity across the study population in the amplitude and time course of EE response to standing compared to
sitting, with the two phenotypes identified. Of the partici-pants, approximately 81% of them (n = 29 out of 36) could be classified as energy-savers, who showed no sustained increase in EE during steady-state standing relative to sit-ting (EE rise <5%), and the minority (19%) classified as energy-spenders, in that they show a sustained elevation in EE during steady-state standing. It is unlikely that these dif-ferences were due to an elevated or sustained stress/anxiety response in the energy-spenders, or conversely a decreased stress/anxiety response in the energy-savers, as the length of the standing period was well tolerated by all partici-pants, and equal (Judice et al. 2016) or shorter (Levine et al. 2000) in duration than that used in comparable stud-ies. Participants were instructed to stand “naturally” and so were able to spontaneously shift weight between legs, and no inherent difficulties were associated with wearing a facemask. Furthermore, in order to identify possible stress/ anxiety, heart rate and breathing rate were measured con-tinuously throughout the experiment. The slight increases in heart rate during steady-state standing relative to sitting were identical in both groups, and breathing rate showed little or no change across the protocol.
Weight-shifting patterns
Overall, the findings of the present study are thus in line with our earlier study (Miles-Chan et al. 2013) and those of others (Judice et al. 2016) showing clear heterogeneity in the energy cost of standing versus sitting comfortably. As all the participants in the present study were young and healthy participants, the heterogeneity in the energy cost of standing is more likely to reside within the muscu-loskeletal efficiency, coordination and balance of postural maintenance. We observed no significant difference in the amount of shifting (assessed as cumulative weight-shifted) between energy-savers and energy-spenders. How-ever, in order to gain further insights into the psychomotor basis of variability in the energetics of standing and posture maintenance, we applied the Fast-Fourier Transformation
Table 2 Comparison of
cardiometabolic parameters during sitting, spontaneous weight-shifting and
experimentally induced weight-shifting
* Statistically significant (p < 0.05) from baseline, sitting as assessed by repeated-measures ANOVA
fol-lowed by Dunnett’s multiple comparison tests
Sitting Weight-shifting
Spontaneous Induced
Mean SEM Mean SEM Mean SEM
Energy expenditure (kcal/min) 1.34 0.06 1.43 0.06 1.51* 0.08
Respiratory exchange ratio 0.846 0.021 0.819 0.017 0.838 0.036
Heart rate (beats/min) 54 2 70* 3 66* 4
Breathing rate (breaths/min) 17 1 18 1 17 1
Fig. 6 Comparison of energy
expenditure (EE), substrate oxidation, heart rate and breath-ing rate durbreath-ing sittbreath-ing, standbreath-ing, and low-level movement. a Energy cost of standing versus intermittent leg/body displace-ment in comparison to baseline, sitting EE. MET metabolic equivalent. b Respiratory Exchange Ratio (RER); c Heart rate (HR); d Breathing rate (BR). Mean ± SEM; n = 6. For a description of each low-level movement, please refer to text
A
B
C
D
(FFT) algorithm to analyse the frequency and amplitude of spontaneous WS while standing. Whilst this FFT analysis of spontaneous WS patterns revealed considerable intra-individual variability, this variability was not related to the observed differences in the energetic cost of standing, with no clear distinction in spontaneous WS patterns between energy-saver and energy-spenders.
Energy cost of standing and stature
It should be noted that in both the previous study from our laboratory (Miles-Chan et al. 2013) utilising a posture-adapted indirect calorimetry system with canopy, which could perhaps have restricted the ‘natural’ standing posture, and in the current study using facemask indirect calorim-etry (which obviates this potential limitation), we observed that the large majority of the participants could be catego-rised as energy-savers, namely 82 and 81%, respectively. This large proportion of people showing standing economy would, a priori, appear to be in conflict with studies report-ing significant increases in EE durreport-ing intermittent standreport-ing, instead of prolonged sitting. However, studies showing that breaking up sedentary sitting time with intermittent stand-ing leads to increases in EE (Levine et al. 2005) do not dis-tinguish between postural transition and steady-state stand-ing and, thus, it is most likely the transition from sittstand-ing to standing (or vice versa) which is increasing EE (Creasy et al. 2016; Hatamoto et al. 2016; Judice et al. 2016) rather than maintaining standing posture per se. Further to this, in the present study we observed a significant correlation between change in EE during the first 5 min of the standing period and height. No such correlation was observed dur-ing the second 5 min of standdur-ing. This is in line with recent work regarding the energy cost of sit-stand transitions (Hatamoto et al. 2016), which also showed such a correla-tion, and which is suggested to reflect the larger movement required by individuals of taller stature versus shorter to transition posture from a chair of equal height.
Sedentary threshold
It is important to note that even in the highest respond-ing individuals (men and women), EE durrespond-ing steady-state standing did not increase beyond 25% above resting values (i.e. 1.25 METs). Indeed, whilst EI_WS further increased EE above sitting values (by 11% on average) in the men participating in Study II, the 50% increase in EE (i.e. 1.5 METs sedentary threshold) was not exceeded by any of these participants. Instead intermittent leg/ body displacement above standing alone was required to increase EE above the commonly described sedentary behaviour threshold (Mansoubi et al. 2015; Sedentary
Behaviour Research Network 2012) of >1.5 METs. In addition to the above findings regarding the energy cost of standing and minimal leg/body displacement, a clear dissociation between heart rate and EE can be observed when comparing standing versus sitting in the partici-pants of Study III (men only). Furthermore, this disso-ciation between heart rate and EE can be observed in the upright posture when comparing standing and the minimal leg displacement activities. Indeed, compared to standing, EE increases by 35 and 47% during 1-leg/ body and 2-leg/body displacements, respectively, but there were no significant differences in heart rate between these upright activities. Taken together, these findings highlight the inappropriateness of the use of heart rate as a proxy of EE under conditions when posture change is relatively frequent or under conditions of low level move-ments, such as is done by many consumer fitness moni-toring devices.
Standing economy
Whilst our findings here and previously (Miles-Chan et al. 2013), that the vast majority of individuals have no sustained increase in EE during steady-state standing (relative to sitting comfortably), may appear at odds with popular belief, it is not surprising when put in the context of past findings regarding the economy in metabolic and mechanical cost observed during low-intensity physical activities, such as walking. Indeed, a number of studies of African women have shown the ability to carry loads of water on the head, of up to 20% of body mass, at no additional energy cost (Jones et al. 1987; Maloiy et al.
1986). However, considerable inter-individual variability has been noted in this “free-ride” phenomenon with the relationship between economy of load-carriage and vari-ous anthropometric variables either weak or inconsistent, indicating that the optimal load-carrying strategy may be individual (Lloyd et al. 2010). Moreover, Selinger et al. (2015) have demonstrated the ability of humans to con-tinuously and spontaneously adjust and optimise move-ment such that energetic cost is minimised. By transiently perturbing normal gait patterns, they showed participants rapidly adjusted step frequency within minutes despite relatively small energetic savings (<5%), concluding that “energetic cost is not just an outcome of movement, but also continuously shapes it” (Selinger et al. 2015). Whilst the notion of energetic optimisation has long been established in terms of both human and animal locomo-tion (Alexander 1989; Tucker 1970), it does not appear to have been explored in terms of the micro-movements associated with stationary behaviours such as standing and warrants further investigation.
Effect on respiratory exchange ratio (RER)
A salient feature was the slow drop in RER observed in the two conditions (1-leg and 2-leg displacement) after 5 min displacement in a near steady-state condition (see Figs. 2,
6). This indicates a shift in substrate oxidation towards a rise in fat oxidation concomitantly to a decrease in carbo-hydrate oxidation. Despite a rather modest change in EE, this change in substrate utilisation, cumulated over several repeated periods of low activity, may not be negligible. Limitations
Although the findings of these studies are of importance to our understanding of the energy cost of postural main-tenance, they are not without limitation. In particular as Studies Ib and II were exploratory, no previous data were available to conduct a priori sample size calculations, and as such the sample size of these studies may have been insufficient. Study Ib was based on the PCA whereby we attempted to separate energy-savers and energy-spenders based on their movement patterns. Whilst no group sepa-ration by movement pattern was apparent, there is no way of calculating the probability of an error of inference using this type of analysis and, therefore, our conclusions based on the PCA results are limited. In contrast, Study II investi-gated the energy cost of spontaneous versus experimentally induced weight-shifting, and as all participants responded to experimentally induced weight-shifting in the same manner (i.e. by increasing their EE relative to spontaneous weight-shifting), we believe this finding to be justified.
Postural transition from sitting to standing has been clearly shown to increase EE (Hatamoto et al. 2016; Judice et al. 2016); however, the time course of this increase has not been explored. Therefore, whilst we discarded the ini-tial 2 min of measured values following each postural tran-sition, it is possible that the increased EE associated with these transitions carried over into the time periods inves-tigated here. To address this possible confounding effect, we pooled together those individuals who showed little/ no increase in EE during the standing period with those who initially increased EE but whose EE during stand-ing has dropped to sittstand-ing values within the first 5 min of the standing period. By comparing these individuals with those showing a sustained increase in EE across the entire 10-min standing period and also focusing on EE, HR and BR during the second 5 min of the standing period (most representative of a steady-state), we believe that we have minimised confounding effects which may have resulted from the energy cost of the postural transition.
Similarly, the orders in which the participants performed treatment conditions during each of the studies described here were held constant, with no randomisation. As such,
it is possible that a sequence effect may have been present. However, a similar study by Judice and colleagues (Judice et al. 2016) investigated the energy cost of motionless sit-ting, standing, and sit/stand transitions, with each partici-pant performing each condition in a randomised order. The authors controlled for the order of randomisation in the analysis and found no interactions for this covariate, sug-gesting that the order in which the participants performed the conditions in the present study is not likely to signifi-cantly alter our findings.
Lastly, Studies II and III relating to low-level move-ment were performed only in men. Whilst neither Study 1 nor our previous work (Miles-Chan et al. 2013, 2014) indicates a gender difference in terms of the energy cost of posture maintenance, caution should nevertheless be used when translating these findings to experimental or popula-tion groups which include women, and further work is war-ranted to determine if the energy cost of experimentally induced weight-shifting and leg/body displacement is influ-enced by gender.
Conclusions
This study reveals considerable variability in spontaneous weight-shifting signatures between individuals. However, there was no overall relationship found between either the amount or pattern of weight-shifting during steady-state standing and the observed heterogeneity in its energy cost. Study II (in men) also underscores the fact that a mini-mal leg/body displacement, rather than standing alone, is needed to increase EE above the currently defined thresh-old for sedentary values (i.e. above 1.5 METS). If also con-firmed in women, this finding is of particular importance when translated to workplace settings or in the design of future intervention strategies aimed at increasing EE in oth-erwise sedentary individuals.
Acknowledgements We thank Laurent Monney for the
develop-ment of the weight-shifting signal acquisition software, and André Gaillard for constructing and modifying equipment to enable the pos-ture-adapted measurements.
Compliance with ethical standards
Funding This research work was supported in part by the
Univer-sity of Fribourg Internal Research Funding Scheme and in part by the Swiss National Science Foundation (Grant Number: 310030_152870).
Conflict of interest The authors declare that they have no conflict
of interest.
Ethical approval All procedures performed in studies involving
human participants were in accordance with the ethical standards of the institutional and/or national research committee and with the 1964
Helsinki declaration and its later amendments or comparable ethical standards.
Informed consent Informed consent was obtained from all
individ-ual participants included in the study.
Data availability The datasets analysed during the current study are
available from the corresponding author on reasonable request.
References
Alexander RM (1989) Optimization and gaits in the locomotion of vertebrates. Physiol Rev 69:1199–1227
Bailey DP, Broom DR, Chrismas BC, Taylor L, Flynn E, Hough J (2016) Breaking up prolonged sitting time with walking does not affect appetite or gut hormone concentrations but does induce an energy deficit and suppresses postprandial glycaemia in seden-tary adults. Appl Physiol Nutr Metab 41:324–331. doi:10.1139/ apnm-2015-0462
Charriere N, Montani JP, Dulloo AG (2016) Postprandial thermogen-esis and respiratory quotient in response to galactose: compari-son with glucose and fructose in healthy young adults J Nut Sci 5:e4. doi:10.1017/jns.2015.41
Creasy SA, Rogers RJ, Byard TD, Kowalsky RJ, Jakicic JM (2016) Energy expenditure during acute periods of sitting, stand-ing, and walking J Phy Act Health 13:573–578. doi:10.1123/ jpah.2015-0419
Fares EJ, Charriere N, Montani JP, Schutz Y, Dulloo AG, Miles-Chan JL (2016) Energy expenditure and substrate oxidation in response to side-alternating whole body vibration across three commonly-used vibration frequencies PloS ONE 11:e0151552. doi:10.1371/journal.pone.0151552
Hamilton MT, Hamilton DG, Zderic TW (2007) Role of low energy expenditure and sitting in obesity, metabolic syndrome, type 2 diabetes, and cardiovascular disease. Diabetes 56:2655–2667. doi:10.2337/db07-0882
Hatamoto Y, Yamada Y, Higaki Y, Tanaka H (2016) A novel approach for measuring energy expenditure of a single sit-to-stand movement Eur J Appl Physiol 116:997–1004. doi:10.1007/ s00421-016-3355-5
Henson J, Dunstan DW, Davies MJ, Yates T (2016) Sedentary behav-iour as a new behavbehav-ioural target in the prevention and treat-ment of type 2 diabetes Diabetes/Metab Res Rev 32 1:213–220. doi:10.1002/dmrr.2759
Jones CD, Jarjou MS, Whitehead RG, Jequier E (1987) Fatness and the energy cost of carrying loads in African women Lancet 2:1331–1332
Judice PB, Hamilton MT, Sardinha LB, Zderic TW, Silva AM (2016) What is the metabolic and energy cost of sitting, standing and sit/ stand transitions? Eur J Appl Physiol 116:263–273. doi:10.1007/ s00421-015-3279-5
Kitatani R, Ohata K, Sakuma K, Aga Y, Yamakami N, Hashiguchi Y, Yamada S (2016) Ankle muscle coactivation during gait is decreased immediately after anterior weight shift practice in adults after stroke Gait & Posture 45:35–40. doi:10.1016/j. gaitpost.2016.01.006
Lemay JF, Gagnon D, Duclos C, Grangeon M, Gauthier C, Nadeau S (2013) Influence of visual inputs on quasi-static standing pos-tural steadiness in individuals with spinal cord injury Gait & Posture 38:357–360. doi:10.1016/j.gaitpost.2012.11.029 Levine JA, Schleusner SJ, Jensen MD (2000) Energy expenditure of
nonexercise activity. Am J Clin Nutr 72:1451–1454
Levine JA, Lanningham-Foster LM, McCrady SK, Krizan AC, Olson LR, Kane PH, Jensen MD, Clark MM (2005) Interindividual
variation in posture allocation: possible role in human obesity. Sci-ence 307:584–586. doi:10.1126/science.1106561
Lloyd R, Parr B, Davies S, Cooke C (2010) No ‘free ride’ for African women: A comparison of head-loading versus back-loading among Xhosa women S Afr J Sci. doi:10.4102/sajs.v106i3/4.153
Maloiy GM, Heglund NC, Prager LM, Cavagna GA, Taylor CR (1986) Energetic cost of carrying loads: have African women discovered an economic way? Nature 319:668–669. doi:10.1038/319668a0 Mansoubi M, Pearson N, Clemes SA, Biddle SJ, Bodicoat DH, Tolfrey
K, Edwardson CL, Yates T (2015) Energy expenditure during com-mon sitting and standing tasks: examining the 1.5 MET definition of sedentary behaviour. BMC Public Health 15:516. doi:10.1186/ s12889-015-1851-x
Miles-Chan JL, Sarafian D, Montani JP, Schutz Y, Dulloo A (2013) Heterogeneity in the energy cost of posture maintenance dur-ing standdur-ing relative to sittdur-ing: phenotypdur-ing accorddur-ing to magni-tude and time-course. PloS ONE 8:e65827. doi:10.1371/journal. pone.0065827
Miles-Chan JL, Sarafian D, Montani JP, Schutz Y, Dulloo AG (2014) Sitting comfortably versus lying down: is there really a differ-ence in energy expenditure?. Clinical nutrition 33:175–178. doi:10.1016/j.clnu.2013.11.009
Monnard CR, Miles-Chan JL (2017) Energy cost of standing in a multi-ethnic cohort: are energy-savers a minority or the majority?. PloS ONE 12:e0169478. doi:10.1371/journal.pone.0169478
Rojas VG, Rebolledo GM, Munoz EG, Cortes NI, Gaete CB, Delgado CM (2013) Differences in standing balance between patients with diplegic and hemiplegic cerebral palsy. Neural Regen Res 8:2478– 2483. doi:10.3969/j.issn.1673-5374.2013.26.009
Sarafian D, Schutz Y, Montani JP, Dulloo AG, Miles-Chan JL (2016) Gender difference in substrate oxidation during low-intensity iso-metric exercise in young adults. Appl Physiol Nutr Metab. doi: 10.1139/apnm-2016-0127
Schmid D, Ricci C, Leitzmann MF (2015) Associations of objectively assessed physical activity and sedentary time with all-cause mor-tality in US adults: the NHANES study. PloS ONE 10:e0119591. doi:10.1371/journal.pone.0119591
Sedentary Behaviour Research Network (2012) Letter to the edi-tor: standardized use of the terms “sedentary” and “sedentary behaviours”. Appl Physiol Nutr Metab 37:540–542. doi:10.1139/ h2012-024
Selinger JC, O’Connor SM, Wong JD, Donelan JM (2015) Humans can continuously optimize energetic cost during walking. Curr Biol 25:2452–2456. doi:10.1016/j.cub.2015.08.016
Swartz AM, Squires L, Strath SJ (2011) Energy expenditure of interrup-tions to sedentary behavior The. Int J Behav Nutr Phys Act 8:69– 69. doi:10.1186/1479-5868-8-69
Thorp AA, Kingwell BA, English C, Hammond L, Sethi P, Owen N, Dunstan DW (2015) Alternating sitting and standing increases the workplace energy expenditure of overweight adults. J Phys Act Health. doi:10.1123/jpah.2014-0420
Tucker VA (1970) Energetic cost of locomotion in animals. Comp Bio-chem Physiol 34:841–846
Tudor-Locke C, Schuna JM, Jr., Frensham LJ, Proenca M (2014) Chang-ing the way we work: elevatChang-ing energy expenditure with worksta-tion alternatives. Int J Obes 38:755–765. doi:10.1038/ijo.2013.223 van den Heuvel MR, Daffertshofer A, Beek PJ, Kwakkel G, van Wegen
EE (2016) The effects of visual feedback during a rhythmic weight-shifting task in patients with Parkinson’s disease. Gait & Posture 48:140–145. doi:10.1016/j.gaitpost.2016.03.020
Weir JB (1949) New methods for calculating metabolic rate with special reference to protein metabolism. J Physiol 109:1–9
Wijndaele K, Healy GN (2016) Sitting and chronic disease: where do we go from here?. Diabetologia 59:688–691. doi:10.1007/ s00125-016-3886-7