Composite joints under M-N at elevated temperatures - Experimental investigations and analytical model
12
0
0
Texte intégral
(2) experience and practical guidelines exist nowadays which would allow a designer to design a structure accordingly. Within the European RFCS ROBUSTFIRE project, the behaviour of steel and composite car parks subjected to localised fire leading to a column loss was investigated, and practical design guidelines were derived. To reach this goal, experimental, numerical and analytical developments were carried out. Under such a scenario, the beam-to-column joints play a key role in the global structural response. Indeed, these joints, initially loaded in bending, may be subjected to elevated temperatures and to combined axial load “N” and bending moment “M”. Within the above mentioned project, a methodology to predict the mechanical response of bolted composite beam-to-column joints at elevated temperatures under M-N is proposed; this methodology will be presented and discussed in the present paper. This methodology is founded on an analytical method able to predict M-N resistance interaction curves for joints and which is in full agreement with the Eurocode model recommended for the joint characterisation, i.e. the component method. Also, the validation of the proposed model through comparisons against experimental results obtained from six tests performed at the University of Coimbra on a composite steel-concrete beam-to-column frame under fire is introduced in the paper. The tested composite frame was subject to mechanical (bending and axial forces) and thermal actions (constant temperature equal to 500ºC or 700ºC). The objective of these tests was to observe the combined bending moment and axial loads in the heated joint when catenary action develops in the frame during the column loss due to a localized fire. The paper will first summarise the conducted experimental test campaign and then present the developed analytical method, with its validation through comparisons of its predictions against experimental evidences. 2. EXPERIMENTAL TESTS Seven beam-to-column sub-frames (see Figure 1) were tested at the University of Coimbra: one reference test at ambient temperature; five tests at 500ºC or 700ºC; and a demonstration test, for which the sub-frame was subject to an increase of the temperature up to the failure of the column. The effect of the axial restraint to beam coming from the unaffected part of the building was also studied. The main objective of the experimental tests was to observe the combined bending moment and axial load in the heated composite steel-concrete joint after the loss of the column. The effect of the localised fire (that led to the column loss) was simulated by the application of elevated temperatures in the composite joint zone. 2.1 Experimental program A typical open car park structure was specially designed for the European ROBUSTFIRE project [Demonceau et al, 2013]. This building was defined as the most common as possible in order to obtain, at the end of the project, general design rules for such structures, ensuring sufficient robustness under fire conditions. The selected structure was a braced open car park building with eight floors of 3 m height, composite slabs, composite beams and steel columns. The tested sub-frame was selected from the fifth floor of this car park building; however, because of the laboratory dimensions, the beam length was reduced from 10 m in the real building to 3 m in the tested sub-frame. In this paper, the six tests performed under constant temperatures (tests 1 to 6) are presented and the obtained results are used to calibrate the proposed analytical model. The objective of these tests was to derive: i) the joint properties at 20ºC, 500ºC and 700ºC (no axial restraint to the beam), and ii) the joint M-N curves at 500ºC and 700ºC under variable axial loads (full or actual beam axial restraints)..
(3) 2.2 Sub-frame and testing setup The sub-frame was defined by two unprotected composite beams IPE 550 steel crosssections, grade S355, and one unprotected HEB 300 cross-section steel column, grade S460 (Fig. 1). The hydraulic jack at the column top applied the mechanical loading, whereas the hydraulic cylinder located at the column base simulated the progressive loss of the column. Reaction frame. 4m COMPOSITE SLAB AND COMPOSITE BEAM. Beam vertical support. Column restraint. Horizontal beam support. HEB 300. 2.5 m. IPE 550. 3m. STRONG WALL. Right side. HEB 300. HEB 300. HEB 300. Column restraint HEB 140. 2.2 m. HEB 140. 3.8 m. NO AXIAL RESTRAINT TO THE BEAM HEB 220. STRONG WALL. Hydraulic Jack. Bottom column Load cell Cylinder. Steel footing. Beam vertical support. Column restraint. Concrete footing. HEB 220. REALISTIC AXIAL RESTRAINT TO THE BEAM (Spring). Left side. HEB 300. TOTAL AXIAL RESTRAINT TO THE BEAM. Steel footing. 14.1 m. Fig. 1 - General layout, longitudinal view The joint configuration is representative of usual joint typologies used in open composite steel-concrete car park structures (see Figure 2); bolts M30, grade 10.9, and a steel endplate 15 mm thick, S355, were used ([Demonceau et al, 2013] and [Haremza et al, 2013]). In order to ensure the composite behaviour of the beam-to-column joint, ten steel rebars of diameter 12 mm were placed in the composite slab (five at each side of the column). The composite slab (1 mm thick steel sheeting and reinforced concrete C25/30) had 900 mm width and 130 mm of total thickness. The steel beam was fully connected to the composite slab by 22 shear studs [Haremza et al, 2013].. Fig. 2 – Configuration of the tested beam-to-column joints.
(4) 2.3 Description of the loading sequence Each test, from test 1 to test 6, was divided into 3 main steps (see Figure 3): step 1 application of an initial hogging bending moment in the joint, step 2 - heating of the joint zone up to 500ºC or 700ºC (except for test 1 at 20ºC), and step 3 - simulation of the loss of the column and increase of the sagging bending moment up to the failure of the joint. In step 1, the internal loads in the joint were simulated as in the real car park. A hogging bending moment equal to -450 kNm was applied to test 1 at ambient temperature. According to Eurocode 1 part 1.2 (EN 1991-1-2, 2002), effects of actions under fire may be deduced from those determined in normal temperature design, by calculating a reduction factor ηfi (53% in this case). The resulting hogging bending moment considered in tests under elevated temperatures was -236 kNm. During step 2, temperatures increased with a linear rate of 300ºC/hour, up to the target temperature in the beam bottom flanges: 500ºC for tests 2 and 4, and 700ºC for tests 3, 5 and 6. Steel temperatures were increased using Flexible Ceramic Pad (FCP) heating elements (concrete was not heated). The heated zone was defined by a length of 0.6 m of the beam to each side of the joint, the bolts and 1 m of column [Haremza et al, 2013]. Temperatures were kept constant throughout step 3, for which the progressive loss of the column was simulated. Then, the vertical load at the column top was increased in the downward direction, in order to increase the sagging bending moment in the joint and to reach the joint failure. The effect of the beam axial restraint coming from the unaffected part of the building was studied, and three different restraints stiffness’s were considered (Figure 3). When no restraint was applied (tests 1, 2 and 3), the beams were free to deform axially. For the total beam axial restraint (tests 4 and 5), a steel beam with profile HEB 300, linked from the end of the tested beams to strong walls was used (see Figure 1). The actual axial restraints to the beams (spring restraints in test 6) provided by the part of the building not directly subject to the fire were simulated using hydraulic cylinders, with a spring stiffness equal to 50 kN/mm. The total as well as the actual restraints at their extremities were pinned and allowed the rotation.. Step 1. Step 2. Hogging bending moment. Fire (except for test 1 at 20ºC). T4, T5 T1, T2, T3 T6. Step 3. F T1:20ºC T2,T4:500ºC T3,T5,T6:700ºC. T1:20ºC T2,T4:500ºC T3,T5,T6:700ºC. Loss of the column. Sagging bending moment. Fig. 3 - Outline of the tests 1 to 6.
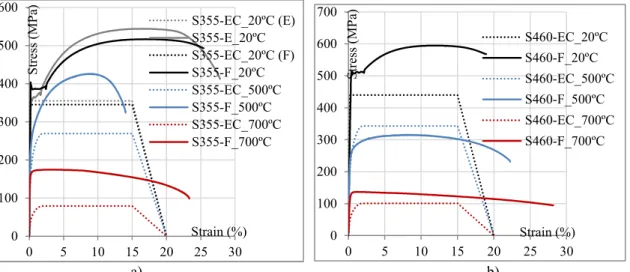
(5) 2.4 Material tests For calibration of the proposed analytical model against the test results, material tests were performed to determine material properties of the steel joint components and concrete slab [Haremza et al, 2013]. Mechanical properties of the beam, the column and the end-plate were defined by steady-state tensile coupon tests performed at ambient and elevated temperatures (500ºC and 700ºC). Figure 4 presents the stress-strain curves from the tensile tests performed at 20ºC, 500ºC and 700ºC: a) the flanges of the IPE 550 steel beam (S355J0 + M) and the end-plate (S355J2), and b) the flanges of the HEB 300 steel column (S460M). Each curve is compared with Eurocode curves [EN1993-1-2, 2005]; it can be observed that Eurocode provides secure results except for high strength steel S460 under 500ºC.. 500. S355-EC_20ºC (E) S355-E_20ºC S355-EC_20ºC (F) S355-F_20ºC S355-EC_500ºC S355-F_500ºC S355-EC_700ºC S355-F_700ºC. 400 300 200. 700 600 500. Stress (MPa). 600. Stress (MPa). Mechanical properties of the bolts M30, grade 10.9 were defined by steady-state tensile coupon tests at ambient and elevated temperatures (200ºC, 400ºC, 500ºC, 600ºC, 700ºC and 800ºC). Figure 5 presents the stress/strain curves for each temperature. Tests showed that yield and ultimate stresses increased at 200ºC before decreasing at higher temperature [Haremza et al, 2013]. The Young’s modulus decreased with temperature, and the ductility was significantly increased from 600ºC.. S460-EC_20ºC S460-F_20ºC S460-EC_500ºC S460-F_500ºC. 400. S460-EC_700ºC 300. S460-F_700ºC. 200. 100. 100 Strain (%). 0 0. 5. 10. 15. 20. 25. 0 0. 30. 5. 10. 15. a). 20. Strain (%) 25 30. b). Fig. 4 - Comparisons of stress-strain curves obtained from Eurocode 3 part 1.2 (EC), and tests performed at 20ºC, 500ºC and 700ºC for steel: a) S355J0 + M - IPE 550 (flange-F) and S355J2 from the end-plate (E); b) S460 - HEB 300 (flange-F) 1200 20ºC 200ºC 400ºC 500ºC 600ºC 700ºC 800ºC. Stress (MPa). 1000 800 600 400 200. Strain (%). 0 0. 5. 10. 15. 20. 25. 30. 35. 40. Fig. 5 - Stress-strain curves of bolts M30 10.9 at 20ºC, 200ºC, 400ºC, 500ºC, 600ºC, 700ºC & 800ºC.
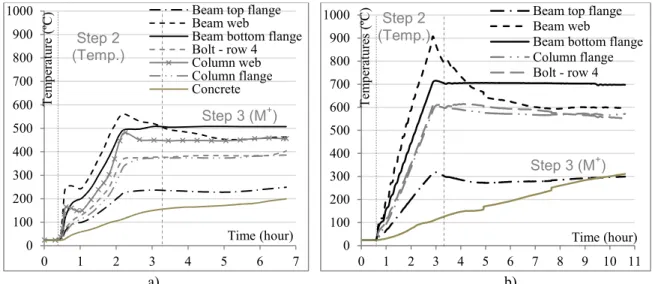
(6) 2.5 Experimental test results 2.5.1 Temperature results. 900 800 700 600. Beam top flange Beam web Beam bottom flange Bolt - row 4 Column web Column flange Concrete. Step 2 (Temp.). 900 800 700 600. +. Step 3 (M ). 500. 1000. Temperatures (ºC). 1000. Temperature (ºC). Tests 2 to 6 were performed under constant temperatures: bottom flanges reached 500ºC in tests 2 and 4, and 700ºC in tests 3, 5 and 6. Figure 6 depicts the temperature evolution during tests 2 and 6 - at 200 mm from the connection (in the bottom flange, web and top flange), at the column centre, in bolt row 4, and in the concrete rib in contact with the steel beam near the joint. The reduced beam web thickness allowed a faster temperature increase; because beams top flanges were shielding by the concrete slab and heated only by heat transfer, steel temperatures were much lower than the ones measured in the bottom flanges and webs [Haremza et al, 2013]. In all the tests, concrete temperatures did not rise above 300ºC. Beam top flange Beam web Beam bottom flange Column flange Bolt - row 4. Step 2 (Temp.). 500. 400. 400. 300. 300. 200. 200. 100. +. Step 3 (M ). 100 Time (hour). 0 0. 1. 2. 3. 4. 5. 6. 7. a). Time (hour). 0 0. 1. 2. 3. 4. 5. 6. 7. 8. 9. 10 11. b). Fig. 6 - Evolution of the temperatures during a) test 2 at 500ºC, b) test 6 at 700ºC. 2.5.2 Mechanical results and failure modes Figure 7 depicts, for each test, the evolution of the bending moment versus a) the rotation of each connection, and b) the time. The joint rotation was estimated using the vertical displacements measured at: i) 1500 mm from the end-plate, and ii) at the column top. The reaction loads at the beams supports were used to calculate the bending moment. In step 1, the initial hogging bending moment was applied: -501 kNm for reference test 1, and -236 kNm for tests 2 to 6. At the beginning of the heating phase (step 2), the column reaction load increased under thermal expansion effects and reached a maximum value: the minimum hogging bending moments reached around -500 kNm in tests 3, 5 and 6 (under 700ºC), and around -357 kNm in tests 2 and 4 (under 500ºC). Finally, this reaction load decreased because of the degradation of steel properties at elevated temperatures. Under sagging bending moment (step 3), concrete crushing in compression was the first failure mode observed, due to the joint rotation and the resulting high compressive strain at the upper concrete surface. Bolts failures also happened later in the bottom bolt rows in tests 1, 2 and 6, because of higher tensile forces under sagging bending moment [Haremza et al, 2013]. The steel end-plates deformed in the bottom and centre part in all the tests, and showed a high ductility [Haremza et al, 2013]; Figure 8 shows, as an example, the final deformations of test 6 (700ºC and spring axial restraint). The evolution of the bending moment at the joint versus the beam axial load is presented in Figure 9 for tests 4, 5 and 6. During the heating phase (step 2), due to the thermal.
(7) expansions of beams, the beams ends moved in the outward direction, and compression loads were applied by the restraints. After the column loss (step 3), the axial restraints increased the compression loads because beams ends continued to move outwards.. +. Bending moment (kNm). 900 Step 3 (M ) Test 2 800 Test 3 700 Test 4 600 Test 5 500 Test 6 400 300 200 100 Time (hour) 0 -100 0 1 2 3 4 5 6 7 8 9 10 11 -200 -300 -400 -500 Step 2 (Temp.) -600. Fig. 7 - Joint bending moment versus a) rotation at the connection, b) time. LEFT 550 mm. RIGHT. 13 mm. 260 mm. 14 mm. 92 mm. 75 mm. Fig. 8 - Deformations of the joint at the end of test 6 (700ºC – spring axial restraint) Bending moment (kNm). Bending moment (kNm). +. 900 Step 3 (M ) 800 700 Sagging 600 bending 500 moment 400 300 200 100 Rotation (mrad) 0 -10 10 30 50 70 90 110 130 150 170 -100 -200 Test 1 -300 Test 2 Hogging Step 1 (M ) Test 3 bending -400 Test 4 -500 Step 2 (Temp.) moment Test 5 -600. Test 4 Test 5 Test 6. 800 600 400. Sagging bending moment. 200 Axial restraint load (kN). -1700 -1400 -1100 -800. Temperature increase. -500. 0 -200 -200 -400. 100. Hogging bending moment. -600. Compression Tension. Fig. 9 - Joint bending moment versus axial loads at the joint.
(8) 3. ANALYTICAL METHOD This section presents an analytical method developed at the University of Liege to predict the resistance of steel or composite joints submitted to both an axial force and a bending moment at elevated temperature. The model was developed in [Cerfontaine, 2004] (see also [Cerfontaine and Jaspart, 2005]) for steel joints at ambient temperature. It was extended to composite joints in [Demonceau, 2008] (see also [Demonceau and Jaspart, 2010]), in which a formula giving the resistance of the “new” component “concrete slab in compression” was introduced. Within the Robustfire project, this model was extended to elevated temperature. 3.1 M-N interaction curve for joint resistance When a joint is subjected to both bending moment and axial load, its resistance is represented by an interaction curve that can be evaluated following the procedure presented herein. The proposed analytical model is based on the component method (method recommended in the Eurocodes for the design of joints) and on the assumption that all components activated at failure are fully ductile, meaning a plastic redistribution of the forces is considered within the joint without any displacement limitations. The joint is divided into different rows (Figure 10) that can be activated in tension (T) or in compression (C). The resistance of each row can be calculated using the component method (i.e. using the rules from [Eurocode 3-1-8, 2005], [Eurocode 4-1-1, 2004] or from [Demonceau, 2008] for the component “concrete slab in compression”), knowing that this resistance is given by the weakest component involved in the row. These rows are listed below for the considered joint, with the corresponding components: • Row 1 (C): upper part of the slab in compression concrete slab + column web • Row 2 (T): slab reinforcement in tension • Row 3 (C): lower part of the slab in compression concrete slab + column web beam flange and web + column web • Row 4 (C): top flange in compression • • • • •. Row 5 (T): bolt row in tension column column web Row 6 (T): bolt row in tension column column web Row 7 (T): bolt row in tension column column web Row 8 (T): bolt row in tension column column web Row 9 (C): bottom flange in compression. flange + end-plate + bolts + beam web + flange + end-plate + bolts + beam web + flange + end-plate + bolts + beam web + flange + end-plate + bolts + beam web + beam flange and web + column web. For given bending moment and axial force, a row will be activated or not depending on the position of the neutral axis and whether the upper rows are in tension or in compression. In any case, the following equilibrium equations have to be fulfilled:. = = Where: • •. .ℎ. F is the force sustained by row i; it is taken positive in tension. ℎ is the distance from row i to the reference axis, positive for upper rows (the reference axis is arbitrary chosen at mid-height of the beam profile in Figure 10).
(9) Fig. 10 - Rows and reference axis. M (kN.m). Based on the previous considerations, the whole resistance curve can be established as follows. Considering first that the upper rows are in tension, the activated rows can easily be determined for any chosen position of the neutral axis (at the very top of the joint, between two successive rows or at the very bottom). Knowing the activated rows, the corresponding loading (M,N) can be computed using the equilibrium equations given just above. Indeed, all activated rows are supposed to sustain a force equal to their resistance (plastic distribution) while the other ones sustain a force equal to zero. One particular point of the resistance diagram can thus be determined for each position of the neutral axis. The same can be done for lower rows in tension. Finally, the whole interaction curve is established. Figure 11 shows the nominal M-N resistance curve of the considered joint at ambient temperature and Figure 12 gives the position of the neutral axis corresponding to each particular point of the interaction curve.. 800. HOGGING F. D E600. C. uppper rows in tension B. lower rows in tension. 400 G. COMPRESSION. A J. 200. H. I -3500 -3000 -2500 -2000 -1500 -1000 R. 0 -500 0 -200. K N (kN) 1000 1500 2000 L1 TENSION. 500 L2. -400 Q P O. N M -600 -800. SAGGING. Fig. 11 - Nominal resistance curve at ambient temperature.
(10) Fig. 12 - Position of the neutral axis for the particular points of the M-N resistance curve, for upper rows in tension (left) and for lower rows in tension (right) The same procedure can be applied at elevated temperature provided the temperature distribution in the joint is known. Each component resistance is then simply evaluated based on the material resistance at its given temperature. 3.2 Validation of the analytical model against experimental tests The aim of these analytical predictions is to be compared to the loading of the tested joints at failure. Consequently, the ultimate joint resistance should be predicted instead of the nominal resistance. That is why all safety factors were taken equal to 1,0 and the material ultimate resistances were considered instead of the yield resistances. The component temperatures were estimated based on the measurements made during the tests (they had to be extrapolated from the measure points which were not necessarily at the component locations). The material resistances at elevated temperatures were evaluated based on the Eurocode rules and material tests when available (see Section 2.4). The slab reinforcement remained at relatively low temperature during the tests and the ambient-temperature nominal resistance was thus considered (anyway, it is not activated under sagging moment). For concrete, the decrease in resistance with temperature was also given by the Eurocode but the ambient-temperature resistance was deduced from tests on concrete cubes at 20°C. For each test, the loading M+N of the joint at failure has been identified. This loading corresponds to one particular point on a (M,N) diagram and can be compared to the analytically predicted M-N interaction resistance (based on the temperature distribution recorded at the moment the joint fails). As the temperature distribution during the tests was not exactly the same in the right and left joints, one analytical resistance curve was computed for each side. Figure 13 and Figure 14 give examples of comparisons of the experimental resistances to the analytical predictions for Test 5 and Test 6 respectively (for the other tests, similar results are obtained [Haremza et al, 2012]). For tests 4 and 5, two different analytical curves were predicted (see Figure 13). The first one is the normal one, in which the resistance of the component “concrete slab in compression” is computed considering a given effective width where the compression stresses mainly develop close to the contact zone between slab and column flange. As the slab was observed to be crushed along its whole width at the end of the tests, a second analytical curve was determined considering the whole width of the tested specimen slab as effective..
(11) 1000. TEST 5. 20°C - analytical. HOGGING. 800 TEST 5 right analytical. M (kN.m). 600 400 200 COMPRESSION. -5000. -4000. -3000. 0 -2000. TEST 5 left analytical. N (kN). -1000-200 0. 1000. 2000. 3000. TENSION. -400. TEST 5 right experimental TEST 5 left experimental TEST 5 right - anal. all slab. -600 -800. TEST 5 left - anal. all slab. SAGGING. -1000. Fig. 13 - Comparison of the experimental resistances to the analytical curve for TEST 5 1000. TEST 6. HOGGING. 800 20°C - analytical. 400 200 COMPRESSION. -5000. -4000. 0 -3000. -2000. -1000-200 0. M (kN.m). 600. TEST 6 right analytical. N (kN) 1000. 2000. 3000. TENSION. -400. TEST 6 left analytical TEST 6 right experimental TEST 6 left experimental. -600 -800 -1000. SAGGING. Fig. 14 - Comparison of the experimental resistances to the analytical curve for TEST 6 These comparisons show good agreement between experimental and analytical results, which validates the model predicting the M-N resistance curve for joints at elevated temperature. 4. CONCLUSIONS Within this paper, investigations aiming at validating an analytical model to predict the M-N resistance of joints at elevated temperatures have been presented. The proposed analytical model is based on the component method, method recommended in the Eurocodes for the characterisation of the joint mechanical properties. The comparisons of the analytical predictions to the experimental results have demonstrated the accuracy of the proposed method. For the validation, the temperatures of the different joint components were extracted from the test measurements. In an actual design, the realisation of a 3D thermal analysis through an appropriate numerical tool is still needed. A perspective to the presented work is to propose one day a full analytical procedure, including the estimation of the component temperatures, in the image of what is already proposed for a specific joint configuration in [Demonceau et al, 2009]..
(12) 5. ACKNOWLEDGEMENTS The research that produced these results was supported by funding from the European Community's Research Fund for Coal and Steel (RFCS) under grant agreement n° RFSRCT-2008-00036, and also from Portuguese Foundation for Science and Technology (FCT) under the framework of the research project PTDC/ECM/110807/2009. Material support provided by PECOL, FELIZ and MARTIFER are gratefully acknowledged. 6. REFERENCES Cerfontaine F. “Etude de l’interaction entre moment de flexion et effort normal dans les assemblages boulonnés”. PhD thesis presented at the University of Liège. Belgium, 2004. Cerfontaine F. and Jaspart J.P. “Resistance of joints submitted to combined axial force and bending – Analytical procedures and comparison with laboratory tests”. Eurosteel 2005 proceedings. Maastricht, The Netherlands, June 2005. Demonceau J.F. “Steel and composite building frames : sway response under conventional loading and development of membrane effects in beams further to an exceptional action”. PhD thesis presented at the University of Liège. Belgium, 2008. Demonceau J.F., Hanus F., Jaspart J.P. and Franssen J.M. “Behaviour of single sided composite joints at room temperature and in case of fire after an earthquake”, International Journal of Steel Structures, Vol. 9, pp 329-342, December 2009 Demonceau J.F. and Jaspart J.P. “M-N interaction in beam-to-column joints – Development of a design model”, SEMC 2010: The Fourth International Conference on Structural Engineering, Mechanics and Computation, Cape Town, South Africa, 6-8 September 2010. Demonceau J.F., Huvelle C., Comeliau L., Hoang L. V., Jaspart J.P., Fang C., et al. “Robustness of car parks against localised fire (Robustfire)”, European Commission, Grant Agreement Number RFSR-CT-2008-00036, Final report, EUR 25864, 2013 (freely downloadable at http://bookshop.europa.eu/). EN 1991-1-2: 2002, “Eurocode 1: Actions on structures – Part 1-2: General actions – Actions on structures exposed to fire”, European committee for standardization, November 2002. EN 1993-1-2: 2005, “Eurocode 3: Design of steel structures – Part 1-2: General rules – Structural fire design”, European committee for standardization, April 2005. EN 1993-1-8: 2005, “Eurocode 3: Design of steel structures – Part 1-8: Design of joints”, European committee for standardization, May 2005. EN 1994-1-1: 2004, “Eurocode 4: Design of composite steel and concrete structures – Part 1-1: General rules and rules for buildings”, European committee for standardization, December 2005. Haremza C., Santiago A., Simoes da Silva L., Comeliau L. Hoang V. L., Demonceau J.F., Jaspart J.P., Fang C., Izzudin B., Elghazouli A., Nethercot D. and Obiala R. “Robustness of car parks against localised fire – Deliverable III”, European Commission, Grant Agreement Number RFSR-CT-2008-00036, 2012 (freely downloadable on http://orbi.ulg.ac.be/handle/2268/126851). Haremza C., Santiago A., Simões da Silva L. “Experimental behaviour of heated composite steel-concrete joints subject to variable bending moments and axial forces”, Engineering Structures 51, p150-165, 2013..
(13)
Figure


+4


Documents relatifs
(A-J) 1-isopropyl 2-méthylcyclohexane 1,1-dibromo 2-isopropylcyclopentane. 3-chloro 3-méthylcyclohexène
b) Ecrire un algorithme qui permet de calculer puis d'afficher l'image d'un réel saisit en entrée, lorsque c'est possible.. En déduire l'ensemble de
Une ……… statistique est une liste de données relevées sur une ……… ( par exemple les habitants d'un pays) à la suite de sondages, d'enquêtes, de mesures, etc. Indiquez
Donner la formule explicite associée à une suite arithmétique ( ) de 1 er terme et de raison. a) Exprimer en fonction de. Déterminer le sens de variations de la suite
Sarah’s father died in 1915 and her mother died also year later.. Thus, she started work in Mr Stuart’s house when she
On a relevé le nombre d’enfants dans chacune des familles d’un immeuble...
[r]
Pour chaque affirmation tu dois choisir une des réponses proposées en entourant la bonne case.. Tu peux également t'abstenir
