Vol. 2, No. S GEOPHYSICAL RESEARCH LETTERS May 197S
SATELLITE OBSERVATIONS OF THE NITRIC OXIDE NIGHTGLOW Jean-Claude Gerard*
Ins titut d ' As trophys ique
Universite de Liege, B4200-Ougree, Belgium
Abstract.
The NO a-bands have been
channels, labelled A•, recorded a weak
observed
photometrically by the ultra-
signal when the lineJof sight scanned
violet telescope onboard the TD-1 ESRO close to the horizon. This emission is
satellite.
The maximum
intensity for the
attributed to the NO a-bands.
Fig. 1
system is about 220 R, in good agreement
displays three such scans recorded on
with a previous rocket measurement.
16 and 17 December
1973 at a spacecraft
Assuming that the excitation is due to the altitude of 540 km and at various lati-
N + 0 + NO(C2•,
v=0) preassociation,
we
tudes. The altitude of the line of sight
used the observed profile to derive the
is indicated at the top of the figure.
atomic nitrogen density distribution.
We The solar zenith angle varies from
found a peak of about 9 x 107 cm-3 at
11076 to 97?7. The dotted lines show the
about 180 km. A comparison is made with
level of the background noise.
In the
theoretical
predictions
•nd some
impli-
cations of such
a high •(S) density are
discussed.
The NO a-bands have been observed in the •OO- nightglow spectrum by balloon-borne
(Cohen-Sabbin and Vuillemin, 1973) and
ro'6ket-borne u tl-•aviolet
spectrometers
(Feldman and Takacs, 1974). The first set of observations clearly revealed the
presence of the (0,1), (0,2), and (0,3) NO a-bands, but no absolute intensity or ver-
tical distribution has been deduced. The
rocket spectra showed
features from the
20-
NO a- and y-systems, but the geometry
of
•oo-
the observations was complicated by resonance scattering of the y-bands above a shadow altitude of 215 km. The excita- tion of the NO(C2•) state was attributed
<( 50-
to the chemiluminescent preassociation of
N and 0 in the reaction.
(C2•
N + 0 + NO
, v=0)
(1)
• z 20-
Photometric measurements of the
altitude distribution of the ultraviolet o o 200-
nightglow emission were obtained by the UV telescope onboard the ESRO TD-1A satellite in December 1973 and January 1974. During
this period in a hibernation mode, the •OO- satellite spun about its sun-stabilized
axis at a rate of 1.89 degrees/sec. Consequently, the optical axis of the
telescope scanned a plane parallel to the 50 terminator. The experiment was turned on
at high latitude in the dark sector and turned off when the plane of observation approached the terminator. One of the
*"Aspirant" of the Belgian National
Foundation for Scientific Research (NRS).
ALTITUDE OF THE LINE OF SIGHT (km)
68 , 120 170 217 260 i i i i I
= =
ORB.'
9755 = =
=
• LAT. ß 40 ø N • • •_•_ _ •_ ....
•A__:
•_JO
o.
L ....
s- -- -- •" -'
0 O0 O0 O0 0 0 0 0 0 0 0 0 ORB.: 9740 LAT.: 26 ø N SZA : 101.5 o o o o ß ß ß ß ß ORB.' 97 40 LAT.' 18 ø N SZA.97o.7 ß ß ß i 2 TIME (Sec)Now at the Laboratory for Atmospheric and Fig. 1. Example of three horizon scans Space Physics, University of Colorado, by the TD-1 UV telescope at various Boulder, Colorado 80302. solar zenith angles (SZA). The dots
indicate the number of counts/0.16 sec Copyright 197S by the American Geophysical Union. measured as a function of time.
180 Gerard' Satellite Observations of Nightglow
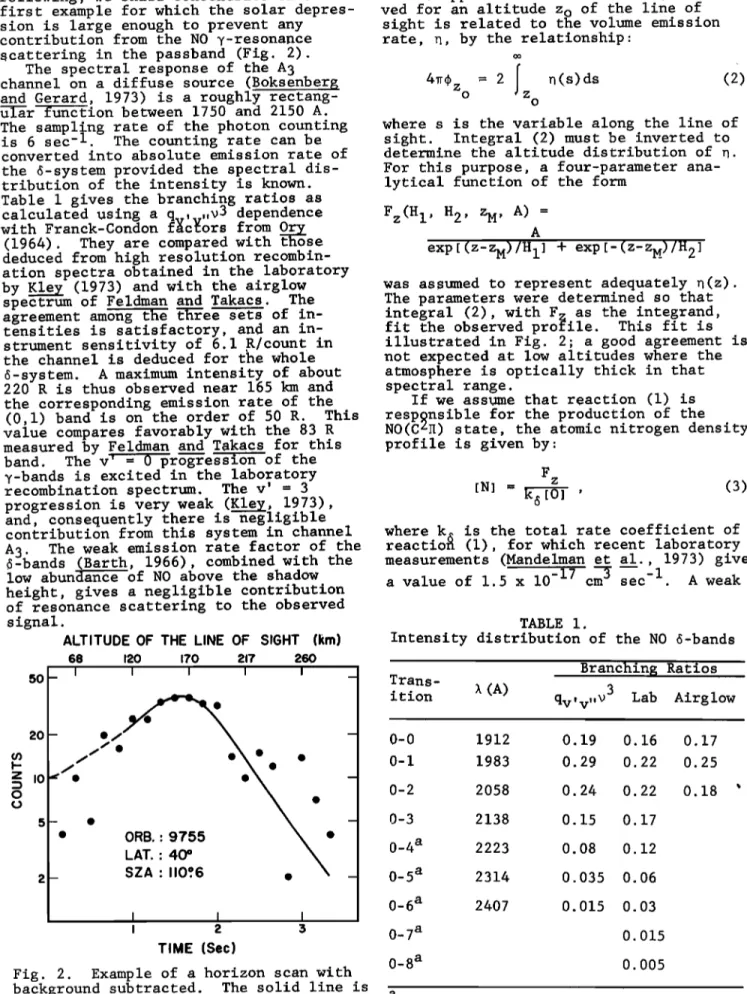
following, we sha%l concentrate on the
The apparent emission rate 4• obser-
first example for which the solar depres-
ved for an altitude z o of the line of
sion is large enough to prevent any
sight is related to the volume emission
contribution from the NO y-resonance rate, n, by the relationship' scattering in the passband (Fig. 2).
The
spectral
response
of the
A
3
channel on a diffuse source (Boksenber•
4• z = 2
n(s)ds
(2)
and Gerard, 1973) is a roughly rectang- o z
ular function between
1750 and 2150 A.
o
The
is 6 sec- . The counting rate can be
samplilng
rate of the
photon
counting
where
sight.
s is the
Integral
variable
(2) must be inverted to
along
the line of
converted into absolute emission rate of determine the altitude distribution of n. the a-system provided the spectral dis-
tribution of the intensity is known. Table 1 gives the branching ratios as
calculated using a q , ,,v3 dependence
with Franck-Condon f•c•ors from Ory
(1964). They are compared with those deduced from high resolution recombin-
ation spectra obtained in the laboratory
by Kley (1973) and with the airglow
spectrum of Feldman and Takacs. The
agreement among the three sets of in-
tensities is satisfactory, and an in- strument sensitivity of 6.1 R/count in the channel is deduced for the whole
a-system. A maximum
intensity of about
220 R is thus observed near 165 km and the corresponding emission rate of the(0,1) band is on the order of 50 R. This
value compares favorably with the 83 R
measured by Feldman and Takacs for this band. The v' = 0 progression of the y-bands is excited in the laboratory recombination spectrum. The v' = 3
progression is very weak (Kley, 19 73),
For this purpose, a four-parameter ana- lytical function of the form
F z(H1, H2' ZM' A) =
A
exp[(z'zM)/H
1] + exp[-(Z-ZM)/H
2]
was assumed to represent adequately •(z). The parameters were determined so that integral (2), with F as the integrand,
fit the observed
profile. This fit is
illustrated in Fig. 2; a good agreement is not expected at low altitudes where the atmosphere is optically thick in that spectral range.
If we assume that reaction (1) is respwnsible for the production of the NO(CZ•) state, the atomic nitrogen density profile is given by:
F
z (3)
IN] = k•[O] '
and, consequently there is negligible
contribution from this system in channel
where k• is the total rate coefficient of
A
3. The
weak
emission
rate factor of the reactio•
a-bands (Barth, 1966), combined with the low abundance of NO above the shadow
height, gives a negligible contribution
of resonance scattering to the observed signal.
ALTITUDE OF THE LINE OF SIGHT (l{m)
68 12:0 170 2:17 2:60 I I i I i 5o 2o z I0 ::3 0 5 ß/
// ß
LAT.:
40
ø
SZA' 110.ø6 I I I i 2 5 TIME (Sec)Fig. 2. Example of a horizon scan with background subtracted. The solid line is
a fit to the data.
(1), for which recent laboratory measurements (Mandelman et al., 1973) give
a value of 1.5 x 10
-17 cm
3 sec
-1
.A weak
TABLE 1.
Intensity distribution of the NO a-bands Branching Ratios
Trans- '
ition
t (A)
qv,v,,V
3 Lab Airglow
0-0 1912 0-1 1983 0-2 2058 0-3 2138 0-4 a 2223 0-5 a 2314 0-6 a 2407 0_7 a 0_8 a 0.19 0.16 0.17 0.29 0.22 0.25 0.24 0.22 0.18 0.15 0.17 0.08 0.12 0.035 0.06 0.015 0.03 0.015 0.005
Gerard' Satellite Observations of Nightglow 181
temperature dependence of k• (25% from and ions locally measured by the Atmos- 300 øK to 600 øK) has been •eglected here. phere Explorer C satellite was recently
The
result
of this
calculation
is illus- made
by
Rusch
et al. (197•)4•
They
pre-
trated in Fig. 3 where the atomic oxygen
dict high quantities of N
) (=1 x 10⁸
density
is taken
from
CIRA
(1972)
for an cs-3
at 180
•0)6
, cou•pled
with
low
NO
exospheric temperature of 800 øK, calculatedabundance (= cs-J), in very good for the day of observation. The curve agreement with these measurements.
gives
a maximum
density
of about
9 x 10⁷
High
atomic
nitrogen
densities
are
cm -• near 180 km. The gradient below expected to have the following conse- 150 km is very steep and is determined by quences-
chemical
reactions.
1. A large density
of N(4S) at early
The intensity of the signal observed
night gives very short NO lifetimes
is in agreement
with previous spectral
against reaction (4).
Consequently,
observations. Its altitude distribution below 280 km the nitric oxide den-
provides a method to determine the atomic
sitites can be expected to drop
nitrogen profile in the nighttime atmos-
drastically very soon after sunset.
phere provided reaction (1) only contrib-
2.
Coupling our calculation for œN]
utes
Other similar data to be analyzed will
to the
excitation
of the
NO
a-bands. at 160
Rusch et al.
km
wi,th
[NO] •- 5 x 106 cm-B
NO
measurements
by
provide information on the latitude dependence of the N density. The case illustrated in Fig. 3 corresponds to one
of the b•zg•est -' • scans and •^ I- L L !C• •e•c•d • • ^
density must probably be considered as an upper limit.
In the range of altitude considered
here, N(4S) atoms are produced by various
reactions and mainly destroyed by theprocess-
N(4S)
+ NO
+ N
2 + O,
(4)
whose
rate coefficient is 1.5 x 10 -12 /•
(Phillips and Schiff, 1962; Nicolet,
1965). Reaction (4) is also the dominant
destruction mechanism for nitric oxide below 250 ks. Consequently, the abun-
dance of N(4S) depends on the NO density
and vice-versa.
The experimental profile of Fig. 3 can be compared with recent models for the N(4S) and NO distributions. Strobel's
(1971) model at 18.30 L.T. predicts a maximum density IN] • 5 x 10⁶ cs-3 at
we føu•-• a production
rate =! x 1• 4
sec -1 for NO, which is somewhat
more
than the upper limit predicted by
of N and NO densities rule out an
accurate comparison until simultan-
eous measurements
of NO, N(4S) and
N(2D) can be made.
3.. Any analysis of the t1200 A dayglow
profile must take radiation
t,rapping
into account for such high N(•S) densities.
4.
The density of N
+ ions has been
extensively measured and can be used
to determine whether the amount of
atomic nitrogen deduced here is
consistent with the N
+ density.
The
analysis of the N
+ distribution
may
also provide information on the N density.More detailed discussion of the impli- cation of high œN] values can be done when the variability of the amount and vertical distribution of atomic nitrogen
is known. A direct simultaneous meas- an altitude of 240 km with an NO density urement of IN] and other constituents
of 4 x 10⁶ cs-3. A comparison of the NO, would also be most useful to clarify the
N(2D) and the densities of major neutrals
N-NO reaction scheme. Work along these
lines is in progress.
400 I I I
E hi
. References
• Barth, C. A., "The ultraviolet spectros-
mo
i0 oI
,•
K)II
i0 ?I
i0 eI
copy
of planets "in The middle
,ATOMIC NITROGEN NUMBER DENSITY (cm 'a) ultraviolet: Its science and tech- nology, pp. 18B•-%89, John Wiley and Fig. 3. Atomic nitrogen density profile Sons, 1966.
deduced from the NO •-bands intensity by Boksenberg, A., and J. C. Gerard, Ultra- inverting the solid curve of Fig. 2. violet observations of equatorial
Acknowledgments. We acknowledge with thanks C. Barth, I. Stewart, and P. Feld- man for their critical reading of the
manuscript. C. Chisholm and A. Tilkin
were most helpful with the data pro-
cessing. We thank the TD-1 team and the • European Space Operation centre (ESOC) which coordinated the telemetry opera-
tions. A NATO post-doctoral fellowship has partially sponsored the author's stay
182 Gerard' Satellite Observations of Nightglow
dayglow
above the F 2 peak, J. Geo-
osphere, J. Geophys.
Res., 70, 679,
phys. Res., 78, 4641, 1973. 1965. -
CIRA, COSPAR
International
Reference
Ory, H. A., Franck-Condon factors and
Atmosphere,
pp. 302-303, Akademie
electronic oscillator strengths for
Verlag, Berlin, 1972.
nitric oxide ultraviolet band sys-
Cohen-Sabbin,
J., and A. Vuillemin, Ultra-
tems, J. Chem.
Phys 40, 562, 1964.
violet nightglow
spectrum
from 1900 A Phillips, L• F17 •nd H. •i Schiff, Mass
to 3400 A, Astrophys. Space Sci., 24,
spectrometer studies of atom re-
127, 1973. actions, 1, Reactions in the atomic
Feldman, P. D., and P. Z. Takacs, Nitric
nitrogen-ozone system, J. Chem.
oxide gamma
and delta band emission
Phys., 3__6,
1509, 1962. -
at twilight, Geophys.
Res. Let., 1,
Rusch,
D. W., A. I. Stewart, P. B. Hays,
169, 1974.
and J. H. Hoffman, The NI(5200 A)
Kley, D., Mechanism der N+O rekombination
bei kleinen drucken, pp. 37-46, Habilitationsschrift, Bonn, 1973. Mandelman, M., T. Carrington, and R. A.
Young, Predissociation and its in- verse using resonance absorption
NO(C2•)
• X + O, J. Chem.
Phys., 5__8,
84, 1973.
Nicolet, M., Nitrogen oxides in the chem-
dayglow, J. Geophys. Res., 80, in press, 1975.
Strobel, D. F., Diurnal variation of
nitric oxide in the upper atmosphere, J. Geophys Res., 7__6, 2441, 1971.
(Received March 14, 1975; accepted March 14, 1975.)