Effects of short-chain
chlorinated paraffins on the
expression of key genes of
Gammarus pulex at two exposure
times
Jaegers J.
Joaquim-Justo C. Gismondi E.
University of Liege, Faculty of Sciences
Department of Biology, Ecology, and Evolution
Take Home Message:
SCCPs affect G. pulex after 7 or 21 days
Multiple biological functions impacted
Evidence of adaptation after 21 days
Ambient t° plays a role (16°C vs 20°C)
What are SCCPs?
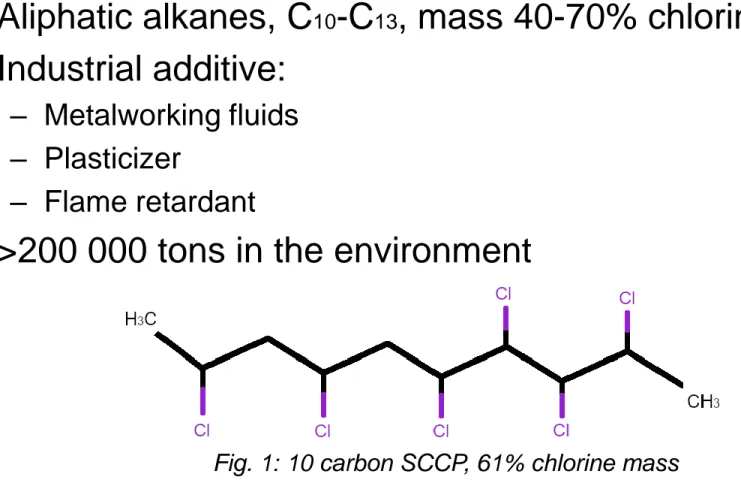
• Aliphatic alkanes, C10-C13, mass 40-70% chlorine
• Industrial additive:
– Metalworking fluids – Plasticizer
– Flame retardant
• >200 000 tons in the environment
Fig. 1: 10 carbon SCCP, 61% chlorine mass
In this work: chloroparaffin C10-13 63% Cl formulation (CAS n°: 85535-84-8)
Properties & Occurrence
• Persistent Organic Pollutant (POP) • Bioaccumulable + biomagnifiable
• Long range transport through air + water
• Developmental toxicity on fish and amphibians • Thyroid hormone disruptor in fish
• Found in waters (ng and µg/L range) + biota (ng/g range) • Present in Europe, North America, Asia, Australia, Arctic
Problem & Scope
• Toxic at environmental concentrations • Very few data on invertebrates
Can realistic SCCP exposure concentrations affect key
biological functions of a common freshwater
amphipod?
Materials and methods
Adult male G. pulex collected in the wild
Incubator: 20 2°C Incubator: 16 2°C
7-day acclimation to lab conditions
7- or 21-day exposure:
solvent control (acetone 0.01%) SCCP 1000 ng/L SCCP 100 ng/L SCCP 10 ng/L RNA extraction Reverse-transcription to cDNA RT-qPCR
Studied genes Acronym Biological function
Cu/Zn-Superoxide dismutase CuZnSOD
Antioxidant defences
Mn-Superoxide dismutase MnSOD
Se-dependant glutathione peroxidase SeGPX
Thioredoxin THX
Thioredoxin reductase THX Red
Catalase Cat
Glutathione-S-transferase GST Moult-inhibiting hormone MIH
Endocrine system
Farnesoic acid O-methyltransferase Famet
Ecdysteroid receptor EcR
Methylfarnesoate epoxidase CYP15A1
Na/K ATPase NaK Osmoregulation
Hemocyanin HC Respiration
Prophenoloxidase ProPO Immunity
Caspase 3 Casp3 Apoptosis control
Heat-shock protein 70 HSP70 Heat stress
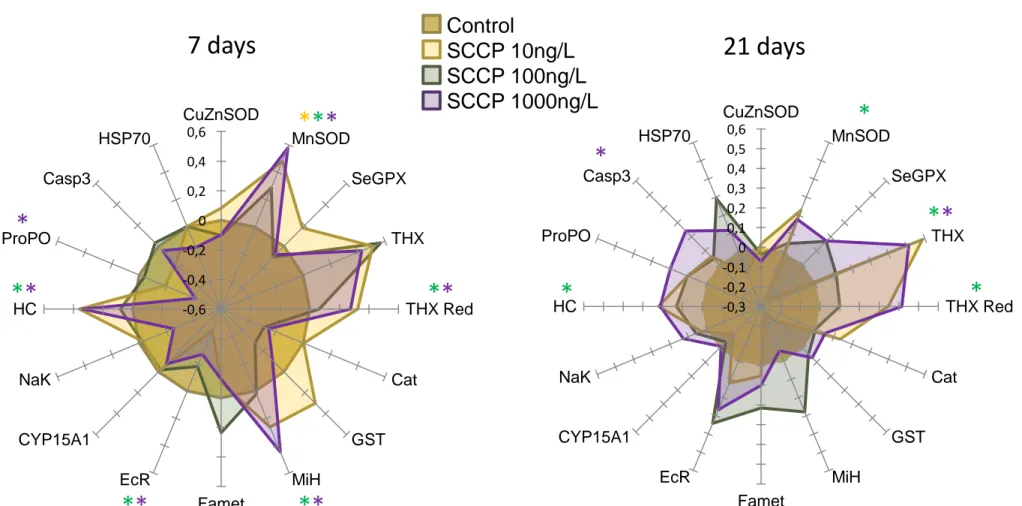
-0,6 -0,4 -0,2 0 0,2 0,4 0,6 CuZnSOD MnSOD SeGPX THX THX Red Cat GST MiH Famet EcR CYP15A1 NaK HC ProPO Casp3 HSP70 -0,3 -0,2 -0,1 0 0,1 0,2 0,3 0,4 0,5 0,6 CuZnSOD MnSOD SeGPX THX THX Red Cat GST MiH Famet EcR CYP15A1 NaK HC ProPO Casp3 HSP70
Results & Discussion
7 days Control SCCP 10ng/L 21 days
SCCP 100ng/L SCCP 1000ng/L *** ** ** ** ** * * ** * * *
Fig. 2: log2 fold-change values for gene expressions after SCCP exposure. Genes marked with (*) displayed a significant (p<0.05) difference with controls, colour coded to the
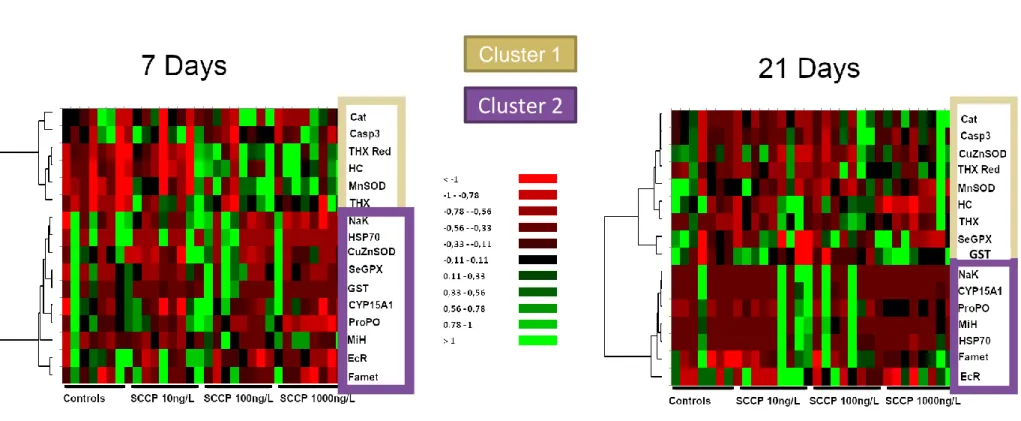
Results & Discussion
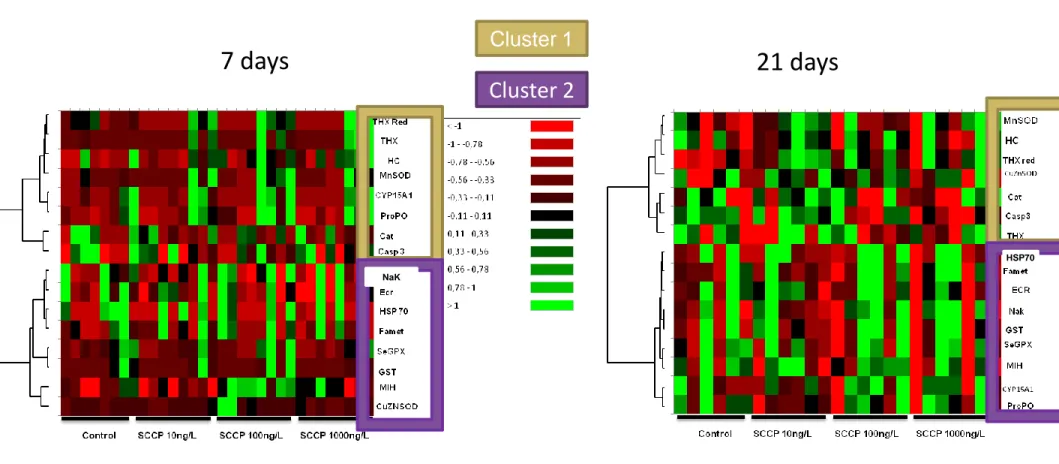
Cluster 1
Cluster 2
GST
Fig. 3: heatmaps with hierarchical clustering of genes by similarity of expression levels between exposure conditions. The 2 main clusters have been highlighted.
• Up-regulation of antioxidant genes
• Short-term inhibition of moulting
• Variations in HC and ProPO linked to moult
inhibition?
• Increase in caspase3 mRNA after 21 days
Results & Discussion
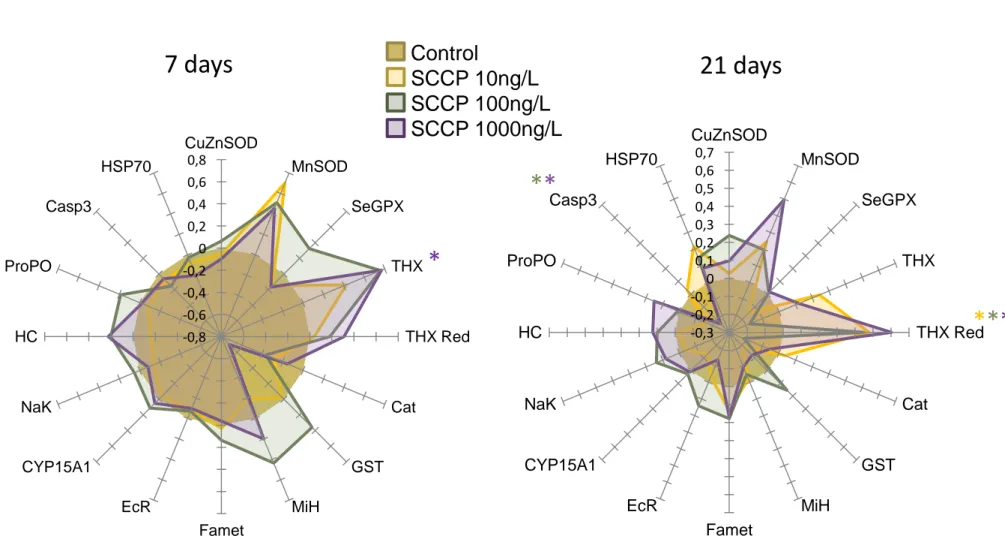
Comparison with 20°C exposure
-0,8 -0,6 -0,4 -0,2 0 0,2 0,4 0,6 0,8 CuZnSOD MnSOD SeGPX THX THX Red Cat GST MiH Famet EcR CYP15A1 NaK HC ProPO Casp3 HSP70 -0,3 -0,2 -0,1 0 0,1 0,2 0,3 0,4 0,5 0,6 0,7 CuZnSOD MnSOD SeGPX THX THX Red Cat GST MiH Famet EcR CYP15A1 NaK HC ProPO Casp3 HSP70 Control SCCP 10ng/L SCCP 100ng/L SCCP 1000ng/L 7 days 21 days * *** **Fig. 4: log2 fold-change values for gene expressions after SCCP exposure at 20°C. Genes marked with (*) displayed a significant (p<0.05) difference with controls, colour coded to the corresponding
Comparison with 20°C exposure
NaK
HSP70
Cluster 1
Cluster 2
Fig. 3: heatmaps with hierarchical clustering of genes by similarity of expression levels between 20°C exposure conditions. The 2 main clusters have been highlighted.
Conclusions
• 16°C range: many biological functions impacted (endocrine, antioxidant, respiration)
• 20°C range: antioxidant system highly up-regulated
=> At environmental concentrations! (≤1000 ng/L)
• Evidence of adaptation between 7 and 21 days • SCCP effects need to be further studied in