POTENTIAL FOR URBAN GREENING WITH GREEN ROOFS: A WAY TOWARDS
SMART CITIES
Mitali Yeshwant Joshi 1*, Wissal Selmi 1 , Marc Binard2, Gilles-Antoine Nys2, Jacques Teller 1
1 LEMA, Urban and Environmental Engineering Department, University of Liege, Belgium, 4000 - (mjoshi, wissal.selmi, jacques.teller)@uliege.be
Geomatic unit, SPHERES, Department of Geography, University of Liege, Belgium, 4000 – (marc.binard, ganys)@uliege.be Commission IV
KEY WORDS: Green roofs, remote sensing, GIS, LiDAR, smart cities, sustainability, socio-economic deprivation
ABSTRACT:
Cities are experiencing increased pressure on social, economic, and environmental sectors due to the rapid urbanisation and increasing risk owing to climate change affecting the urban environment. Solutions such as green roofs are often discussed in the context of smart and sustainable cities as they present a multi-functional and solution-oriented approach to address these challenges. Green roofs become extremely relevant in the context of highly urbanised and compact cities where impervious surfaces are abundant. Therefore, in this paper, we analyse the potential of green roofs at a city scale with the help of parameters such as area and slope of the roof and structure of the building. We also identify the priority zones based on environmental and socio-economic parameters. The study is carried out in the city of Liege, Belgium. The results suggest that around 20% (350 hectares) of the total buildings in the city have the potential for developing green roofs. Moreover, the potential of green roofs is quite significant in terms of roof area in the priority zone. Due to significant socio-economic deprivation in high priority zones, implementation of green roofs might not be affordable. Buildings with larger roof sizes are mostly owned by companies or commercial establishments, thus, making larger roofs more relevant for retrofitting green roof. Thus, our approach can act as a preliminary decision-making tool for urban planners to analyse the potential of green roofs and prioritize them in deprived areas.
* Corresponding author
1. INTRODUCTION
Unprecedented urbanisation along with the increasing climate change has led to increased pressure on social, economic and environmental sectors impacting the human life and the natural environment in the cities (Jha et al., 2012; Stephenne et al., 2016). Urban and environmental issues induced by the rapid growth of population and their consumption-driven lifestyles prove to be a challenge for urban planners (Dizdaroglu et al., 2012; Wu, et al., 2018). In such a situation, urban planners are redirected towards the frontier of sustainable cities (Sodiq et al., 2019). The rapid advancements in the information and communication technologies (ICTs) have also placed the concept of smart cities in the urban planning domain (Rice, Martin, 2020). Smart city concept has been promoted as an instrument to manage various urban and environmental challenges such as environmental pollution, urban heat island, biodiversity loss and socio-economic inequalities (Yigitcanlar et al., 2019). Many researchers have indicated that the smart and sustainable cities should be intertwined to achieve the desired outcome (Bouzguenda et al., 2019; Yigitcanlar et al., 2018). As a result, it is argued that cities could not be smart without being sustainable. Therefore, in this paper, we combine the smart and sustainable city approach with a view to addressing the aforementioned urban and environmental problems.
Nature-Based Solutions (NBS) are often put forward in the context of sustainable urban development. These solutions present a multi-functional and solution-oriented approach by addressing social, economic and environmental sustainability issues simultaneously (Dorst et al., 2019). Urban Green Infrastructure (UGI) such as green roofs are one of the NBS which are highly relevant in urban areas that are abundant in
impervious surfaces such as building roofs (Shafique et al., 2018). Moreover, high urban densities and compact nature of the cities make it difficult to implement other UGIs such as planting trees and developing urban green spaces. Furthermore, green roofs provide multiple urban ecosystem services such as energy efficiency, urban heat island mitigation, regulation of microclimate and provision of a better quality of life (Sharma et al., 2018; Langemeyer et al., 2020). Thus, green roofs with their multi-dimensional benefits aid in sustainable urban development.
Green roofs are a sustainable alternative to conventional roofs and are defined as the living vegetation installed on the building roofs (Guzmán-Sánchez et al., 2018; Mahdiyar et al., 2018). There are mainly of two types of green roofs, intensive and extensive (Peng, Jim, 2015). Intensive roofs are characterized by a thick layer of substrate with a diverse variety of plants whereas extensive roofs have a thinner layer of substrate which are light weight and require low level of maintenance as compared to intensive green roofs (Mahdiyar et al., 2018; Nardini et al., 2012). Most of the studies are concentrating on implementation of extensive type of green roofs as they incur lower installation and maintenance cost.
Having a potential for social acceptance (Mesimäki et al., 2017; Specht et al., 2016), green roofs can be incorporated at a city scale with the help of municipalities. However, due to different types of roofs and type of construction of respective buildings, not all the buildings are able to accommodate green roof strategy. Thus, identifying the potential for mobilizing the green roofs at a city scale is an essential prelude to its implementation. Apart from this, cities often witness an unequal distribution of green spaces. This not only affects the quality of life of citizens but also results in a discontinuity in green spaces affecting the
ISPRS Annals of the Photogrammetry, Remote Sensing and Spatial Information Sciences, Volume VI-4/W2-2020, 2020 5th International Conference on Smart Data and Smart Cities, 30 September – 2 October 2020, Nice, France
biodiversity (Braaker et al., 2014; Joimel et al., 2018). Moreover, there is a spatial variation of built-up densities which also results in different temperature in different parts of the city (Sharma et al., 2016). Additionally, socio-economic inequalities are evident in cities worldwide (UN-Habitat, 2012, 2013). Socio-economically deprived regions also experience a lower quality of life owing to the existing social, economic and environmental problems (Berhe et al., 2014). As UGIs such as green roofs are argued to have multiple benefits, it is important to prioritize their implementation accordingly.
Many studies have identified the potential of green roofs at various scales for different cities in the world. Building characteristics, for instance, building slope, area, orientation, and strength are mainly used for identifying the potential for developing green roofs (Karteris et al., 2016; Mallinis et al., 2014; Tian, Jim, 2012; Wilkinson, Reed, 2009; Santos et al., 2016). Study by Langemeyer et al. (2020), focused on identifying priority areas for implementing green roofs based on optimizing their ecosystem service provision. They include ecosystem services such as thermal regulation, runoff control, biodiversity, food production, social cohesion and recreation. A study by Herrera-Gomez et al., (2017), particularly identifies the areas where green roofs can be retrofitted in order to reduce urban heat island effect. As combining the identification of potential of green roofs with their prioritization is important, studies such as Silva et al., (2017) integrate the building characteristics with existing greens and population density to ensure urban greening in the areas where it is needed the most. A similar approach is used by Grunwald et al., (2017), where ecosystem services such as improvement of urban air quality, climate regulion, water retention and biodiversity enhancement are used to identify priority areas for developing green roofs. In this paper, we employ a similar approach of integrating the identification of potential of green roof with prioritization along with socio-economic development as an added parameter. We identify the potential of green roofs along with a prioritization based on i) lack of existing greens, ii) high temperature zones and iii) socio-economic deprivation. Altogether, we investigate whether the achieved potential of green roofs is beneficial in terms of society and environment suggesting their contribution to the sustainable smart cities.
2. MATERIALS AND METHODS 2.1 Study area and available datasets
Liege, situated in the Wallonia region of Belgium, is the third-most populous city of Belgium with a total of 195,965 inhabitants. The total area of Liege municipality is around 69 km2. There are 136,170 buildings in the city, with a total area of building roofs about 10 km2, which represents around 14% of the city area. There is a variety of roof and building structures in Liege, which makes the detection of the potential of green roofs challenging and crucial. This study is performed using different types of data sources (LiDAR, PICC (Projet Informatique de Cartographie Continue) data from Public Service of Wallonia (SPW)) which were analysed with the help of GIS environment (ArcMap Version 10.7.1, ESRI) and FME workbench.
2.2 Mapping potential of green roofs
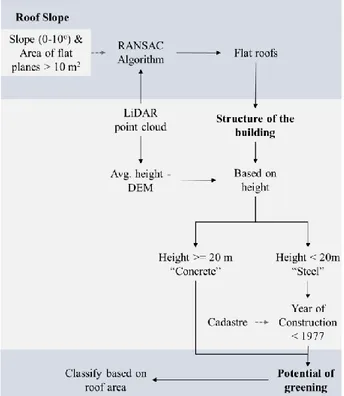
In this study, we mainly consider the building characteristics such as roof slope, area of the roof and structure of the building (Figure 1). Although any roof, irrespective of the slope, can be greened, high slope roofs may require additional support to avoid slipping of vegetation materials. Moreover, maintenance
of high sloped roof can be difficult. Additionally, flat rooftops require lower initial investment for retrofitting a green roof (Santos et al., 2016). Thus, we consider flat roofs to have potential for implementing green roofs.
To identify flat roofs, we used the LiDAR point cloud data obtained from SPW with a point density of 0.8 point/ m2. At first, we clipped the point cloud with existing building footprints of Liege obtained from the PICC data. We then analysed the point cloud within each building footprint to obtain the information on flat roofs as follows:
Figure 1. Methodology for identifying the potential of green roofs
Confronting the sparse nature of LiDAR data, the unsupervised interpolation of planes from point cloud could be a challenge (Cao et al., 2017). Several methods such as RANdom SAmple Consensus (RANSAC) (Schnabel et al., 2007) and the Hough transform (Ballard, 1987) allow to statistically ignore the outliers. In this methodology, we used the former as it is computationally more efficient than the Hough transform. RANSAC is currently running quicker and is better tailored for shape detection of roof planes (Tarsha-Kurdi et al., 2007). One disadvantage of unsupervised shape detection algorithms is the definition of initial parameters. Due to the sparse point density, the non-deterministic nature of RANSAC might detect inconsistent shapes. Depending on the starting points, which are randomly determinate, the results might differ between concurrent interpolations. Given that the junctions between clusters are more detailed, this problem is less encountered in high-density point clouds. Planes detection could thus lead to false positives and/or false negatives or spurious planes (Xu et al., 2015). To avoid misdetections, tuning parameters is often the responsibility of the expert. For this study, we need roofs that can be mobilized for greening. As building roofs/planes have obstructions such as chimneys, elevator shafts and staircases, retrofitting small sized roofs with green roof can be challenging. Therefore, we only consider planes with minimum area of 10 m2 and slope between 0- 10° (Rottensteiner et al.,
ISPRS Annals of the Photogrammetry, Remote Sensing and Spatial Information Sciences, Volume VI-4/W2-2020, 2020 5th International Conference on Smart Data and Smart Cities, 30 September – 2 October 2020, Nice, France
2014). Other planes are not considered as relevant. Two other limits have been set to prevent odd results: (a) the unsupervised algorithm will determine a maximum of 20 independent planes for each building. (b) the points that are more than 10 cm away from the detected shapes are considered to be outliers. These two considerations increase the robustness of the approach. The results for each building provide the number of flat planes, the percentage of flat area in a building footprint and the average height of the building.
Apart from the slope of the roofs, the building must have reserved structural capacity for accommodating a green roof. Buildings with a concrete structure have enough strength to adopt a green roof, whereas not all the buildings with a steel structure have the required reserved structural capacity. It is observed that taller buildings in Liege are made of concrete. Therefore, based on our knowledge, we assume that buildings with a height greater than or equal to 20 m have a concrete structure, whereas the buildings with height less than 20m to have a steel structure. We determine the height of building based on the average height that we computed using the LiDAR and the DEM data at 1 m resolution obtained from SPW. To identify the buildings made of steel with adequate strength, we analysed the building standards in Europe and Belgium since 1900. Based on these standards, we determined the reserve structural capacity of the building to accommodate green roofs. The structure of the buildings was indeed according to the norms that were in force during the period of construction. The buildings constructed before 1977 have strength more than required as they were built according to old standards, which were more conservative given their lower accuracy. The Eurocode was proposed in the year 1977 after which the buildings were built with the strength and capacity due to advanced technology. It is not possible to develop green roofs on these recent buildings without major structural changes. Also, the buildings constructed before 1977 are more than 40 years old, indicating the need for in-depth renovations which can be an opportunity to develop green roofs on the top of these buildings. Therefore, we consider buildings with steel structure that are constructed before 1977 to be structurally suitable for developing green roofs.
After identifying the potential buildings that conform to the criteria explained above, we classified the potential roofs based on the area and the percentage of area of the roofs that can be mobilized for green roofs. Figure 1 shows the flow of methodology used in this study.
2.3 Prioritizing the areas for implementing green roofs Green roofs are argued to provide several ecosystem services including mitigation of urban heat island effect, stormwater management and improve air quality along with improvement in the quality of life and environment. However, based on the available datasets and importance of these services, we focus on three main ecosystem services: increase in urban green areas, regulation of temperature and improving the quality of life in socio-economically deprived regions. Thus, we identified the areas with higher surface temperature, lower green areas, and socio-economically deprived regions to identify the priority zones for developing green roofs where the benefits of green roofs can be maximised.
To identify existing greens, we computed normalised difference vegetation index (NDVI). NDVI quantifies the vegetation by measuring the difference between near-infrared and red bands
(Eq.1). We used images from European Space Agency (ESA) taken by Sentinel-2 (10 m resolution) satellite on April 22nd, 2020 to compute NDVI. We used the bands that capture red (0.665 mm) and near infrared-NIR (0.842 mm) colours with band 4 and 8, respectively.
NDVI = (NIR – RED)/ (NIR + RED) (1) To calculate the surface temperature, we utilise LANDSAT-8 level 1 image captured on 27th June 2019. The data was procured from United states geological survey (USGS) at a resolution of 30 m and thermal band 11 was used. We computed the surface temperature (K) using equations 2 and 3 (USGS, 2019). We further converted the temperature values into degree Celsius (oC)
(2)
L
λ= TOA spectral radiance (Watts/(m2 * srad * μm))M
L =Band-specific multiplicative rescaling factor from the metadata,A
L=Band-specific additive rescaling factor from the metadata,Q
cal= Quantized and calibrated standard product pixel values (DN)(3)
T
= Top of atmosphere brightness temperature (K) where:K
1 =Band-specific thermal conversion constant from the metadata,K
2=Band-specific thermal conversion constant from the metadata
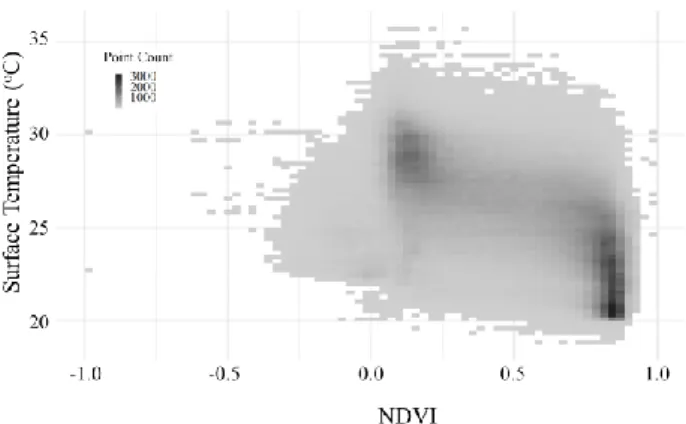
Areas with higher NDVI values can correspond to lower land surface temperature, mainly due to the influence of humidity on ground and evapotranspiration of plants on the surface (Su et al., 2010; Yuan, Bauer, 2007). Thus, we checked the correlation between the surface temperature and NDVI values using Pearson’s correlation coefficient. For the correlation, we resampled the surface temperature raster to 10 m resolution. The correlation test suggests that the correlation between NDVI and surface temperature is significant (at 95% confidence interval), and they are negatively correlated. Figure 2 also suggests that there is a negative correlation between NDVI and surface temperature. Thus, we included only the NDVI parameter in the analysis as we have it at a finer resolution as compared to surface temperature.
Figure 2. Collinearity between NDVI and Surface Temperature
ISPRS Annals of the Photogrammetry, Remote Sensing and Spatial Information Sciences, Volume VI-4/W2-2020, 2020 5th International Conference on Smart Data and Smart Cities, 30 September – 2 October 2020, Nice, France
For economically deprived regions, we use the socio-economic difficulty index developed by Bianchet et al. (2016) for entire Walloon region at statistical sectors level. The index was developed using Principal Component Analysis (PCA) which included a comprehensive list of indicators related to the origin of inhabitants, income, employment, and working conditions.
The socio-economic deprivation index is converted from statistical sector level and resampled to a raster of 10 m resolution. We normalised the values of NDVI and socio-economic deprivation index from 0 to 1 based on the priority. For instance, areas with lower greens or higher temperature and a higher deprivation index are considered to be 1. Thereafter, we performed a spatial multi-criteria analysis (SMCA), in which we multiplied the values of parameters giving equal weightage. We then divided the entire city into three zones namely, low, medium and high priority zones based on the scores obtained in SMCA. The threshold for categorizing the city into three categories are decided based on the interquartile range as given in table 1.
Category Values
Low <25th percentile Medium 25th – 75th percentile High >=75th percentile
Table 1. Categorization of SMCA score 3. RESULTS AND DISCUSSION
In this section, we present the results of the study. Firstly, we introduce the potential of green roofs in the city of Liege. For which we present the priority zones where the green roofs can be retrofitted to obtain maximum benefits.
3.1 Potential of green roofs
Our analysis suggests that around 22% (31004) of the buildings have roofs that are partially or entirely flat (0 – 10o). The total area of roofs which is flat is around 486 hectares. Out of these buildings, around 516 buildings are with a concrete structure and rest of the buildings have a steel structure. Around 26,908 (328 ha) buildings with a steel structure having flat roofs are constructed before 1977. Thus, a total of 27,424 (20%, 351 ha) buildings in Liege are having roofs that are completely or partially flat and a structure that can support roof greening. In our analysis of flat roof detection, we also identify the percentage of area that is flat in each of the building roof. Table 2 suggests that around 3425 (2%) buildings have their roofs completely flat which occupy 209.87 hectares of area. Additionally, around 19,900 (15%) buildings have roofs with more than 50% flat area. Rest of the buildings (4098, 3%) have less than 50% of their roof area as flat. As we have considered the planes greater than 10 m2 for detection of flat roofs, the selected building roofs, irrespective of percentage of flat area in each roof, have a flat region greater than 10 m2. Therefore, all these buildings (27,424, 20%) can be retrofitted with green roofs considering the available flat area and reserved structural capacity to support additional weight of green roof.
The distribution of potential roof sizes for roof greening in the city is as follows. We categorize the roofs in three categories as shown in figure 3. In general, the average size of potential roofs for greening is 128 m2 and around 50% of the buildings with
potential for roof greening have an area greater than 41 m2 which can be retrofitted with green roofs. Spatial distribution of potential of roof is shown in figure 5.
Percentage of flat area in each roof <50% 50 - 100% 100% Number of buildings 4098 19901 3425 Area occupied by flat planes 14.56 157.52 209.87
Table 2. Number and area of building roofs classified according to percentage of area occupied by flat plane
Figure 3. Area-wise percentage of total potential roofs (Area and number of buildings)
3.2 Prioritizing the areas for green roofs
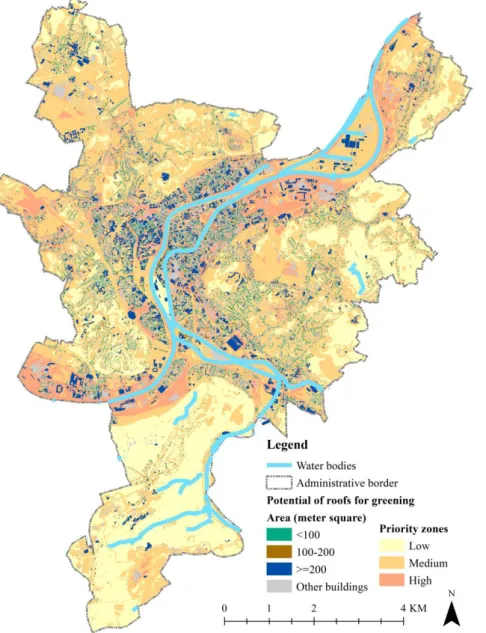
The city of Liege has substantially low green spaces in the central part which has high built-up density (Figure 4a). Thus, surface temperatures are also observed to be relatively higher in the central region (Figure 4b). Additionally, the socio-economic difficulty index is also observed to be high in the sectors near the city centre along the river and the eastern part of the city (Figure 4c). Based on these parameters, we delineated the regions with high, medium, and low priority as mentioned in section 2.3 (Figure 5).
Priority zone
% of roof area which can be greened
<0.5 0.5-1 1 Low No. of buildings 67 (0.05%) 393 (0.3%) 96 (0.07%) Area (ha) 0.3 3.6 8.14 Medium No. of buildings 1921 (1%) 10927 (8%) 1747(1%) Area (ha) 6.8 82.7 98.5 High No. of buildings 2110 (2%) 8581 (6.3%) 1582 (1%) Area (ha) 7.4 71.1 103.1
Table 3. Priority-wise percentage of total potential roofs in terms of total area of roofs and number of buildings in each
category with respect to percentage of flat roof area.
ISPRS Annals of the Photogrammetry, Remote Sensing and Spatial Information Sciences, Volume VI-4/W2-2020, 2020 5th International Conference on Smart Data and Smart Cities, 30 September – 2 October 2020, Nice, France
Figure 4. Spatial distribution of (a) NDVI, (b) Surface temperature (c) Socio-economic deprivation index in Liege
Figure 5. Potential of green roofs in the city of Liege along with priority zones
ISPRS Annals of the Photogrammetry, Remote Sensing and Spatial Information Sciences, Volume VI-4/W2-2020, 2020 5th International Conference on Smart Data and Smart Cities, 30 September – 2 October 2020, Nice, France
Around 1700 hectares of the city area comes under the high priority zone, in which there are around 44% of the total buildings. Around 20% (12,273 buildings, 167 hectares) of these buildings have the potential to retrofit green roofs. Around 3423 hectares area comes under the medium priority zone, which consists of 52% of the total buildings in the city. Around 20% (14,595, 173 hectares) of these buildings have the potential for retrofitting green roofs. The low priority zone accounts for around 1700 hectares which has around 4485 buildings. Around 12% of these buildings have the potential for roof greening.
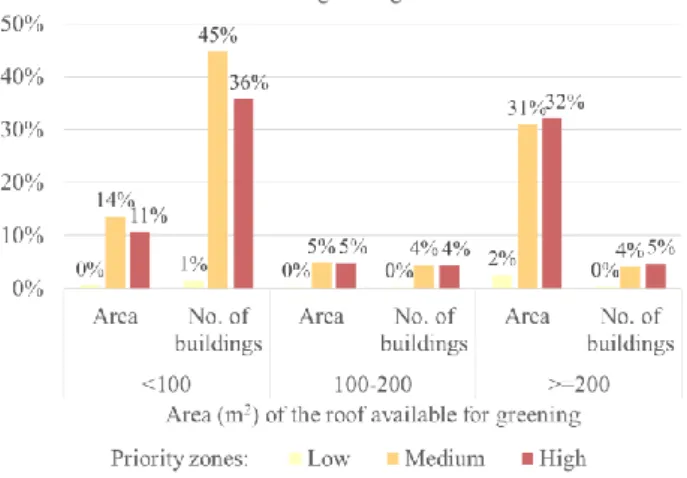
Figure 6. Area-wise and priority-wise percentage of total potential roofs (Area and number of buildings) Table 3 shows the distribution of potential roofs with respect to percentage of flat area in a roof, in terms of total area and number of buildings in each of the priority zone. In comparison to other zones, high priority zone has the largest area of buildings with roofs that are completely flat (103 hectares). Apart from this, classification of potential roofs in terms of area of roof available for greening suggests that there is a large number of buildings with area less than 100 m2 (figure 6). It is evident that although the buildings with roof area greater than 200m2 are a few (figure 6), developing them can provide a larger area with green roofs. A significant number of these roofs with large areas are in priority zones. It is easier to develop green roofs in such conditions as the number of building owners is reduced and greening large areas may lead to economies of scales.
3.3 Discussion
Around 20% (351 hectares) of the buildings in Liege have a potential for greening. Around 12% of these buildings have complete flat roofs and rest of the buildings roofs that are partially flat. Even though partially flat, the roof sizes are above 10 m2. Although there are around 20% buildings with potential of greening, around 88% of these buildings are composed of roofs which are partially flat. As per our methodology, we only identify the planes which are between 0 – 10 degrees and are greater than 10 m2 area. The area values are summed up in the end to provide the area available for greening. There is a possibility that the planes are not adjoint and are away from each other. Therefore, the roofs that are reported to have a larger area for greening might have 2 small areas which are disjoint. Disjoint flat roofs, though, might not be problematic, can bring maintenance issues. Thus, further investigation for roofs that are partially flat is needed.
Apart from this, most of the buildings in the city of Liege have pitched roofs. The potential of roof greening is relatively lower than other cities (Biljecki, Dehbi, 2019; Silva et al., 2017), mainly due to less number of flat roofs. Building stock in Wallonia region in general and in Liege is very old (Singh et al., 2013), resulting in large number of pitched roofs. It has been argued that green roofs can also be developed on slightly pitched roofs (below 20°) (Santos et al., 2016). Thus, there may be more potential for developing green roofs than what is analysed in the paper. However, it is important to note that the installation and maintenance costs for pitched roofs are much higher as compared to flat roofs (Teotónio et al.,2018). Additionally, our study also highlights that there are around 77% of the buildings with a roof area greater than or equal to 10 m2 which are constructed before the implementation of Eurocodes. Out of these, some of the buildings have flatter roofs, however most of them are observed to have a pitched roof. Nevertheless, most of these buildings are more than 40 years old, indicating the need for in-depth renovations which can be an opportunity to develop green roofs on top of these buildings.
Apart from this, the identification of priority regions suggests that the potential of green roofs is lower in high priority region as compared to the medium priority region when analysed in terms of number of roofs, but it is quite significant when analysed in terms of total area. The roofs that are completely flat which are in high priority region account for 103 hectares of area for retrofitting green roofs. It is important to note that high priority zone which are socio-economically deprived to an extent might not be able to support the cost of implementing the green roofs, especially for smaller roofs owned by households. On the contrary, large roofs are typically owned by companies. It is essential to identify solutions to make green roofs cost effective especially for larger ones. As the built-up density is relatively higher in the high priority region, implementation of green roofs on the potential buildings can be beneficial. 3.4 Limitations and future scope
The present study proposes a simple approach for identifying the green roofs and prioritizing the zones for their implementation. In this study, we identified the potential of green roofs with the help of three parameters, area and slope of the roofs and structure of the building. However, more parameters such as identifying the shaded areas and the building use can enhance the analysis.
Apart from this, as mentioned earlier, roofs that are partially flat need to be further investigated. Moreover, we considered the buildings with a height greater than 20m to be made of concrete. However, a validation of roof slopes and structure is still required to fine-tune the results. Furthermore, we considered roof area greater than 10m2 to have potential to develop green roofs. However, due to obstructions such as chimneys and elevator shafts, there is a need to identify the net available area on each roof for developing the green roofs.
Additionally, in this study, we also prioritized the zones where green roof implementation can yield benefits in terms of environment and socio-economic development. For this we used NDVI, surface temperature and socio-economic deprivation index. As NDVI includes all the greens in the city, it is difficult to gauge the spatial distribution of existing public green spaces in the city. Due to lack of data on existing public green spaces, parameter related to access to green spaces in the city has not
ISPRS Annals of the Photogrammetry, Remote Sensing and Spatial Information Sciences, Volume VI-4/W2-2020, 2020 5th International Conference on Smart Data and Smart Cities, 30 September – 2 October 2020, Nice, France
been considered. An approach similar to Oehrlein et al., (2019) can be used in increasing the accessibility to green spaces. Apart from this, city of Liege is situated on the banks of river Meuse. With increase in climate change, the risk of flooding can increase. Considering a parameter related to stormwater management in prioritizing the installation of green roof can enhance the analysis. Apart from this, the ecosystem services such as biodiversity enhancement, air quality and recreation are also provided by green roofs. The SMCA including versatile ecosystem services related parameters as done by Langemeyer et al. (2020) can be integrated in our study in future.
4. CONCLUSIONS
UGIs are recognized as important instruments in addressing urban environmental problems by providing the ecosystem services. UGI such as green roofs are gaining popularity owing to their multiple benefits and their ability to provide these benefits in compact cities. In this study, we proposed a simplistic approach for identifying the potential of green roofs along with identification of priority regions in the context of Liege, Belgium.
Our analysis concludes that Liege offers a green roof potential area of about 350 hectares on 20% of the total buildings in the city. According to the analysis for priority zones, we observed that the high priority zone mainly comprises of regions in the city centre near the river and in some parts in the east. Based on the discussed benefits in the literature, developing green roofs in this zone can yield maximum benefits. We observed that the potential of green roofs in the high priority zones as compared to the moderate priority zone is low in terms of number of roofs but is significant in terms of area of roofs. Moreover, the high priority zone of Liege, especially the region in the centre of the city has significantly high built-up density, which makes green roofs implementation extremely relevant. The results also indicate the importance of cost-effective green roof solutions as high priority zones also experience socio-economic deprivation to an extent. However, owing to their multiple benefits, developing green roofs on the potential roofs can have a significant impact on the urban environment. Additionally, green roofs can be combined with other UGIs for better ecosystem services.
The methodology used in this study is straightforward but depends upon the availability and quality of datasets. Moreover, the benefits of green roofs can be analysed with the help of modelling techniques. However, our approach can act as a preliminary decision-making tool for urban planners to analyse the potential of green roofs and prioritize them in the deprived areas. Moreover, this approach can be used for other cities in Belgium and Europe with contextual modifications.
REFERENCES
Ballard, D. H. (1987). Generalising the Hough transform to detect arbitrary shapes. In Readings in Computer Vision (pp. 714–725). https://doi.org/10.1016/b978-0-08-051581-6.50069-6 Berhe, R. T., Martinez, J., & Verplanke, J. (2014). Adaptation and Dissonance in Quality of Life: A Case Study in Mekelle, Ethiopia. Soc. Indic. Res., 118(2), 535–554.
Bianchet, B., Descamps, J., Ruelle, C., Wilmotte, P.-F., Bastin, F., Mercenier, C., & Claeys, D. (2016). Localisations
prioritaires en matière de dynamisation et de rénovation des quartiers urbains existants. Namur.
Biljecki, F., & Dehbi, Y. (2019). Raise the roof: Towards generating LOD2 models without aerial surveys using machine learning. ISPRS Ann. Photogramm. Remote Sens. Spat. Inf. Sci.,
4(4/W8), 27–34.
Bouzguenda, I., Alalouch, C., & Fava, N. (2019, October 1). Towards smart sustainable cities: A review of the role digital citizen participation could play in advancing social sustainability. Sustain. Cities Soc., Vol. 50, p. 101627.
Braaker, S., Ghazoul, J., Obrist, M. K., & Moretti, M. (2014). Habitat connectivity shapes urban arthropod communities: the key role of green roofs. Ecology, 95(4), 1010–1021.
Cao, R., Zhang, Y., Liu, X., & Zhao, Z. (2017). 3D building roof reconstruction from airborne LiDAR point clouds: a framework based on a spatial database. Int. J. Geogr. Inf. Sci.,
31(7), 1359–1380.
Dizdaroglu, D., Yigitcanlar, T., & Dawes, L. (2012). A micro-level indexing model for assessing urban ecosystem sustainability. Smart Sustain. Built Environ., 1(3), 291–315. Dorst, H., van der Jagt, A., Raven, R., & Runhaar, H. (2019, August 1). Urban greening through nature-based solutions – Key characteristics of an emerging concept. Sustain. Cities Soc., Vol. 49, p. 101620. https://doi.org/10.1016/j.scs.2019.101620 Guzmán-Sánchez, S., Jato-Espino, D., Lombillo, I., & Diaz-Sarachaga, J. M. (2018). Assessment of the contributions of different flat roof types to achieving sustainable development.
Build. Environ., 141, 182–192.
Jha, A. K., Bloch, R., & Lamond, J. (2012). Cities and flooding:
A guide to integrated urban flood risk management for the 21st century. Washington, DC, US: The World Bank
Joimel, S., Grard, B., Auclerc, A., Hedde, M., Le Doaré, N., Salmon, S., & Chenu, C. (2018). Are Collembola “flying” onto green roofs? Ecol. Eng., 111, 117–124.
Karteris, M., Theodoridou, I., Mallinis, G., Tsiros, E., & Karteris, A. (2016). Towards a green sustainable strategy for Mediterranean cities: Assessing the benefits of large-scale green roofs implementation in Thessaloniki, Northern Greece, using environmental modelling, GIS and very high spatial resolution remote sensing data. Renew. Sustain. Energy Rev., 58, 510–525. Langemeyer, J., Wedgwood, D., McPhearson, T., Baró, F., Madsen, A. L., & Barton, D. N. (2020). Creating urban green infrastructure where it is needed – A spatial ecosystem service-based decision analysis of green roofs in Barcelona. Sci. Total
Environ., 707, 135487.
Mahdiyar, A., Tabatabaee, S., Abdullah, A., & Marto, A. (2018). Identifying and assessing the critical criteria affecting decision-making for green roof type selection. Sustain. Cities
Soc., 39, 772–783. https://doi.org/10.1016/j.scs.2018.03.007
Mallinis, G., Karteris, M., Theodoridou, I., Tsioukas, V., & Karteris, M. (2014). Development of a nationwide approach for large scale estimation of green roof retrofitting areas and roof-top solar energy potential using VHR natural colour orthoimagery and DSM data over Thessaloniki, Greece. Remote
Sens. Lett., 5(6), 548–557.
Mesimäki, M., Hauru, K., Kotze, D. J., & Lehvävirta, S. (2017).
ISPRS Annals of the Photogrammetry, Remote Sensing and Spatial Information Sciences, Volume VI-4/W2-2020, 2020 5th International Conference on Smart Data and Smart Cities, 30 September – 2 October 2020, Nice, France
Neo-spaces for urban livability? Urbanites’ versatile mental images of green roofs in the Helsinki metropolitan area, Finland. Land Use Policy, 61, 587–600.
Nardini, A., Andri, S., & Crasso, M. (2012). Influence of substrate depth and vegetation type on temperature and water runoff mitigation by extensive green roofs: Shrubs versus herbaceous plants. Urban Ecosyst., 15(3), 697–708. https://doi.org/10.1007/s11252-011-0220-5
Oehrlein, J., Niedermann, B., & Haunert, J. H. (2019). Analyzing the Supply and Detecting Spatial Patterns of Urban Green Spaces via Optimization. J. Photogramm. Remote Sens.
Geoinf. Sci., 87(4), 137–158.
Peng, L. L. H., & Jim, C. Y. (2015). Economic evaluation of green-roof environmental benefits in the context of climate change: The case of Hong Kong. Urban For. Urban Green.,
14(3), 554–561. https://doi.org/10.1016/j.ufug.2015.05.006
Rice, J., & Martin, N. (2020). Smart infrastructure technologies: Crowdsourcing future development and benefits for Australian communities. Technol. Forecast. Soc. Change, 153, 119256. Rottensteiner, F., Sohn, G., Gerke, M., Wegner, J. D., Breitkopf, U., & Jung, J. (2014). Results of the ISPRS benchmark on urban object detection and 3D building reconstruction. ISPRS J. Photogramm. Remote Sens., 93, 256– 271.
Santos, T., Tenedório, J. A., & Gonçalves, J. A. (2016). Quantifying the city’s green area potential gain using remote sensing data. Sustain., 8(12). https://doi.org/10.3390/su8121247 Schnabel, R., Wahl, R., & Klein, R. (2007). Efficient RANSAC for point-cloud shape detection. Comput. Graph. Forum, 26(2), 214–226. https://doi.org/10.1111/j.1467-8659.2007.01016.x Shafique, M., Kim, R., & Rafiq, M. (2018, July 1). Green roof benefits, opportunities and challenges – A review. Renew.
Sustain. Energy Rev., Vol. 90, pp. 757–773.
Sharma, A., Conry, P., Fernando, H. J. S., Hamlet, A. F., Hellmann, J. J., & Chen, F. (2016). Green and cool roofs to mitigate urban heat island effects in the Chicago metropolitan area: evaluation with a regional climate model. Environ. Res.
Lett., 11(6), 064004.
Sharma, A., Woodruff, S., Budhathoki, M., Hamlet, A. F., Chen, F., & Fernando, H. J. S. (2018). Role of green roofs in reducing heat stress in vulnerable urban communities - A multidisciplinary approach. Environ. Res. Lett., 13(9).
Silva, C. M., Flores-Colen, I., & Antunes, M. (2017). Step-by-step approach to ranking green roof retrofit potential in urban areas: A case study of Lisbon, Portugal. Urban For. Urban
Green., 25, 120–129.
Singh, M. K., Mahapatra, S., & Teller, J. (2013). An analysis on energy efficiency initiatives in the building stock of Liege, Belgium. Energy Policy, 62, 729–741.
Sodiq, A., Baloch, A. A. B., Khan, S. A., Sezer, N., Mahmoud, S., Jama, M., & Abdelaal, A. (2019, August 1). Towards modern sustainable cities: Review of sustainability principles and trends. J. Clean. Prod., Vol. 227, pp. 972–1001.
Specht, K., Weith, T., Swoboda, K., & Siebert, R. (2016). Socially acceptable urban agriculture businesses. Agron.
Sustain. Dev., 36(1), 1–14.
Stephenne, N., Beaumont, B., Hallot, E., Wolff, E., Poelmans, L., & Baltus, C. (2016). Sustainable and smart city planning using spatial data in Wallonia. ISPRS Ann. Photogramm.
Remote Sens. Spat. Inf. Sci., IV-4/W1, 3–10.
Su, W., Gu, C., & Yang, G. (2010). Assessing the Impact of Land Use/Land Cover on Urban Heat Island Pattern in Nanjing City, China. J. Urban Plan. Dev., 136(4), 365–372.
Tarsha-Kurdi, F., Landes, T., & Grussenmeyer, P. (2007). Hough-transform and extended RANSAC algorithms for automatic detection of 3D building roof planes from LiDAR data. Proceedings of ISPRS Workshop on Laser Scanning 2007
and SilviLaser 2007, 407–412.
Teotónio, I., Silva, C. M., & Cruz, C. O. (2018). Eco-solutions for urban environments regeneration: The economic value of green roofs. J. Clean. Prod., 199, 121–135.
Tian, Y., & Jim, C. Y. (2012). Development potential of sky gardens in the compact city of Hong Kong. Urban For. Urban
Green., 11(3), 223–233.
UN-Habitat. (2012). State of the world’s cities 2012/2013 :
Prosperity of cities. Nairobi, Kenya:UN-Habitat
UN-Habitat. (2013). The State of European Cities in Transition
2013: Taking stock after 20 years of reform. Nairobi,
Kenya:UN-Habitat
USGS. (2019). Landsat 8 (L8) Data Users Handbook. South Dakota, US: USGS
Wilkinson, S. J., & Reed, R. (2009). Green roof retrofit potential in the central business district. Prop. Manag., 27(5), 284–301. https://doi.org/10.1108/02637470910998456
Wu, Y., Zhang, W., Shen, J., Mo, Z., & Peng, Y. (2018). Smart city with Chinese characteristics against the background of big data: Idea, action and risk. J. Clean. Prod., 173, 60–66. Xu, B., Jiang, W., Shan, J., Zhang, J., & Li, L. (2015). Investigation on the Weighted RANSAC Approaches for Building Roof Plane Segmentation from LiDAR Point Clouds.
Remote Sens., 8(1), 5. https://doi.org/10.3390/rs8010005
Yigitcanlar, T., Kamruzzaman, M., Foth, M., Sabatini-Marques, J., da Costa, E., & Ioppolo, G. (2019, February 1). Can cities become smart without being sustainable? A systematic review of the literature. Sustain. Cities Soc., Vol. 45, pp. 348–365. Yigitcanlar, T., Sabatini-Marques, J., Lorenzi, C., Bernardinetti, N., Schreiner, T., Fachinelli, A., & Wittmann, T. (2018). Towards Smart Florianópolis: What Does It Take to Transform a Tourist Island into an Innovation Capital? Energies, 11(12), 3265.
Yuan, F., & Bauer, M. E. (2007). Comparison of impervious surface area and normalized difference vegetation index as indicators of surface urban heat island effects in Landsat imagery. Remote Sens. Environ., 106(3), 375–386.
ISPRS Annals of the Photogrammetry, Remote Sensing and Spatial Information Sciences, Volume VI-4/W2-2020, 2020 5th International Conference on Smart Data and Smart Cities, 30 September – 2 October 2020, Nice, France