Astronomy
&
Astrophysics
https://doi.org/10.1051/0004-6361/202037997
© ESO 2020
Photometry and high-resolution spectroscopy of comet
21P/Giacobini-Zinner during its 2018 apparition
?
Y. Moulane
1,2,3, E. Jehin
2, P. Rousselot
4, J. Manfroid
2, Y. Shinnaka
5, F. J. Pozuelos
2, D. Hutsemékers
2,
C. Opitom
1,6, B. Yang
1, and Z. Benkhaldoun
31European Southern Observatory, Alonso de Cordova 3107, Vitacura, Santiago, Chile
2Space sciences, Technologies & Astrophysics Research (STAR) Institute, University of Liège, Liège, Belgium e-mail: youssef.moulane@doct.uliege.be
3 Oukaimeden Observatory, High Energy Physics and Astrophysics Laboratory, Cadi Ayyad University, Marrakech, Morocco 4Institut UTINAM UMR 6213, CNRS, Univ. Bourgogne Franche-Comté, OSU THETA, BP 1615, 25010 Besançon Cedex, France 5Koyama Astronomical Observatory, Kyoto Sangyo University, Motoyama, Kamigamo, Kita-ku, Kyoto 603-8555, Japan 6Institute for Astronomy, University of Edinburgh, Royal Observatory, Edinburgh EH9 3HJ, UK
Received 20 March 2020 / Accepted 8 June 2020
ABSTRACT
We report on photometry and high-resolution spectroscopy of the chemically peculiar Jupiter-family comet (hereafter JFC) 21P/Giacobini-Zinner. Comet 21P is a well-known member of the carbon-chain-depleted family, but also displays a depletion of amines. We continuously monitored the comet over more than seven months with the two TRAPPIST telescopes (TN and TS), covering a wide heliocentric distance range from 1.60 au inbound to 2.10 au outbound with a perihelion at 1.01 au on September 10, 2018. We computed and followed the evolution of the dust- (represented by A f ρ) and gas-production rates of the daughter species OH, NH, CN, C3, and C2 and their relative abundances to OH and to CN over the cometary orbit. We compared them to those measured in the previous apparitions. The activity of the comet and its water production rate reached a maximum of (3.72 ± 0.07) × 1028mol s−1on August 17, 2018 (rh= 1.07 au), 24 days before perihelion. The peak value of A(0) f ρ was reached on the same date (1646 ± 13) cm in the red filter. Using a sublimation model for the nucleus, we constrained the active surface of the nucleus using the slow-rotator model. The abundance ratios of the various species are remarkably constant over a wide range of heliocentric distances before and after perihelion, showing a high level of homogeneity of the ices in the surface of the nucleus. The behaviour and level of the activity of the comet is also remarkably similar over the last five orbits. In the coma dust colour, 21P shows reflective gradients similar to JFCs. We obtained a high-resolution spectrum of 21P with UVES at ESO Very Large Telescope one week after perihelion. Using the CN B-X (0, 0) violet band, we measured12C/13C and14N/15N isotopic ratios of 100 ± 10 and 145 ± 10, respectively, both in very good agreement with the ratios commonly found in comets. We measured an ortho-para abundance ratio of NH3of 1.16 ± 0.02, corresponding to a nuclear spin temperature of Tspin= 27 ± 1 K, which is similar to other comets. While the abundance ratios in the gaseous coma reveal a peculiar composition, the isotopic and ortho-to-para ratios appear entirely normal. We performed a dynamical simulation of 21P and found that it is likely a young member of the JFC population. We favour a pristine composition scenario to explain the chemical peculiarities of this comet.
Key words. comets: general – comets: individual: 21P/Giacobini-Zinner – techniques: photometric – techniques: spectroscopic
1. Introduction
Comet 21P/Giacobini-Zinner (hereafter 21P) is a Jupiter-family comet (JFC) with a short period of 6.5 yr. 21P was discovered in 1900 by Michel Giacobini and was rediscovered by Ernst Zinner in 19131. After its discovery, 21P was observed in most of its apparitions, and many photometric and spectroscopic measure-ments were reported. In September 1985, 21P was the first comet visited by the International Cometary Exporer (ICE) spacecraft to study the interaction between the solar wind and the cometary atmosphere (Von Rosenvinge et al. 1986;Scarf et al. 1986). 21P is also known as the parent body of the Draconids meteor shower (Beech 1986;Egal et al. 2019). Many spectroscopic-photometric studies at various wavelength ranges have been performed since its discovery (Schleicher et al. 1987; Cochran & Barker 1987; ?Based on observations collected at the European Southern Observa-tory under ESO program 2101.C-5051.
1 https://ssd.jpl.nasa.gov/sbdb.cgi?sstr=21P;old=0;
orb=0;cov=0;log=0;cad=0#discovery
Fink & Hicks 1996;Weaver et al. 1999;Lara et al. 2003;Combi et al. 2011), including production rate measurements and atomic and molecular abundances. 21P is the prototype of depleted comets in C2 and C3with respect to CN and to OH (Schleicher
et al. 1987;A’Hearn et al. 1995). The relative abundances of C2 and C3 are about five and ten times lower than those measured in typical comets (A’Hearn et al. 1995). 21P was found to also be depleted in NH (Schleicher et al. 1987;Kiselev et al. 2000) and NH2(Konno & Wyckoff 1989;Beaver et al. 1990;Fink 2009).
The physical properties of 21P were investigated in the pre-vious apparitions. Its nucleus size is not well determined; the average estimate of its radius is about 1–2 km (Tancredi et al. 2000;Królikowska et al. 2001;Pittichová et al. 2008). Its rotation period is not well constrained; a wide range from 9.5 to 19 h was estimated (Leibowitz & Brosch 1986). The activity of 21P has shown an asymmetric light curve with respect to perihelion in the previous apparitions. In 1985, the production rates pre-perihelion were twice higher than post-perihelion at heliocentric distances of 1.0–1.5 au (Schleicher et al. 1987). The highest gas and dust
production was observed about one month before perihelion for the previous apparitions (Schleicher et al. 1987; Hanner et al. 1992; Lara et al. 2003). Both its unusual composition and the behaviour of its activity during multiple apparitions make 21P an object of great interest. In addition, as it is the parent body of the Draconids, a study of its dust properties might be valuable. The 2018 apparition was very favourable for ground-based obser-vations because the comet was close to both the Sun and Earth at the same time and reached high elevation. Many observed the comet again for the 2018 return using various advanced instru-mentation (IR and optical spectrographs on large telescopes) in order to better understand these peculiarities.
This work is organised as follows: after the introduction and historical background given in Sect.1, we describe the observ-ing circumstances and the reduction process of images obtained with the Transiting Planets and Planetesimals Small Telescope (TRAPPIST) and spectra obtained with UVES at the Very Large Telescope (VLT) in Sect. 2. In Sect. 3 we compute the pro-duction rates and discuss the gas and dust activity pre- and post-perihelion as well as the properties of the dust. The rela-tive molecular abundances and their evolution with respect to the heliocentric distance are discussed in Sect.4and compared to the IR abundances of the mother species. In Sect.5we present the nitrogen and carbon isotopic ratios and the NH2(and NH3) ortho-para ratio derived from the UVES high-resolution spec-trum. In Sect.6we investigate the dynamical evolution of comet 21P within the last 105yr. Discussion of the chemical composi-tion of 21P and the possible scenarios of its deplecomposi-tion in carbon species are given in Sect.7. The summary and conclusions are given in Sect.8.
2. Observation and data reduction 2.1. Photometry (TRAPPIST)
We started monitoring 21P with TRAPPIST-North (hereafter TN) at the beginning of June 2018 when the comet was at 1.55 au from the Sun. The comet was then observed from the Southern Hemisphere with TRAPPIST-South (hereafter TS) from the beginning of September 2018. The pair of TRAPPIST telescopes (Jehin et al. 2011) is very useful in this case as it allowed a continuous monitoring of the comet before and after perihelion. We collected images with the cometary HB narrow-band filters (Farnham et al. 2000) to measure the production rates of the rad-icals OH, NH, CN, C3, and C2. We also acquired images with the dust-continuum filters BC, GC, and RC for blue, green, and red (Farnham et al. 2000). We used the broad-band filters B, V, Rc, and Ic (Bessell 1990) to compute the A f ρ parameter, which is a proxy of the dust production rate (A’Hearn et al. 1984), and to derive the dust colours.
Throughout the passage of the comet, we made a high-cadence monitoring of 21P with images taken about twice a week. On photometric nights, we also obtained long series of observations with the gas narrow-band filters, especially CN and C2 filters, to measure the variations in production rates during the same night that are caused by the rotation of the nucleus. We chose the exposure time of the different filters depending on the brightness of the comet. We used exposure times between 60 and 240 s for the broad-band filters and between 600 and 1500 s for the narrow-band filters. Observational circumstances and the number of sets of each filter are summarised in TableA.1. We started to collect data three months before perihelion to four months after perihelion. The comet reached perihelion on September 10, 2018, at a heliocentric distance of 1.01 au and a
Table 1. Scale lengths and fluorescence efficiency of different molecules at 1 au scaled by r−2
h .
Molecules Parent Daughter g-factors
(km) (km) (erg s−1mol−1) OH(0,0) 2.4 × 10⁴ 1.6 × 10⁵ 1.49 × 10⁻¹⁵ NH(0,0) 5.0 × 10⁴ 1.5 × 10⁵ 6.27 × 10⁻¹⁴ CN(∆υ = 0) 1.3 × 10⁴ 2.1 × 10⁵ 2.62 × 10⁻¹³ C3(λ = 4050 Å) 2.8 × 10³ 2.7 × 10⁵ 1.00 × 10⁻¹² C2(∆υ = 0) 2.2 × 10⁴ 6.6 × 10⁴ 4.50 × 10⁻¹³ Notes. The scale lengths are equivalent to the lifetimes of molecules as we used a constant radial velocity of 1 km s−1 (A’Hearn et al.
1995). The fluorescence efficiency is taken from Schleicher’s website (https://asteroid.lowell.edu/comet/gfactor.html).
geocentric distance of 0.39 au. In total, the comet was observed on 50 different nights with both telescopes, 13 nights before perihelion and 37 nights after. We used the same procedures as described in our previous papers (e.g.Opitom et al. 2015a; Moulane et al. 2018and references therein) to reduce the data and to perform the flux calibration. To compute the production rates, we converted the flux of different gas species into column densities and adjusted their profiles with a Haser model (Haser 1957). This simple model, which is widely used, is based on a number of assumptions. Outgassing is assumed to be isotropic, and the gas has a constant radial velocity of 1 km s−1. Parent molecules emitted by the nucleus decay by photodissociation to produce the observed daughter molecules. The model adjust-ment was performed at a physical distance of 10 000 km from the nucleus. Table1shows the scale lengths and g-factors of dif-ferent molecules at 1 au scaled by r−2
h . More details about the Haser model and its parameters are given in our previous works (seeMoulane et al. 2018and references therein). We would like to point out that we used the same parameters asSchleicher & Knight(2018) for the previous apparitions of 21P. We derived the A f ρ parameter, a proxy for the dust production (A’Hearn et al. 1984), from the dust profiles in the cometary dust continuum BC, GC, and RC filters and the broad-band Rc and Ic filters. It was computed at 10 000 km from the nucleus and corrected for the phase-angle effect according to the phase function normalised at θ= 0◦derived by D. Schleicher2.
2.2. Spectroscopy (UVES/VLT)
We obtained one spectrum of comet 21P with the Ultraviolet-Visual Echelle Spectrograph (UVES) mounted on the Unit 2 telescope (UT2) at ESO’s VLT on September 18, 2018 (a week after perihelion, rh= 1.01 au and ∆ = 0.40 au) under Director’s Discretionary Time. We used the UVES standard settings DIC#1 346+580 covering the range 3030 to 3880 Å in the blue and 4760 to 6840 Å in the red. We used a 0.4400 wide slit, providing a resolving power R ∼ 80 000. We obtained one single exposure of 3000 s at 8h35 UT with a mean air-mass of 1.7. This exposure provided two different spectra, which covered one of the above mentioned spectral ranges each.
The ESO UVES pipeline was used to reduce the spectra in the extended-object mode, keeping the spatial information. The spectra were corrected for the extinction and flux cali-brated using the UVES master response curve provided by ESO. 2 http://asteroid.lowell.edu/comet/dustphase.html
27
28
29
Log[Q(OH)]
25
26
Log[Q(NH)]
Schleicher 1985 Schleicher 1998 Schleicher 2018TN+TS 201825
26
Log[Q(CN)]
24
25
Log[Q(C
2)]
23
24
-1.6
-1.4
-1.2
-1
1.2
1.4
1.6
Log[Q(C
3)]
Heliocentric distance (au)
2
3
-1.6
-1.4
-1.2
-1
1.2
1.4
1.6
Log[A(0)f
ρ
(R)]
Heliocentric distance (au)
Ehlert et al. 2019Fig. 1.Logarithm of the production rates (in mol s−1) of each observed species and of the A(0) f ρ parameter (in cm) of comet 21P during its 2018 return (this work andSchleicher & Knight 2018) compared with two previous apparitions in 1985 and 1998 (Schleicher & Knight 2018) as a function of heliocentric distance. The dashed vertical line represents the perihelion distance on September 10, 2018. The maximum of the gas and dust activity was reached at 1.07 au from the Sun on August 17, 2018, 24 days before perihelion.
One-dimensional spectra were then extracted by averaging the 2D spectra with simultaneous cosmic-ray rejection and then cor-rected for the Doppler shift due to the velocity of the comet with respect to Earth. More details about the UVES data reduction are given in the UVES manual3. The dust-reflected sunlight was finally removed using a reference solar spectrum BASS20004. A more detailed description of the steps for UVES data reduction and the solar spectrum subtraction is given in Manfroid et al. (2009) and references therein.
3. Activity and composition 3.1. Gas-production rates
Along with our monitoring of comet 21P with the TRAPPIST telescopes, we derived the OH, NH, CN, C3, and C2 produc-tion rates. They are summarised in TableA.2, and their evolution as a function of the heliocentric distance is compared with two previous passages in Fig.1.
We started to detect most of the radicals in the coma by the end of June 2018 (except for NH, which was detected one month later). The various production rates and the dust activity 3 ftp://ftp.eso.org/pub/dfs/pipelines/uves/
uves-pipeline-manual-22.17.pdf
4 http://bass2000.obspm.fr/solar_spect.php
slowly increased as the comet approached the Sun (from 1.52 to 1.07 au). The highest activity was reached at 1.07 au from the Sun, on August 17, 24 days before perihelion. It then started to decrease rapidly after perihelion. CN was detected in our data until the end of 2018 at 1.66 au, while OH, C3, and C2 were no longer detected after the beginning of November at 1.4 au and NH in early October at 1.2 au. We found that like for the pre-vious apparitions (Schleicher et al. 1987), the production rates pre-perihelion are higher by more than a factor two than post-perihelion. It is clear from Fig. 1 that the asymmetric activity is seen for all species, and this behaviour does not change over the various apparitions (Schleicher et al. 1987; Combi et al. 2011), as shown also in Fig. 2 for the water-production rate. The same behaviour has been reported for the parent molecule (H2O, CO, CH4, C2H2, C2H6, NH3, and CH3OH) production rates derived at IR wavelengths during the 2018 passage (Faggi et al. 2019;Roth et al. 2020). This might be due to the shape of the nucleus and its spin-axis orientation. This effect has been observed in several comets, such as 9P/Tempel 1 (Schleicher 2007), 81P/Wild 2 (Farnham & Schleicher 2005), and also for comet 67P/Churyumov-Gerasimenko (Schleicher 2006;Opitom et al. 2017). It has been shown very clearly by the Rosetta mis-sion that the highest activity of 67P was clearly associated with the illumination of the most southern regions, which received the highest solar flux, and were subject to intense erosion
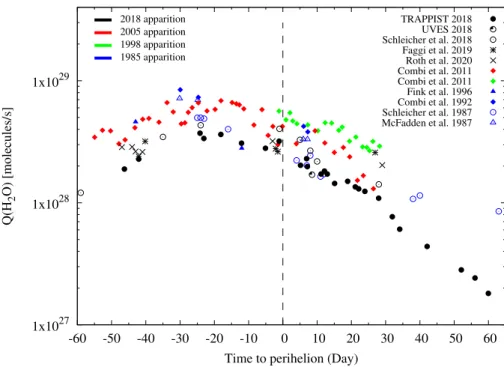
1x1027 1x1028 1x1029 -60 -50 -40 -30 -20 -10 0 10 20 30 40 50 60 2018 apparition 2005 apparition 1998 apparition 1985 apparition Q(H 2 O) [molecules/s]
Time to perihelion (Day)
McFadden et al. 1987 Schleicher et al. 1987 Combi et al. 1992 Fink et al. 1996 Combi et al. 2011 Combi et al. 2011 Roth et al. 2020 Faggi et al. 2019 Schleicher et al. 2018 UVES 2018 TRAPPIST 2018
Fig. 2. H2O production rates of comet 21P as a function of days to perihelion in 2018 com-pared to the previous apparitions (1985, 1998, and 2005). The data are described in more detail in Sect.3.2.
(Lai et al. 2019). Recently,Marshall et al.(2019) have show for those three comets that the nucleus shape, the spin-axis orienta-tion, and the distribution of activity on the cometary surface can explain the light curve of the water-production rate as a function of the heliocentric distance.
Around the activity maximum, the production rates are almost the same as those measured in the previous apparitions, showing that the activity level of 21P did not decrease over the last five orbits. Our production rates usually agree very well with those derived by Schleicher & Knight (2018), who used the same technique, while we note a discrepancy at large heliocentric distance and post-perihelion in the 1985 and 1998 apparition data (Schleicher et al. 1987; Schleicher & Knight 2018). This could be due to a sensitivity problem in their data as the production rates seem to level off on either side of perihelion, while the distance increased to a higher activity level of the comet after perihelion in the past. It has been also found that there is no significant change in the production rates of hypervolatile molecules (CO, CH4, and C2H6) in comet 21P over the three different apparitions, 1998 (Weaver et al. 1999; Mumma et al. 2000), 2005 (DiSanti et al. 2012), and 2018 (Faggi et al. 2019;Roth et al. 2020).
3.2. H2O production rate
The water-production rate is the most significant indicator of the activity of a comet. It can be measured directly from near-infrared observations or derived from OH emission at 3090 Å and radio wavelengths or from H Lyman-α emission at 1216 Å (Combi et al. 1986) assuming that both OH and H arise from the dissociation of H2O. In this work, we computed the vector-equivalent water-production rates according to an empirical procedure based on a comparison of OH and water-production rates derived from the mean lifetimes, velocities, and scale lengths given byCochran & Schleicher(1993).Schleicher et al. (1998) built an empirical relationship Q(H2O) = 1.361r−0.5
h Q(OH) based on an rh−0.5dependence of the H2O out-flow velocity, a photodissociation branching ratio for water to OH of 90%, and the heliocentric distance. Figure 2 shows the
water production we derived compared to previous apparitions (with different techniques) as a function of days to perihe-lion. We used the formula given above to convert Q(OH) into water production rates for theSchleicher & Knight(2018) data. Combi et al.(2011) derived the production rates from the H Ly-α emission observed by the Solar Wind ANisotropy (SWAN) instrument on board the Solar and Heliospheric Observatory (SOHO) in 1998 and in 2005. The Combi & Feldman (1992) values are derived from H Ly-α emission observed by the IUE mission for the 1985 apparition. From the Pioneer Venus Orbiter ultraviolet system (UVS) instrument, McFadden et al. (1987) derived the water-production rates from OH (3090 Å) emis-sion. Fink & Hicks(1996) derived the water-production rates from the [OI](1D) forbidden-line doublet using the correlation between the water-production rates and the total photon lumi-nosity. Faggi et al. (2019) and Roth et al. (2020) measured the water-production rates directly from near-infrared spectra. TRAPPIST and UVES data points are from this work (see Sects. 3.2and5.1). The maximum in the last four apparitions was reached about one month before perihelion and does not change over all apparitions, but we observe a clear systematic difference between the narrow-band and spectroscopic meth-ods in the optical on one hand and the measurements made from the space observations of the H Ly-α emission in the UV on the other hand. The maximum of the water production we measured was on August 17, 24 days before perihelion, and it reached (3.72 ± 0.07) × 1028mol s−1, in good agreement with the
Schleicher & Knight(2018) measurement of 4.20 × 1028mol s−1 at the heliocentric distance of 1.07 au. Using the same tech-nique for the 1985 apparition,Schleicher et al.(1987) reported Q(H2O) = 4.85 × 1028 mol s−1 when the comet was at 1.05 au from the Sun. Using high-resolution infrared spectroscopy, Weaver et al.(1999) measured ∼2–3 × 1028mol s−1at rh= 1.10 au in 1998. For the 2005 apparition, Combi et al.(2011) found a value of 5.80 × 1028mol s−1from the H Ly-α emission observed by the SWAN/SOHO at rh= 1.08 au. Comparing these data, we found that the water-production rates measured by Combi & Feldman(1992) in 1985 andCombi et al.(2011) in 2005 are sys-tematically higher by a factor of about two than our results in
Table 2. Active area (km2) and active fraction of the surface (%) for 21P using the slow-rotator model at some interesting heliocentric distances.
Date UT rh Active area Active fraction
(au) (km2) (%) (a) 2018 Jun. 22 –1.49 4.9 ± 0.1 17.5 ± 11.6 (b) 2018 Aug. 17 –1.07 12.0 ± 0.2 42.5 ± 28.0 (c) 2018 Sep. 09 –1.01 9.0 ± 0.2 32.0 ± 21.3 (d) 2018 Sep. 15,16,17 +1.02 6.9 ± 0.1 21.5 ± 14.0 (e) 2018 Nov. 09 +1.31 0.90 ± 0.04 3.3 ± 2.2
Notes. (a) The first measurement during our monitoring campaign, (b) the maximum activity during our monitoring campaign, (c) the last measurement before perihelion passage, (d) the mean of the first mea-surements after perihelion passage with similar heliocentric distances of 1.02 au, and (e) the last and minimum measurements during our monitoring campaign. Large errors in the active fractions of the surface come from the large uncertainties in the radius of the nucleus, which we adopted as 1.5 ± 0.5 km (see Sect.3.3for details).
2018. This offset between various techniques has been reported in previous studies and as early as in studies for comet 1P/Halley (Schleicher et al. 1998). The origin of this discrepancy is not clear, but it is obvious that the agreement is good when the same technique is used. This indicates that the level of activity of 21P was the same over the past four decades and did not decrease, like that of comet 41P/Tuttle-Giacobini-Kresak, which lost as much as 30 to 40% of its activity from one orbit to the next (Moulane et al. 2018).
3.3. Active area of the nucleus
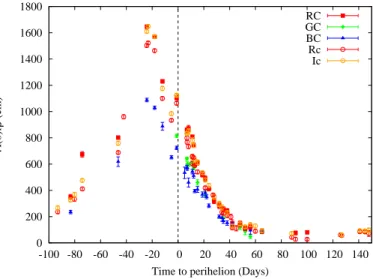
To estimate the active area of the nucleus surface, we mod-elled the water production using the sublimation model of Cowan & A’Hearn (1979). Because of the low thermal iner-tia of cometary nuclei (Gulkis et al. 2015), the slow-rotator approach was adopted in a number of cases as the most appro-priate way for computing the cometary out-gassing (see e.g. Bodewits et al. 2014; Lis et al. 2019). The slow-rotator model assumes that every facet of the nucleus is in equilibrium with the solar radiation incident upon it, with the rotational pole pointed at the Sun. As mentioned previously, the size of the 21P nucleus, which is necessary to convert the active area into the active fraction of the whole surface, is not well constrained so far, with a radius ranging from 1 to 2 km. To estimate the active fraction of the surface, we therefore assumed a radius of 1.5 ± 0.5 km. Moreover, we assumed a bond albedo of 5 and a 100% infrared emissivity (see e.g.A’Hearn et al. 1989;McKay et al. 2018, 2019). We found that the active area of 21P dur-ing our monitordur-ing campaign varied from ∼5 km2 at 1.49 au pre-perihelion, reached a maximum of ∼12 km2at 1.07 au pre-perihelion, and decreased to ∼1 km2 at 1.31 au post-perihelion. Table 2 shows the lowest and highest active areas and active fraction for 21P using the slow-rotator model at some interest-ing heliocentric distances. We obtained different values than previous estimates given byCombi et al.(2019). The reason is twofold. First, the already mentioned discrepancy in the water-production rates found through different observational tech-niques (see Sect.3.2), and second, the model used by the authors (fast rotator), which is less appropriate to describe the cometary outgassing. 0 200 400 600 800 1000 1200 1400 1600 1800 -100 -80 -60 -40 -20 0 20 40 60 80 100 120 140 A(0)f ρ (cm)
Time to perihelion (Days)
RC GC BC Rc Ic
Fig. 3.A(0) f ρ parameter measurements, computed at 10 000 km from the nucleus and corrected for the phase-angle effect, for the broad band (Rc and Ic) and narrow-band cometary filters (RC, GC, and BC) as a function of days to perihelion.
3.4. Dust properties
We computed the A(0) f ρ parameter at 10 000 km, as defined by A’Hearn et al.(1984), using broad-band (Rc and Ic) and narrow-band dust continuum filters (RC, GC, BC) (see Table A.2). Figure 3 shows its evolution as a function of time to perihe-lion. Our results agree very well with those reported byEhlert et al. (2019), as shown in the bottom right panel of Fig. 1. Like for the gas, the maximum was reached on August 17 with a value of (1646.1 ± 12.8) cm in the red narrow-band RC fil-ter. About the same value was reported on previous apparitions at the same heliocentric distance (Schleicher et al. 1987;Lara et al. 2003; Pittichová et al. 2008). For a detailed description of the dust environment and its evolution, a more sophisticated model should be used, such as the Monte Carlo model pre-sented byMoreno et al.(2012), which was used successfully in a number of cases (see e.g. Pozuelos et al. 2015,2018;Moreno et al. 2016a,b,2017). This study will be presented in a separate paper.
We used the A(0) f ρ values obtained with the narrow-band filters, which are not contaminated by the gas emission, to derive the dust colours. The normalised reflectivity gradients between wavelength λ1and λ2are defined as (A’Hearn et al. 1984;Jewitt
& Meech 1986)
Sv(%/1000 Å) =A f ρ1− A f ρ2 A f ρ1+A f ρ2 ×
2000
λ1− λ2. (1)
λ1 and λ2 are the effective wavelengths of the filters: BC[4450 Å], GC[5260 Å], and RC[7128 Å].
We found that the RC–GC, RC–BC, and GC–BC colours are redder than those of the Sun, with mean values of (14.8 ± 3.3), (13.2 ± 2.6), and (12.4 ± 7.5)%/1000 Å, respectively (see Fig. 4). This result agrees with previous apparitions, with values of Sv= 15%/1000 Å in 1985 (Schleicher et al.
1987) and Sv= 13%/1000 Å in 1998 (Lara et al. 2003). These values are consistent with the colour of the nucleus of 21P (12.8 ± 2.7)%/1000 Å measured at a heliocentric distance of 3.5 au in 1991 (Luu 1993). They fall within the range observed for most JFCs (Lamy & Toth 2009; Solontoi et al. 2012;
-40 -20 0 20 40 60 -80 -60 -40 -20 0 20 40 60 Sv (%/1000 A)
Time to perihelion (Day)
RC-BC RC-GC GC-BC
Fig. 4. Normalised reflectivity gradients Sv(% per 1000 Å) of comet 21P for different colour indices as a function of days to perihelion.
Jewitt 2015). During our long monitoring, we did not detect any significant variation in the colour of the dust in the coma (or any outburst).
4. Abundance ratios
The molecular abundances and their ratios with respect to the distance to the Sun give information about the homogeneity of a cometary nucleus and the chemical processes involved in the coma. Based on the relative abundance of 41 comets,A’Hearn et al. (1995) classified comets into two groups based on their C2-to-CN ratio. Typical comets are defined as those having a log[Q(C2)/Q(CN)] ≥ −0.18, while the carbon-chain-depleted comets are those below that value. This classification was con-firmed later by other photometric and spectroscopic studies of large data sets (Schleicher 2008;Fink 2009;Langland-Shula & Smith 2011;Cochran et al. 2012) and must reflect some differ-ences between the formation conditions (the pristine scenario) or a change of relative composition with time (several perihelion passages) of these comets (the evolutionary scenario). Figure5 shows the evolution of the 21P abundance ratios of the vari-ous radicals with respect to OH (a proxy of water) and CN as a function of heliocentric distance. It is clear that the 21P abun-dance ratios in the 2018 return agree with the mean values of depleted comets given in A’Hearn et al. (1995). Table 3 sum-marises the relative abundances in 2018 compared to 1985 and 1998 data using the same technique and the same Haser model parameters (Schleicher & Knight 2018). Our 2018 ratios are the mean values for all the data obtained (see TableA.2). Like for the activity level over the past passages, the relative abundances did not change over the last five orbits. We note that the A f ρ val-ues derived in 1985 and in 1998 bySchleicher & Knight(2018) were computed for the narrow-band GC[5260 Å] filter, while we used the BC[4450 Å] filter. After correcting their A f ρ values for the phase-angle effect using the same function as for the TRAP-PIST data (see Sect.2.1), the two data sets agree. This indicates that there is no evidence of changes in the chemical composition in the coma of the comet at different heliocentric distances (in the range 1.0 to 1.5 au) and over the five orbits, which is an argu-ment for rejecting the evolutionary origin of the carbon-chain depletion in this comet.
The bottom panel of Fig.5shows that there is no evidence either that the dust-to-gas ratio represented by A(0) f ρ/Q(CN)
Table 3. Relative molecular abundances of comet 21P over the last passages compared to the mean values for typical comets.
Log production rate ratio
1985(a) 1998(a) 2018(b) Typical comets(c)
C2/CN –0.64 –0.50 –0.52 ± 0.10 0.06 ± 0.10 C3/CN –1.42 –1.30 –1.39 ± 0.12 –1.09 ± 0.11 CN/OH –2.59 –2.67 –2.62 ± 0.08 –2.50 ± 0.18 C2/OH –3.23 –3.17 –3.16 ± 0.21 –2.44 ± 0.20 C3/OH –4.02 –3.98 –4.03 ± 0.16 –3.59 ± 0.29 NH/OH –2.66 –2.87 –2.68 ± 0.14 –2.37 ± 0.27 A(0) f ρ/CN –22.74 –22.73 –22.70 ± 0.04 –23.30 ± 0.32 A(0) f ρ/OH –25.33 –25.42 –25.32 ± 0.04 –25.82 ± 0.40
References.(a)Schleicher & Knight(2018),(b)this work,(c)A’Hearn et al. (1995).
and A(0) f ρ/Q(OH) depends on the heliocentric distance. We found that this ratio in 21P is consistent with the average value of depleted comets and higher than the mean value of the typical comets as defined in A’Hearn et al. (1995) (see Table 3). Lara et al. (2003) obtained a value of log[A(0) f ρ/ Q(CN)] = −22.91 ± 0.10 in 1998 that agrees with our measure-ment. Like for the gas relative abundances, we conclude that the coma of 21P does not show significant variation in the dust-to-gas ratio over the previous apparitions and that it has a similar ratio as the depleted comets defined byA’Hearn et al.(1995).
The comparison with abundances of parent molecules derived from IR data (Faggi et al. 2019; Roth et al. 2020) allows us to investigate the origin of the radicals observed in the atmosphere of 21P. Table4 shows the comparison between the production rates of daughter molecules observed in the optical and the possible parent molecules observed at IR. Using high-resolution infrared spectra obtained in 1998,Weaver et al.(1999) reported upper limits for different species relative to H2O such as C2H6(2–3%), HCN(0.3–0.4%), and C2H2(0.5–0.8%) assuming that all species are parent molecules. C2H2has been found to be depleted with respect to HCN by a factor five compared to other comets such as Hyakutake and Hale-Bopp. This result has been confirmed at this apparition byFaggi et al.(2019).
We derived a Q(C2) = 1.26 × 1025 mol s−1, which is con-sistent with the upper limit of Q(C2H2) < 4.52 × 1025 mol s−1 reported byFaggi et al.(2019) and <1.80 × 1025mol s−1reported by Roth et al.(2018) at 1.18 au from the Sun. This agreement indicates that C2might be a daughter species of C2H2. C2may also come from C2H6 and HC2N (Helbert et al. 2005; Weiler
2012; Hölscher 2015) or be released from organic-rich grains (Combi & Fink 1997), but a detailed chemical model of the coma is required for more details. We also found a good match between Q(CN) = 4.40 × 1025and Q(HCN) = 4.30 × 1025mol s−1 (Faggi et al. 2019) at 1.01 au, showing that HCN might be the main parent molecule of CN in 21P. This result is known for several comets using different methods, including a comparison between the HCN and CN production rates (Rauer et al. 2003; Opitom et al. 2015b), coma morphology (Woodney et al. 2002), and also carbon and nitrogen isotopic ratios in both species (Manfroid et al. 2009;Bockelée-Morvan et al. 2015). We note, however, that in some cases, the two abundances do not agree, and other sources, for instance extended sources, have been claimed for the CN origin (Fray et al. 2005).
Some molecules such as C4H2, CH2C2H2, and CH3C2H are proposed to be the parent molecules of C3(Helbert et al. 2005;
-3.5 -3 -2.5 -2 Typical Depleted Log Q(C 2 )/Q(OH) -1 -0.5 0 0.5 Log Q(C 2 )/Q(CN) -4.5 -4 -3.5 -3 -2.5 Log Q(C 3 )/Q(OH) -2 -1.5 -1 -0.5 0 Log Q(C 3 )/Q(CN) -3 -2.5 -2 -1.5 Log Q(NH)/Q(OH) -0.5 0 0.5 1 Log Q(NH)/Q(CN) -26 -25.5 -25 -1.3 -1.2 -1.1 1.01 1.1 1.2 1.3 Log A(0)f ρ /Q(OH)
Heliocentric distance (au)
-24 -23.5 -23 -22.5 -22 -1.3 -1.2 -1.1 1.011.01 1.1 1.2 1.3 Log A(0)f ρ /Q(CN)
Heliocentric distance (au)
Fig. 5.Evolution of the logarithmic production rates ratios of each species with respect to OH and to CN as a function of heliocentric distance. The dashed red line represents the mean value of typical comets as defined inA’Hearn et al.(1995), while the blue line represents the mean value of the depleted group. Bottom panels: dust-to-gas ratio represented by A(0) f ρ-to-OH and A(0) f ρ-to-CN. The vertical dashed line shows the perihelion distance on September 10, 2018, at rh= 1.01 au.
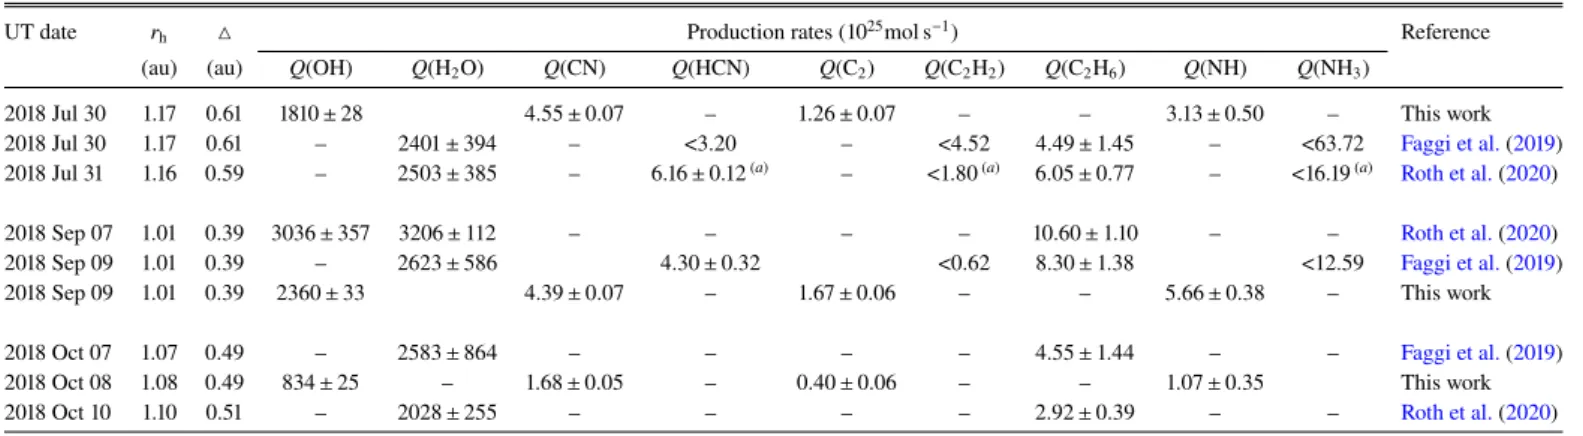
Table 4. Comparison of daughter molecules and possible parent molecule production rates derived from optical and infrared data of comet 21P in the 2018 passage.
UT date rh 4 Production rates (1025mol s−1) Reference
(au) (au) Q(OH) Q(H2O) Q(CN) Q(HCN) Q(C2) Q(C2H2) Q(C2H6) Q(NH) Q(NH3)
2018 Jul 30 1.17 0.61 1810 ± 28 4.55 ± 0.07 – 1.26 ± 0.07 – – 3.13 ± 0.50 – This work
2018 Jul 30 1.17 0.61 – 2401 ± 394 – <3.20 – <4.52 4.49 ± 1.45 – <63.72 Faggi et al.(2019) 2018 Jul 31 1.16 0.59 – 2503 ± 385 – 6.16 ± 0.12(a) – <1.80(a) 6.05 ± 0.77 – <16.19(a) Roth et al.(2020)
2018 Sep 07 1.01 0.39 3036 ± 357 3206 ± 112 – – – – 10.60 ± 1.10 – – Roth et al.(2020)
2018 Sep 09 1.01 0.39 – 2623 ± 586 4.30 ± 0.32 <0.62 8.30 ± 1.38 <12.59 Faggi et al.(2019)
2018 Sep 09 1.01 0.39 2360 ± 33 4.39 ± 0.07 – 1.67 ± 0.06 – – 5.66 ± 0.38 – This work
2018 Oct 07 1.07 0.49 – 2583 ± 864 – – – – 4.55 ± 1.44 – – Faggi et al.(2019)
2018 Oct 08 1.08 0.49 834 ± 25 – 1.68 ± 0.05 – 0.40 ± 0.06 – – 1.07 ± 0.35 This work
2018 Oct 10 1.10 0.51 – 2028 ± 255 – – – – 2.92 ± 0.39 – – Roth et al.(2020)
Notes.(a)FromRoth et al.(2018) measured on July 29, 2018. Upper limits are 3σ for the results ofRoth et al.(2020) andFaggi et al.(2019). species were not observed at infrared or at radio wavelengths.
NH and NH2 were found to be depleted in 21P in the previ-ous apparitions (A’Hearn et al. 1995;Fink 2009). New infrared observations in 2018 show very low NH3 in 21P, with an upper limit ratio of Q(NH3)/Q(H2O) < 0.6% (Faggi et al. 2019). In this work, we derive Q(NH)/Q(OH) = 0.2%, which is consistent with Q(NH3)/Q(H2O).
5. Optical high-resolution spectrum 5.1. Water-production rate
The UVES spectrum offered the possibility of independently computing the water-production rate at the time of observa-tion. We first measured the overall flux for the OH (0,0) band near 309 nm, integrated over the whole slit. We found
0
1
2
3
4
5
386.2
386.4
386.6
386.8
387
387.2
Relative intensity
Wavelength (nm)
CN Observed
CN Synthetic
13C
14N
12C
15N
Fig. 6.Observed and synthetic CN spectra of the R branch of the B-X (0, 0) violet band in comet 21P.
1.47 × 10⁻¹³ erg s−1 cm−2arcsec−2. The fluorescence efficiency computed for this band and the heliocentric distance and velocity at the time of observation was 2.62 × 10⁻⁴ s−1 (or 1.71 × 10⁻¹⁵ erg s−1 mol−1 when scaled to 1 au; see details on the fluorescence model in Rousselot et al. 2019). From these values and a Monte Carlo simulation of the water molecules cre-ating OH radicals in the inner coma (model based on equations given byCombi & Delsemme 1980) it is possible to compute the corresponding water-production rate for the number of OH radicals observed in the slit (0.44 × 9.5 arcsec) centred on the nucleus. Using the parameters of H2O radial velocity, OH and H2O lifetimes given inCochran & Schleicher(1993) and assum-ing that 91.8% of water molecules dissociate to OH (Crovisier 1989), we found Q(H2O) = 1.7 × 1028 mol s−1. This result is in excellent agreement with the water-production rates computed from TRAPPIST observations in the same period (see Fig.2). It must, nevertheless, be pointed out that it depends of the different parameters and can change slightly with them, especially with the water lifetime.
5.2. 12C/13C and14N/15N isotopic ratios
The study of the isotopic ratios in comets has attracted consid-erable attention as it contains information about the conditions that prevailed at the time of formation of these objects in the early Solar System (Jehin et al. 2009;Hyodo et al. 2013). The carbon 12C/13C ratio has been determined for several comets from the analysis of the C2 Swan band and CN B-X system in the optical (Manfroid et al. 2009; Bockelée-Morvan et al. 2015, and references therein). Some in situ measurements have also been obtained in comet 67P by the ROSINA mass spec-trometer on board the Rosetta spacecraft for C2H4, C2H5, CO (Rubin et al. 2017), and CO2molecules (Hässig et al. 2017). All derived values are compatible with the terrestrial ratio of 89, except for CO, which might be slightly enriched in 13C. The
nitrogen14N/15N isotopic ratio was measured for the first time from high-resolution spectra of the CN violet band in comets C/2000 WM1 (LINEAR) and C/1995 O1 (Hale-Bopp) and was found to be enriched by a factor of two in 15N with respect to the Earth value (Arpigny 2003). The same ratio was found later from sub-millimeter observations of HCN in comet 17P/Holmes during its outburst and archival data of C/1995 O1 (Hale-Bopp) (Bockelée-Morvan et al. 2008). It has also been possible recently to measure the14N/15N ratio in ammonia via the NH2 radical (Rousselot et al. 2014). The values obtained are similar to the value found in HCN and CN, which was confirmed by subse-quent works (Shinnaka et al. 2014,2016;Rousselot et al. 2015; Shinnaka & Kawakita 2016;Yang et al. 2018). Recent measure-ments performed by the ROSINA mass spectrometer in comet 67P provided a ratio 14N/15N = 118 ± 25 for NH
3 and 130 ± 30 for N2molecules (Altwegg et al. 2019).
We used the12C14N B-X (0,0) band to estimate the12C/13C and14N/15N isotopic ratios of 21P. We used a CN fluorescence model to create synthetic spectra of13C14N,12C15N, and12C14N. More details of the model are given inManfroid et al.(2009). Figure 6 shows the observed CN spectrum compared to the synthetic spectrum made under the same observational condi-tions. The ratios found for12C/13C and14N/15N are 100 ± 10 and 145 ± 10, respectively. These values are consistent with those of about 20 comets with different dynamical origins, 91.0 ± 3.6 and 147.8 ± 5.7 for12C/13C and14N/15N, respectively (Manfroid et al.
2009;Bockelée-Morvan et al. 2015). 5.3. NH2and NH3ortho-to-para ratios
We measured the ortho-to-para abundance ratio (OPR) of NH2 from the three rovibronic emissions bands (0,7,0), (0,8,0), and (0,9,0), see Fig.7, following the method described inShinnaka et al. (2011). The derived OPRs of NH2 and of its parent molecule NH3are listed for each band in Table5, and they have
0 5 10 15 20 596 598 600 602 604 606 608 610 612 614 Observed spectrum NH2 (OPR = 3.15) C2 (Trot= 4000 K) ortho para Relative flux Wavelength (nm) NH2 (0,9,0) band on 2018 Sep. 18 0 5 10 15 20 596 598 600 602 604 606 608 610 612 614 0 5 10 15 20 628 630 632 634 636 Observed spectrum NH2 (OPR = 3.55) ortho para Relative flux Wavelength (nm) NH2 (0,8,0) band on 2018 Sep. 18 0 5 10 15 20 628 630 632 634 636 0 5 10 15 20 660 662 664 666 668 670 672 Observed spectrum NH2 (OPR = 3.30) ortho para Relative flux Wavelength (nm) NH2 (0,7,0) band on 2018 Sep. 18 0 5 10 15 20 660 662 664 666 668 670 672
Fig. 7.Comparison between the observed and modelled spectra of the NH2(0,9,0), (0,8,0), and (0,7,0) bands. The modelled spectrum of C2is also plotted in the NH2(0,9,0) band panel, but because of the depleted nature of 21P, the C2lines do not affect the NH2spectrum. The ortho-and para-lines of NH2 are labelled in these modelled spectra. The two strong emission lines at 6300 and 6364 Å are the forbidden oxygen lines in the NH2 (0,8,0) band panel. We note that the intensity ratio among bands is not correct because we scaled intensity for each plot independently.
average values of 3.38 ± 0.06 and 1.19 ± 0.03, respectively. The latter is in very good agreement with the Subaru/HDS determi-nation (NH3OPR = 1.16 ± 0.02;Shinnaka et al. 2020). A nuclear spin temperature (Tspin) for ammonia of 27 ± 1 K was derived. The 21P value is consistent with typical values measured in comets (see Fig.8). 21P therefore cannot be distinguished from other comets based on its NH2OPR (see Fig.9), which is a pos-sible cosmogonic indicator linked to the formation temperature of the molecule.
We would like to point out that recent laboratory experiments demonstrate that the OPR of water does not retain the memory of its formation temperature (Hama et al. 2011,2016; Hama & Watanabe 2013). It is likely that this is also the case for ammonia.
Table 5. Derived NH2and NH3OPRs in comet 21P.
NH2band NH2OPR NH3OPR Tspin(K)
(0,7,0) 3.30 ± 0.13 1.15 ± 0.07 28+5/ −3 (0,8,0) 3.55 ± 0.08 1.28 ± 0.04 23+2/ −1 (0,9,0) 3.15 ± 0.10 1.08 ± 0.05 34+8/ −4 Average 3.38 ± 0.06 1.19 ± 0.03 27 ± 1 0.9 1 1.1 1.2 1.3 1.4 5 10 15 20 25 Jupiter Family comets
Oort Cloud comets
ortho/para statistical weight value of NH3 of 1.0
NH 3 OPR Comet Number 1. 9P/Tempel 1 2. 21P/G-Z 3. 66P/de Toit 4. 73P-B/SW3 5. 73P-C/SW3 6. 81P/Wild 2 7. 88P/Howell 8. 103P/Hartley 2 9. 8P/Tuttle 10. 153P/H-Z 11. C/1995 O1 12. C/1999 S4 13. C/2000 WM1 14. C/2001 A2 15. C/2001 Q4 16. C/2002 T7 17. C/2002 V1 18. C/2002 X5 19. C/2002 Y1 20. C/2003 K4 21. C/2009 K5 22. C/2009 P1 23. C/2012 S1 24. C/2012 X1 25. C/2013 R1 26. C/2013 US10 27. C/2014 E2 28. C/2014 Q2
Fig. 8.Summary of NH3OPRs in comets. The orange and green crosses are the NH3OPR of 21P by VLT/UVES (this work) and by Subaru/HDS (Shinnaka et al. 2020), respectively.
1 1.1 1.2 1.3 1.4 20 25 30 35 40 45 50 NH 3 OPR NH3 Tspin (K) 9P/Tempel 1 21P/G-Z 66P/de Toit 73P-B/SW3 73P-C/SW3 81P/Wild 2 88P/Howell 103P/Hartley 2 8P/Tuttle 153P/H-Z C/1995 O1 C/1999 S4 C/2000 WM1 C/2001 A2 C/2001 Q4 C/2002 T7 C/2002 V1 C/2002 X5 C/2002 Y1 C/2003 K4 C/2009 K5 C/2009 P1 C/2012 S1 C/2012 X1 C/2013 R1 C/2013 US10 C/2014 E2 C/2014 Q2 1 1.1 1.2 1.3 1.4 20 25 30 35 40 45 50
Fig. 9.Summary of the NH3Tspinin 28 comets of various origins. The orange and green crosses are the NH3Tspinof 21P by VLT/UVES (this work) and by Subaru/HDS (Shinnaka et al. 2020), respectively.
The OPRs of cometary volatiles might have been modified by an ortho-to-para conversion process in the inner coma or other catalyst activities of dust crust surfaces of the nucleus rather than be reflected by a formation temperature in the solar nebula 4.6 Gyr ago. OPRs might be a diagnostic of the physico-chemical conditions in the innermost coma or beneath the surface. 6. Dynamical evolution
In this section we analyse the dynamical evolution of the comet within the last 105 yr. JFCs are highly chaotic objects, whose
0 10 20 30 40 Closest encounters wi th Ju pit er (% ) 3.0 3.5 4.0 4.5 5.0
Semimajor axis (au)
0.4 0.6 0.8 Eccentricity 0 10 20 30 40 50 Inclination (deg) 0 1 2 3 Perihelion (au) 3000 2500 2000 1500 1000 500 0
Time From January 1
st, 2020 (yr)
4 5 6 7 8 9 Aphelion (au)
Fig. 10.Orbital evolution of 21P and its 200 clones for 3000 yr back-ward in time from January 1, 2020. From top to the bottom: closest approaches with Jupiter, semi-major axis, eccentricity, inclination, per-ihelion, and aphelion distance. In all panels, the grey lines correspond to the evolution of each clone, the black line is the mean value of the clones, and the red line is that of the nominal comet 21P. The vertical blue line corresponds to the time of the closest encounter with Jupiter. The initial orbital elements were taken from the JPL Small-Body Data Browser (orbital solution JPL K182/3).
dynamic evolution must be studied in terms of statistics (Levison & Duncan 1994). With this in mind, we analysed the evolution of the original object, that is, comet 21P, by considering the nominal values of its orbital parameters as they are defined in JPL-HORIZONS (orbital solution JPL K182/3). In the analysis, 200 clones were generated following the covariance matrix of its orbital parameters5. We performed the integration with the numerical package MERCURY (Chambers 1999), using the inte-gration algorithm of Bulirsch-Stoer (Bulirsch & Stoer 1964) with a time step of 8 d, and we included the Sun, all planets, and Pluto in the simulation. In addition, we also included non-gravitational forces. The results of the simulations are displayed in Fig.10.
We find that the orbits of all the clones in the simulation were very compact for a period of ∼1650 yr. After that period, the orbits started to scatter, which was provoked by a close encounter with Jupiter, at a mean distance of 0.1 au. Because the nature of 5 Both sets of the orbital parameters and the covariance matrix of the orbit for 21P are published together in the NASA/JPL small-body browser:https://ssd.jpl.nasa.gov/sbdb.cgi?sstr=21P;old= 0;orb=0;cov=1;log=0;cad=0#elem -1.5 -1 -0.5 0 0.5 1 -2 -1 0 1 2 3 21P JFCs Oort Cloud comets
Typical Carbon-chain depleted Log[Q(C 2 )/Q(CN)] Tj Schleicher 2008 TRAPPIST data
Fig. 11.Logarithm of C2-to-CN ratio of 110 comets as a function of the Tisserand invariant parameter with respect to Jupiter (TJ). Filled symbols present typical comets, while the open symbols present the carbon-chain-depleted comets. Our measurement of comet 21P is rep-resented by a blue diamond. The vertical dashed line at Tj= 2 separates the families of JFCs and Oort cloud comets.
JFCs is chaotic, a comparison of results from different authors who applied different methods (e.g. different integration algo-rithm, different number of clones, or different manner in which their clones were generated) is difficult to perform, and any superficial comparison might yield incorrect conclusions. Only one analysis identical to that performed here has been carried out for comet 66P/du Toit by Yang et al. (2019). The authors found that the comet belongs to the Jupiter family for at least ∼60 × 103yr, and the stable nature of its orbit was evident. This result indicates that 21P likely is a young member of the Jupiter family that has crossed its perihelion ∼230 times with similar distances of q ∼ 1.013 au. The youth of 21P could explain its unusual composition. However, the lack of a statistic sample prevents us from robustly confirming this hypothesis.
7. Discussion
As mentioned above, C2and C3have been found to be depleted compared to CN in 21P more than 50 yr ago (Mianes et al. 1960; Herbig 1976;Schleicher et al. 1987). In the data set ofA’Hearn et al.(1995), 21P was classified as the prototype of the group that is depleted in carbon-chain molecules. Figure11shows our C2 -to-CN ratio compared to 120 comets (90 comets fromSchleicher 2008and 30 comets from TRAPPIST databaseOpitom 2016) as a function of the Tisserand invariant parameter with respect to Jupiter (TJ). About 30% of the comets analysed were found to be depleted in carbon-chain elements by varying amounts, includ-ing different dynamical types of comets, two-thirds are JFCs, and one-third are LPCs (A’Hearn et al. 1995;Schleicher 2008;Fink 2009;Cochran et al. 2012). 21P was found to be also depleted in NH with respect to OH (A’Hearn et al. 1995). This result was confirmed by its depletion in NH2using spectro-photometric observations byKonno & Wyckoff(1989) in the 1985 apparition and later byFink & Hicks(1996) in the 1998 passage. This deple-tion in both NH and NH2 indicates that 21P is likely depleted in the parent molecule NH3, which was recently confirmed by
Faggi et al.(2019). 21P is not a unique case of a comet depleted in both carbon-chain and ammonia daughter species. A few oth-ers have been found, but with a lesser degree of depletion, such
as 43P/Wolf-Harrington and the split comet 73P/Schwassmann-Wachmann 3 (A’Hearn et al. 1995; Fink 2009; Cochran et al. 2012). This indicates that there might be a small group of simi-lar comets that formed under simisimi-lar conditions and is different from other comets. According to taxonomy studies, however, no clear grouping associated with an abundance in NH has been identified.
Our long monitoring of the abundance ratios combined with previous studies (Schleicher & Knight 2018;Combi et al. 2011) rules out the evolutionary scenario (peculiar composition due to repeated passages to perihelion). Our observations show remarkably constant abundance ratios of the different species, especially the depleted C2and NH, before and after perihelion, and over months. The fact that these ratios are still the same after five orbits is in favour of a pristine composition rather than compositional changes due to repeated passages of the comet at perihelion.
It was argued that this peculiar composition might be linked to a higher formation temperature, closer to that of the Sun (Schleicher et al. 1987), or in a local disc around Jupiter, as was proposed for comet 73P (Shinnaka et al. 2011). We obtained high-resolution optical spectra with high S/N in order to investi-gate the C and the N isotopic ratios, as well as the NH2OPR. 21P appears to have a normal14N/15N ratio and a normal NH
3OPR,
similar to other comets. This is in contrast with comet 73P, which has both peculiar 14N/15N and OPR (see Fig. 9 andShinnaka
et al. 2011). The two comets therefore are apparently not related, and the peculiar composition of 21P still needs to be explained. These peculiarities are clearly linked to the ice composition of the nucleus because the IR studies of the mother molecules also show the same kind of depletion, with an obvious link to the daughter species.
8. Summary and conclusion
We performed an extensive monitoring of comet 21P on either side of perihelion with TRAPPIST. The gas species production rates as well as the dust proxy, A(0) f ρ parameter, were com-puted until the detection limit. We derived the water-production rates for this apparition, and we compared it, as well as the various abundance ratios, to previous passages. Using a subli-mation model for the nucleus and the water-production rates, we constrained the active area of the nucleus surface using the slow-rotator approach. An accurate determination of the 21P nucleus parameters is needed to better constrain the active area frac-tion. Comet 21P shows an asymmetric activity with respect to perihelion, which might be due to the nucleus shape, the spin axis orientation, and the distribution of activity on the cometary surface. The maximum of the gas and dust activity was about 24 days before perihelion, similar to the previous apparitions. According to the molecular abundance relative to CN and OH, we confirm that 21P is depleted in C2, C3, and NH with respect to CN and to OH. A very good agreement between the abundance of the potential mother molecules measured in the IR (HCN, C2H2, and NH3) and the daughter species from our optical obser-vations has been found. We obtained a high-resolution UVES spectrum of 21P a week after perihelion, and we derived12C/13C and14N/15N isotopic ratios of 100 ± 10 and 145 ± 10 from the CN R-branch of the B-X (0, 0) violet band. The ammonia OPR was found to be equal to 1.19 ± 0.03, corresponding to a spin temper-ature of 27 ± 1 K. All these values agree with those found for several comets of different dynamical types and origins and do not show any peculiarity that could be related to the low-carbon-chain species and ammonia abundances. Our observations favour
a pristine origin for this composition, rather than heterogeneity or evolutionary scenarios of the surface composition.
Acknowledgments. The research leading to these results has received funding from the ARC grant for Concerted Research Actions, financed by the Wallonia-Brussels Federation. TRAPPIST-South is a project funded by the Belgian Fonds (National) de la Recherche Scientifique (F.R.S.-FNRS) under grant FRFC 2.5.594.09.F. TRAPPIST-North is a project funded by the University of Liège, and performed in collaboration with Cadi Ayyad University of Marrakesh. E.J. and D.H. are FNRS Senior Research Associates. J.M. is Honorary Research Director of the FNRS. We thank NASA, David Schleicher and the Lowell Obser-vatory for the loan of a set of HB comet filters. UVES observations made with ESO Telescopes at the La Silla Paranal Observatory under program DDT proposal 2101.C-5051.
References
A’Hearn, M. F., Schleicher, D. G., Millis, R. L., Feldman, P. D., & Thompson, D. T. 1984,AJ, 89, 579
A’Hearn, M. F., Campins, H., Schleicher, D. G., & Millis, R. L. 1989,ApJ, 347, 1155
A’Hearn, M. F., Millis, R. C., Schleicher, D. O., Osip, D. J., & Birch, P. V. 1995, Icarus, 118, 223
Altwegg, K., Balsiger, H., & Fuselier, S. A. 2019,ARA&A, 57, 113 Arpigny, C. 2003,Science, 301, 1522
Beaver, J. E., Wagner, R. M., Schleicher, D. G., & Lutz, B. L. 1990,ApJ, 360, 696
Beech, M. 1986,AJ, 91, 159 Bessell, M. S. 1990,PASP, 102, 1181
Bockelée-Morvan, D., Biver, N., Jehin, E., et al. 2008,ApJ, 679, L49
Bockelée-Morvan, D., Calmonte, U., Charnley, S., et al. 2015,Space Sci. Rev., 197, 47
Bodewits, D., Farnham, T. L., A’Hearn, M. F., et al. 2014,ApJ, 786, 48 Bulirsch, R., & Stoer, J. 1964,Numer. Math., 6, 413
Chambers, J. E. 1999,MNRAS, 304, 793 Cochran, A. L., & Barker, E. S. 1987,AJ, 93, 239 Cochran, A. L., & Schleicher, D. G. 1993,Icarus, 105, 235 Cochran, A., Barker, E., & Gray, C. 2012,Icarus, 218, 144 Combi, M. R., & Delsemme, A. H. 1980,ApJ, 237, 633 Combi, M. R., & Feldman, P. D. 1992,Icarus, 97, 260 Combi, M. R., & Fink, U. 1997,ApJ, 484, 879
Combi, M. R., Stewart, A. I. F., & Smyth, W. H. 1986,Geophys. Res. Lett., 13, 385
Combi, M. R., Bertaux, J.-L., Quémerais, E., Ferron, S., & Mäkinen, J. T. T. 2011,ApJ, 734, L6
Combi, M. R., Mäkinen, T. T., Bertaux, J. L., Quémerais, E., & Ferron, S. 2019, Icarus, 317, 610
Cowan, J. J., & A’Hearn, M. F. 1979,Moon Planets, 21, 155 Crovisier, J. 1989,A&A, 213, 459
DiSanti, M. A., Bonev, B. P., Villanueva, G. L., & Mumma, M. J. 2012,ApJ, 763, 1
Egal, A., Wiegert, P., Brown, P. G., et al. 2019,Icarus, 330, 123 Ehlert, S., Moticska, N., & Egal, A. 2019,AJ, 158, 7
Faggi, S., Mumma, M. J., Villanueva, G. L., Paganini, L., & Lippi, M. 2019,AJ, 158, 254
Farnham, T., & Schleicher, D. 2005,Icarus, 173, 533
Farnham, T. L., Schleicher, D. G., & A’Hearn, M. F. 2000,Icarus, 147, 180 Fink, U. 2009,Icarus, 201, 311
Fink, U., & Hicks, M. D. 1996,ApJ, 459, 729
Fray, N., Bénilan, Y., Cottin, H., Gazeau, M.-C., & Crovisier, J. 2005,Planet. Space Sci., 53, 1243
Gulkis, S., Allen, M., von Allmen, P., et al. 2015,Science, 347, aaa0709 Hama, T., & Watanabe, N. 2013,Chem. Rev., 113, 8783
Hama, T., Watanabe, N., Kouchi, A., & Yokoyama, M. 2011, ApJ, 738, L15
Hama, T., Kouchi, A., & Watanabe, N. 2016,Science, 351, 65 Hanner, M., Veeder, G., & Tokunaga, A. 1992,AJ, 104, 386 Haser, L. 1957,Bull. Soc. R. Sci. Liege, 43, 740
Hässig, M., Altwegg, K., Balsiger, H., et al. 2017,A&A, 605, A50
Helbert, J., Rauer, H., Boice, D. C., & Huebner, W. F. 2005, A&A, 442, 1107
Herbig, G. H. 1976,Rev. of cometary spectra, 393, 136 Hölscher, A. 2015, PhD thesis, Technische Universität, Berlin
Hyodo, F., Kusaka, S., Wardle, D. A., & Nilsson, M.-C. 2013,Plant Soil, 364, 315
Jehin, E., Manfroid, J., Hutsemékers, D., Arpigny, C., & Zucconi, J.-M. 2009, Earth Moon Planets, 105, 167
Jehin, E., Gillon, M., Queloz, D., et al. 2011,The Messenger, 145, 2 Jewitt, D. 2015,AJ, 150, 201
Jewitt, D., & Meech, K. J. 1986,ApJ, 310, 937
Kiselev, N. N., Jockers, K., Rosenbush, V. K., et al. 2000,Planet. Space Sci., 48, 1005
Konno, I., & Wyckoff, S. 1989,Adv. Space Res., 9, 163
Królikowska, M., Sitarski, G., & Szutowicz, S. 2001,A&A, 368, 676 Lai, I.-L., Ip, W.-H., Lee, J.-C., et al. 2019,A&A, 630, A17 Lamy, P., & Toth, I. 2009,Icarus, 201, 674
Langland-Shula, L. E., & Smith, G. H. 2011,Icarus, 213, 280 Lara, L.-M., Licandro, J., Oscoz, A., & Motta, V. 2003,A&A, 399, 763 Leibowitz, E. M., & Brosch, N. 1986,Icarus, 68, 430
Levison, H. F., & Duncan, M. J. 1994,Icarus, 108, 18
Lis, D. C., Bockelée-Morvan, D., Güsten, R., et al. 2019,A&A, 625, L5 Luu, J. X. 1993,Icarus, 104, 138
Manfroid, J., Jehin, E., Hutsemékers, D., et al. 2009,A&A, 503, 613
Marshall, D., Rezac, L., Hartogh, P., Zhao, Y., & Attree, N. 2019,A&A, 623, A120
McFadden, L. A., A’Hearn, M. F., Feldman, P. D., et al. 1987,Icarus, 69, 329 McKay, A. J., Cochran, A. L., DiSanti, M. A., et al. 2018,Icarus, 309, 1 McKay, A. J., DiSanti, M. A., Kelley, M. S. P., et al. 2019,AJ, 158, 128 Mianes, P., Grudzinska, S., & Stawikowski, A. 1960,Ann. Astrophys., 23, 788 Moreno, F., Pozuelos, F., Aceituno, F., et al. 2012,ApJ, 752, 136
Moreno, F., Licandro, J., Cabrera-Lavers, A., & Pozuelos, F. J. 2016a,ApJ, 826, 137
Moreno, F., Licandro, J., Cabrera-Lavers, A., & Pozuelos, F. J. 2016b,ApJ, 826, L22
Moreno, F., Pozuelos, F. J., Novakovi´c, B., et al. 2017,ApJ, 837, L3 Moulane, Y., Jehin, E., Opitom, C., et al. 2018,A&A, 619, A156 Mumma, M. J., & Charnley, S. B. 2011,ARA&A, 49, 471
Mumma, M. J., DiSanti, M. A., Russo, N. D., Magee-Sauer, K., & Rettig, T. W. 2000,ApJ, 531, L155
Opitom, C. 2016, Monitoring of the chemical composition of comets in the framework of the TRAPPIST survey, PhD thesis, Université de Liège, Liège, Belgium
Opitom, C., Jehin, E., Manfroid, J., et al. 2015a,A&A, 574, A38 Opitom, C., Jehin, E., Manfroid, J., et al. 2015b,A&A, 584, A121
Opitom, C., Snodgrass, C., Fitzsimmons, A., et al. 2017,MNRAS, 469, S222 Pittichová, J., Woodward, C. E., Kelley, M. S., & Reach, W. T. 2008,AJ, 136,
1127
Pozuelos, F. J., Cabrera-Lavers, A., Licandro, J., & Moreno, F. 2015,ApJ, 806, 102
Pozuelos, F. J., Jehin, E., Moulane, Y., et al. 2018,A&A, 615, A154 Rauer, H., Helbert, J., Arpigny, C., et al. 2003,A&A, 397, 1109
Roth, N., Gibb, E., Dello Russo, N., et al. 2018,AAS/Division for Planetary Sciences Meeting Abstracts, 50, 210.11
Roth, N. X., Gibb, E. L., Bonev, B. P., et al. 2020,AJ, 159, 42 Rousselot, P., Pirali, O., Jehin, E., et al. 2014,ApJ, 780, L17 Rousselot, P., Decock, A., Korsun, P. P., et al. 2015,A&A, 580, A3 Rousselot, P., Opitom, C., Jehin, E., et al. 2019,A&A, 628, A22 Rubin, M., Altwegg, K., Balsiger, H., et al. 2017,A&A, 601, A123 Scarf, F. L., Coroniti, F. V., Kennel, C. F., et al. 1986,Science, 232, 377 Schleicher, D. G. 2006,Icarus, 181, 442
Schleicher, D. 2007,Icarus, 190, 406 Schleicher, D. G. 2008,AJ, 136, 2204
Schleicher, D., & Knight, M. 2018, AAS/Division for Planetary Sciences Meeting Abstracts, 210.12
Schleicher, D. G., Millis, R. L., & Birch, P. V. 1987,A&A, 187, 531 Schleicher, D. G., Millis, R. L., & Birch, P. V. 1998,Icarus, 132, 397 Shinnaka, Y., & Kawakita, H. 2016,AJ, 152, 145
Shinnaka, Y., Kawakita, H., Kobayashi, H., et al. 2011,ApJ, 729, 81
Shinnaka, Y., Kawakita, H., Kobayashi, H., Nagashima, M., & Boice, D. C. 2014, ApJ, 782, L16
Shinnaka, Y., Kawakita, H., Jehin, E., et al. 2016,MNRAS, 462, S195 Shinnaka, Y., Kawakita, H., & Tajitsu, A. 2020,AJ, 159, 203 Solontoi, M., Ivezi´c, Ž., Juri´c, M., et al. 2012,Icarus, 218, 571
Tancredi, G., Fernández, J. A., Rickman, H., & Licandro, J. 2000,A&AS, 146, 73
Von Rosenvinge, T. T., Brandt, J. C., & Farquhar, R. W. 1986,Science, 232, 353 Weaver, H., Chin, G., Bockelee-Morvan, D., et al. 1999,Icarus, 142, 482 Weiler, M. 2012,A&A, 538, A149
Woodney, L., AHearn, M., Schleicher, D. G., et al. 2002,Icarus, 157, 193 Yang, B., Hutsemékers, D., Shinnaka, Y., et al. 2018,A&A, 609, L4 Yang, B., Jehin, E., Pozuelos, F. J., et al. 2019,A&A, 631, A168
Appendix A: Observational circumstances and production rates of comet 21P with TRAPPIST telescopes
Table A.1. Observational circumstances of comet 21P with TRAPPIST telescopes.
UT date rh ∆ ∆T PA Gas filters Dust filters Telescope
(au) (au) (Days) (◦) OH NH CN C2 C3 BC RC GC Rc Ic TN/TS
2018 Jun. 09 1.61 1.07 –93.20 38.01 6 1 TN 2018 Jun. 19 1.52 0.94 –83.25 40.98 1 1 1 1 1 1 1 1 TN 2018 Jun. 22 1.49 0.90 –80.16 41.98 1 1 1 1 1 1 1 5 1 TN 2018 Jun. 28 1.44 0.88 –74.20 44.13 1 1 2 1 1 1 1 6 2 TN 2018 Jul. 09 1.34 0.78 –63.30 48.62 2 1 1 3 1 TN 2018 Jul. 26 1.21 0.65 –46.25 56.96 1 1 2 1 1 1 1 3 1 TN 2018 Jul. 30 1.18 0.62 –42.25 59.13 1 2 2 4 TN 2018 Aug. 17 1.07 0.48 –24.25 69.44 1 1 2 1 1 1 1 6 1 TN 2018 Aug. 18 1.07 0.49 –23.08 69.99 1 1 1 1 5 1 TN 2018 Aug. 23 1.04 0.45 –18.13 72.65 1 1 1 1 1 1 1 5 1 TN 2018 Aug. 29 1.03 0.42 –12.11 75.38 1 1 1 1 1 1 1 5 1 TN 2018 Sep. 05 1.01 0.39 –05.10 77.67 1 3 1 1 1 5 1 TN 2018 Sep. 09 1.01 0.39 –01.10 78.01 1 1 2 1 1 1 1 1 8 4 TN 2018 Sep. 15 1.01 0.39 +05.09 77.40 2 1 1 1 1 1 1 5 1 TS 2018 Sep. 17 1.01 0.40 +06.90 76.83 1 1 3 1 1 1 1 1 11 2 TN 2018 Sep. 17 1.01 0.40 +06.90 76.83 1 1 1 1 1 1 1 1 5 3 TS 2018 Sep. 18 1.01 0.40 +08.13 76.53 1 1 1 1 1 1 5 3 TS 2018 Sep. 20 1.02 0.40 +10.12 75.84 1 1 1 1 1 1 1 1 5 3 TS 2018 Sep. 21 1.02 0.41 +11.12 75.45 1 1 1 1 1 3 1 TN 2018 Sep. 21 1.02 0.41 +11.12 75.45 1 1 1 1 1 1 1 1 5 3 TS 2018 Sep. 22 1.02 0.41 +12.12 75.04 1 1 1 1 1 1 1 1 5 3 TS 2018 Sep. 23 1.02 0.41 +12.95 74.61 3 1 TN 2018 Sep. 25 1.03 0.42 +15.10 73.63 1 1 2 2 1 1 1 1 5 3 TS 2018 Sep. 29 1.04 0.44 +18.90 71.61 2 2 2 2 2 2 2 6 2 TN 2018 Oct. 01 1.05 0.45 +21.10 70.49 2 1 2 2 1 1 1 1 5 3 TS 2018 Oct. 02 1.06 0.46 +22.10 69.92 1 1 1 1 1 1 TS 2018 Oct. 04 1.07 0.47 +23.90 68.69 1 1 2 2 2 2 2 6 2 TN 2018 Oct. 07 1.08 0.49 +27.13 66.92 1 1 1 TS 2018 Oct. 08 1.08 0.49 +27.90 66.37 1 1 1 1 1 1 1 11 1 TN 2018 Oct. 12 1.10 0.51 +31.90 64.55 1 1 1 2 1 1 2 10 2 TN 2018 Oct. 14 1.12 0.53 +34.10 62.73 1 1 1 1 1 1 1 1 5 1 TS 2018 Oct. 15 1.12 0.54 +35.10 62.12 1 1 1 5 TS 2018 Oct. 18 1.14 0.56 +38.11 60.33 1 1 1 1 1 1 1 3 2 TS 2018 Oct. 18 1.14 0.56 +37.90 60.33 1 1 1 TN 2018 Oct. 21 1.16 0.58 +40.95 58.55 1 1 3 TN 2018 Oct. 22 1.17 0.59 +42.06 57.97 1 1 1 1 1 1 1 5 2 TS 2018 Oct. 25 1.19 0.61 +45.10 56.25 1 1 TS 2018 Oct. 28 1.21 0.63 +48.09 54.55 1 1 1 1 1 1 1 TS 2018 Nov. 01 1.24 0.66 +52.04 52.37 1 1 1 1 1 1 1 1 4 1 TS 2018 Nov. 05 1.27 0.68 +56.05 50.80 1 1 1 1 1 1 4 1 TS 2018 Nov. 09 1.31 0.71 +59.98 48.27 1 1 1 1 1 1 4 1 TS 2018 Nov. 14 1.35 0.74 +65.10 45.84 1 1 1 1 1 1 5 1 TS 2018 Nov. 30 1.49 0.85 +81.08 38.84 1 1 1 1 3 1 TS 2018 Dec. 07 1.55 0.90 +88.12 36.12 1 1 3 1 TS 2018 Dec. 10 1.58 0.92 +91.10 35.01 1 1 3 1 TS 2018 Dec. 19 1.66 0.98 +100.05 32.04 1 1 1 4 1 TS 2018 Dec. 29 1.75 1.06 +110.12 29.28 1 1 1 TS 2019 Jan. 14 1.90 1.20 +126.13 26.20 2 TS 2019 Jan. 15 1.91 1.21 +127.10 26.08 3 1 TS 2019 Jan. 29 2.04 1.37 +141.12 24.74 4 1 TS 2019 Feb. 02 2.08 1.42 +145.08 24.52 4 1 TS 2019 Feb. 04 2.10 1.44 +147.11 24.43 4 4 TS
Notes. rhand 4 are the heliocentric and geocentric distances, ∆T is the time to perihelion in days, (−) for pre-perihelion and (+) for post-perihelion. PA is the solar phase angle.
Table A.2. OH, NH, CN, C2, and C3production rates and A(θ = 0) f ρ measurements for comet 21P with the TN and TS telescopes.
UT date rh Production rates ( × 1024mol s−1) A(θ = 0) f ρ TN/TS
(au) OH NH CN C2 C3 BC RC GC Rc Ic 2018 Jun. 09 1.61 – – – – – – – – 236.5 ± 14.0 265.5 ± 18.7 TN 2018 Jun. 19 1.52 – – 25.20 ± 0.52 4.30 ± 0.65 – 234.8 ± 13.6 351.1 ± 17.5 – – 326.9 ± 15.6 TN 2018 Jun. 22 1.49 6200 ± 253 – 28.00 ± 0.53 – 1.50 ± 0.20 – – – 333.6 ± 16.8 367.5 ± 18.4 TN 2018 Jun. 28 1.44 9560 ± 365 – 32.00 ± 0.64 – – – 673.7 ± 21.4 – 411.0 ± 13.7 475.7 ± 12.9 TN 2018 Jul. 26 1.21 15 200 ± 322 31.30 ± 4.90 37.80 ± 0.54 8.40 ± 0.66 1.08 ± 0.20 618.6 ± 36.4 801.5 ± 12.9 – 687.8 ± 11.5 758.2 ± 15.9 TN 2018 Jul. 30 1.18 18 100 ± 278 – 45.50 ± 0.63 12.60 ± 0.65 – – – – 959.8 ± 15.8 – TN 2018 Aug. 17 1.07 28 300 ± 558 54.10 ± 4.59 52.00 ± 0.65 17.90 ± 0.64 2.52 ± 0.19 1087.6 ± 13.7 1646.1 ± 12.7 – 1502.7 ± 12.1 1609.3 ± 12.7 TN 2018 Aug. 18 1.07 25 600 ± 276 – 50.80 ± 0.64 18.00 ± 0.62 2.47 ± 0.17 – – – 1522.1 ± 11.6 1648.9 ± 10.3 TN 2018 Aug. 23 1.04 27 300 ± 304 50.20 ± 3.60 55.20 ± 0.67 19.20 ± 0.64 2.55 ± 0.17 1028.9 ± 12.5 1570.7 ± 11.8 – 1463.7 ± 11.7 1570.2 ± 10.0 TN 2018 Aug. 29 1.03 23 000 ± 286 43.50 ± 4.07 42.50 ± 0.62 13.70 ± 0.62 1.66 ± 0.18 887.6 ± 29.6 1229.9 ± 12.5 – 1100.0 ± 12.7 1176.3 ± 16.1 TN 2018 Sep. 05 1.01 20 800 ± 312 – 38.20 ± 0.64 14.00 ± 0.63 1.95 ± 0.17 651.2 ± 12.4 – – 933.1 ± 10.5 984.0 ± 14.8 TN 2018 Sep. 09 1.01 23 600 ± 328 56.60 ± 3.86 43.90 ± 0.68 16.70 ± 0.64 2.26 ± 0.17 723.3 ± 12.4 1103.1 ± 15.7 815.5 ± 12.4 1062.9 ± 12.7 1123.3 ± 12.1 TN 2018 Sep. 17 1.01 17 100 ± 300 39.80 ± 3.77 37.10 ± 0.66 11.60 ± 0.64 1.91 ± 0.18 574.6 ± 14.1 861.6 ± 12.4 642.0 ± 10.7 799.0 ± 15.1 833.7 ± 14.0 TN 2018 Sep. 17 1.01 14 700 ± 326 38.30 ± 3.84 37.60 ± 0.53 12.30 ± 0.63 2.02 ± 0.22 571.6 ± 19.6 851.4 ± 17.2 599.9 ± 19.2 767.0 ± 16.2 832.1 ± 14.8 TS 2018 Sep. 18 1.01 – – 30.00 ± 0.52 11.00 ± 0.65 2.07 ± 0.28 459.5 ± 34.2 872.2 ± 22.2 595.9 ± 14.8 733.3 ± 14.8 849.6 ± 20.4 TS 2018 Sep. 21 1.02 – – – – – – – – 604.7 ± 16.6 652.2 ± 14.9 TN 2018 Sep. 21 1.02 1280 ± 212 28.50 ± 3.79 33.00 ± 0.52 10.90 ± 0.63 1.72 ± 0.22 542.3 ± 17.4 808.3 ± 12.5 606.4 ± 19.9 658.3 ± 14.9 779.5 ± 21.4 TS 2018 Sep. 22 1.02 13 600 ± 216 29.40 ± 3.84 32.80 ± 0.51 10.80 ± 0.65 1.64 ± 0.23 510.9 ± 17.4 744.0 ± 15.0 569.2 ± 12.5 649.8 ± 12.5 740.3 ± 14.7 TS 2018 Sep. 23 1.02 12 800 ± 249 – 28.60 ± 0.61 9.48 ± 0.62 – 394.5 ± 12.5 596.1 ± 12.5 – – 629.3 ± 15.2 TN 2018 Sep. 25 1.03 10 880 ± 216 29.00 ± 4.15 27.30 ± 0.54 9.62 ± 0.76 1.24 ± 0.31 406.8 ± 22.4 611.7 ± 19.9 460.0 ± 20.1 540.5 ± 14.8 611.6 ± 15.3 TS 2018 Sep. 29 1.04 11 300 ± 254 23.80 ± 4.11 24.50 ± 0.58 7.21 ± 0.67 0.79 ± 0.19 368.1 ± 20.4 517.1 ± 15.1 530.7 ± 17.8 535.4 ± 15.2 TN 2018 Oct. 01 1.05 10 220 ± 217 18.40 ± 3.68 22.40 ± 0.52 7.84 ± 0.64 1.13 ± 0.23 381.4 ± 23.2 490.7 ± 20.6 368.1 ± 21.9 418.3 ± 15.3 478.8 ± 15.7 TS 2018 Oct. 02 1.06 9860 ± 182 19.50 ± 3.27 21.70 ± 0.52 6.55 ± 0.71 1.04 ± 0.21 350.8 ± 15.3 – – – – TS 2018 Oct. 04 1.07 9460 ± 268 20.20 ± 0.55 5.95 ± 0.63 0.70 ± 0.18 282.6 ± 14.0 412.3 ± 12.2 – 411.2 ± 12.2 437.4 ± 15.4 TN 2018 Oct. 08 1.08 8340 ± 248 10.70 ± 3.53 16.80 ± 0.53 4.03 ± 0.61 0.36 ± 0.17 – 318.5 ± 19.9 – 350.5 ± 12.2 350.5 ± 18.3 TN 2018 Oct. 12 1.10 5950 ± 248 – 15.80 ± 0.52 4.24 ± 0.63 – 199.7 ± 12.3 280.1 ± 19.1 – 294.6 ± 12.8 296.5 ± 20.4 TN 2018 Oct. 14 1.12 4730 ± 247 11.00 ± 4.16 13.30 ± 0.52 3.90 ± 0.67 – 190.9 ± 25.7 – – 234.0 ± 17.3 269.8 ± 20.5 TS 2018 Oct. 15 1.12 – – – – – 166.9 ± 18.3 257.9 ± 18.6 192.1 ± 21.2 226.1 ± 13.3 – TS 2018 Oct. 18 1.14 – – – – – 151.0 ± 17.2 – – 208.2 ± 12.4 230.8 ± 11.7 TS 2018 Oct. 18 1.14 – – 10.80 ± 0.54 – – – – – 229.7 ± 14.3 – TN 2018 Oct. 21 1.16 – – 9.87 ± 0.51 3.02 ± 0.65 – – – – 198.2 ± 19.4 – TN 2018 Oct. 22 1.17 3500 ± 188 9.04 ± 0.50 2.30 ± 0.65 0.34 ± 0.21 137.6 ± 21.1 149.0 ± 26.1 – 114.4 ± 13.3 127.9 ± 14.4 TS 2018 Oct. 25 1.19 – – – – – – – – 111.5 ± 20.0 – TS 2018 Oct. 28 1.21 – – 6.00 ± 0.55 – – – 151.2 ± 13.8 117.2 ± 16.5 137.6 ± 12.1 144.7 ± 14.1 TS 2018 Nov. 01 1.24 2320 ± 234 – 6.88 ± 0.56 – – – 108.1 ± 18.6 85.7 ± 23.6 109.6 ± 15.7 123.2 ± 12.4 TS 2018 Nov. 05 1.27 2010 ± 191 – 5.62 ± 0.52 1.16 ± 0.66 – 95.7 ± 20.4 120.5 ± 21.8 50.1 ± 16.2 121.1 ± 15.4 139.0 ± 15.0 TS 2018 Nov. 09 1.31 – – – – – – – – 88.8 ± 13.4 129.3 ± 15.6 TS 2018 Nov. 14 1.35 – – 4.39 ± 0.55 1.27 ± 0.69 – 85.5 ± 13.2 88.7 ± 18.7 87.2 ± 14.6 86.9 ± 13.6 91.3 ± 12.0 TS 2018 Dec. 07 1.55 – – 3.30 ± 0.52 – – – – – 42.9 ± 10.5 71.7 ± 13.2 TS 2018 Dec. 10 1.58 – – 3.00 ± 0.56 – – – 75.9 ± 14.2 28.1 ± 13.9 – TS 2018 Dec. 19 1.66 – – 3.30 ± 0.54 – – – 80.6 ± 12.5 27.2 ± 11.5 172.3 ± 18.2 TS 2018 Dec. 29 1.75 – – – – – – – – – 57.9 ± 18.1 TS 2019 Jan. 14 1.90 – – – – – – – – 60.7 ± 11.1 – TS 2019 Jan. 15 1.91 – – – – – – – – 57.2 ± 11.0 60.4 ± 11.6 TS 2019 Jan. 29 2.04 – – – – – – – – 85.5 ± 11.4 93.5 ± 11.5 TS 2019 Feb. 02 2.08 – – – – – – – – 83.7 ± 12.5 91.6 ± 11.3 TS 2019 Feb. 04 2.10 – – – – – – – – 71.5 ± 22.0 96.3 ± 17.1 TS


![[PDF] Cours générale pour débuter avec le langage de balises XML | Cours informatique](data:image/gif;base64,R0lGODlhAQABAIAAAP///wAAACH5BAEAAAAALAAAAAABAAEAAAICRAEAOw==)