Design and implementation of a continuous improvement framework,
focusing on material and information flow, for the manufacturing of
Organic Photovoltaics.
bySusheel Teja Gogineni
B.E. in Mechanical Engineering M.Sc. in Mathematics Birla Institute of Technology and Science, Pilani, India, 2009
Submitted to the Department of Mechanical Engineering in partial fulfillment of the requirements for the degree of
Master of Engineering in Manufacturing
at theMASSACHUSETTS INSTITUTE OF TECHNOLOGY
September 2011 MASSACHUSETS INSTITUTE OF TECHNOLOGYNOV 0
1
2011
LIBRARIES
ARCHIVES
@2011 Susheel Teja GogineniAll rights reserved.
The author hereby grants MIT permission to reproduce and distribute publicly paper and electronic copies of this thesis document in whole or in part
Author...
Certified by ...
6 -1
Accepted by ....
/...
Susheel Teja Gogineni Department of Mechanical Engineering
August 18, 2011
David E. Hardt
Ralph E. and Eloise F Cross Professor of Mechanical Engineering Thesis Supervisor
David E. Hardt Ralph E. and Eloise F. Cross Professor of Mechanical Engineering Chairman, Committee on Graduate Students
Design and implementation of a continuous improvement framework, focusing on material and information flow, for the manufacturing of Organic Photovoltaics.
by
Susheel Teja Gogineni
B.S. in Mechanical Engineering, M.Sc. in Mathematics Birla Institute of Technology and Science, 2009 Submitted to the Department of Mechanical Engineering in partial fulfillment of the requirements for the degree of
Master of Engineering in Manufacturing
Abstract
Konarka Technologies is an organic photo voltaic solar panel manufacturing startup and is currently in the process of ramping up their production volumes. The MIT team has worked on numerous improvement activities that helped improve different aspects of the manufacturing plant. This thesis specifically focuses on my work that involved implementing a continuous improvement framework for waste reduction in material and information flow, through Shop floor reorganization Kaizen event, while briefly describing other improvements that were implemented as a Team. These included an online barcode part tracking system and Kanban cards Information boards, a Production scheduling tool to help achieve an efficient production plan and finally a Kaizen Board to help continue the
improvement activities carried out during the course of this research. These systems were successfully implemented and the improvement activities and associated training sessions helped in increasing employee participation and initiative in improving the operations of the shop floor.
Key words: layout design, tracking system, Kanban, Kaizen, lead time reduction, Inventory reduction.
Thesis Supervisor: David E. Hardt
Acknowledgements
Thanks are due to Mr. Larry Weldon and Mr. John Lawlor for making this project at Konarka Technologies happen. With your courtesy, proficiency and support, I had experienced an exciting, formative and successful internship. I will miss the time at KNB (Konarka New Bedford) and will remember the lesson learnt and apply it in my future endeavors.
I would also like to thank Susan Cusack, Bill Novik, Dan Palan and everyone who assisted us during our project. Special thanks go to Dan the man and all other people on the shop floor. You were supportive and helpful; you generously shared your experience and patiently answered my copious questions. All of these make me happy working at Konarka.
I would like to convey my unreserved gratitude to Professor David E. Hardt and Dr.Brian W. Anthony for their time and valuable suggestions on critical problems in my project, and to Ms. Jennifer Craig for her lectures on English writing skills and advice on improving the structure and wording of my thesis.
I would like to thank my friends, classmates and colleagues. It was nice working with you and I learnt a lot from you. Lastly and most importantly I would like to thank my team members Gregorio Colaci, Jason Chow and Ming Gong for support throughout the course of the project. Thanks for giving me your unconditional friendship.
Table of Contents
A bstract ... 2
A cknow ledgem ents ... 3
List of Figures ... 8
List of Tables ... 9
Chapter 1: Introduction...10
1.1 Com pany Background ... 10
1.2 M arkets...11
1.3 Product - Pow er Plastic ... 11
1.4 Photovoltaic Industry Overview ... 14
1.5 M anufacturing Processes...17
1.5.1 M anufacturing Facility ... 17
1.5.2 Process O verview ... 17
1.5.3 Coating Processes...19
1.5.4 Finishing Processes ... 20
Chapter 2: Problem Statem ent and O bjectives...22
2.1 Problem Statem ent...22
2.1.1 O perations M anagem ent Issues... 22
2.1.2 T echnical Issues...23
2.2 Project O bjectives ... 24
Chapter 3: Literature Review ... 27
3.1.1 W aste R eduction...28
3.1.1.1 Product Transport & H um a n M ovem ent W aste... 28
3.1.1.2 Inventory & Inconsistent Flow ... 29
3.1.1.3 Over-processing W aste...30 3.1.1.4 D efects W aste ... 30 3.2 Kaizen ... 30 3.3 5S M ethodology ... 31 3.3.1 O bjectives ... 34 C hapter 4: M ethodology ... 36
4.1 M aterial Flow Im provem ent Kaizen Event ... 36
4.1.1 Current plant layout...37
4.1.2 M apping and D ocum entation... 37
4.1.3 T im e study and inventory analysis ... 38
4.1.4 O bservation and interview s ... 39
4.1.5 K aizen event ... 40
4.2 Inventory Tracking System ... 4 1 4.2.1 A utom atic barcode part tracking system ... 41
4.2.2 K anban Board ... 42
4.3 Production Scheduling Tool ... 43
4.3.1 Scheduling Issues ... 43
4.4 K aizen Board ... 45
4.4.1 Kaizen Events Section ... 46
Chapter 5: Results and Discussion...48
5.1 M aterial Flow Im provem ent Kaizen Event ... 48
5.1.1 Current Layout - M apping ... 48
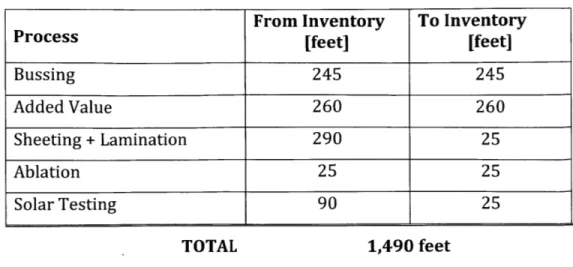
5.1.2 Tim e Study and M aterial m ovem ent... 50
5.1.3 Proposed Layout Im provem ents... 51
5.1.4 Kaizen Event...54
5.1.5 Spaghetti diagram ... 55
5.1.6 Issues M apping...58
5.1.7 A pproved layout im provem ents... 60
5.1.7 Im plem entation plan ... 63
5.2 Inventory Tracking System ... 64
5.2.1 A utom atic barcode part tracking system ... 64
5.2.2 Kanban Cards Boar d ...
66
5.3 Production Scheduling Tool ... 68
5.3.1 Tool Layout...68
5.3.2 O utputs and Visualization ... 70
5.4 K aizen B oard ... 71
5.4.1 Layout of the board ... 71
5.4.2 Current status of the board... 74
Chapter 6: Conclusion and Recom m endations ... 75
Chapter 7: Future w ork ... 77
7.1 Inform ation Flow ... 77
7.2 M aterial Flow ... 77
7.3 M achine Im provem ents...78
B ibliography ... 79
Appendix A - Applications of Product (Konarka Power Plastic) [4] ... 81
List of Figures
Figure 1 - Coated Layers in Konarka's Power Plastic [4]... 12
Figure 2 -20 lane wide, 6 modules Product (620) [4]... 13
Figure 3 -Total Energy Collected in one Day [4]... 16
Figure 4 -Product Architecture showing the various layers, Buss bar and Encapsulation [4] ... 1 8
Figure 5 - Coating Phase - Processing Steps ... 19 Figure 6 - Finishing Processes. During Bussing and P.P. the product is in roll format and stored in nitrogen cabinets between the processes. After sheeting and lamination the product is in panel format and it is manually handle from process to process ... 20
Figure 7 -Continuous Improvement Cycle [15] ... 32
Figu re 8 - 5S M eth o d ology ... 3 3
Figure 9 -AutoCAD drawing of floor Layout. The pink blocks are inventory tables which do not have designated locations. Also the flow of materials is not clear from the layout due to im proper placem ent of equipm ent. ... 49
Figure 10 -Proposed floor layout. The Blue blocks are processing stations and green blocks are inventory locations. NC stands for Nitrogen cabinets... 53
Figure 11 - Issue Mapping - Red blocks show problems and blue blocks show areas of o p p o rtu n ity5...5 9
Figure 12 -Approved Layout. Process Flow through the finishing operations from Bussing to Solar Testing. The Slitter machine is currently not used... 61
Figure 13 -Approved Layout. Material Flow in/out the relocated WIP inventory areas...62
Figure 14 -Tracking System Schematic ... 64
Figure 15 - Kanban Board. Each column section represents a process. The Board is horizontally divided in three sections: 20, 40 Lanes and Test. The small yellow tags are nitrogen cabinets for rolls, the green ones for racks ... 67
Figure 16 -Gantt chart and Critical Path of Schedule ... 70
Figure 17 - Schematic of the Kaizen Board. Red Tags and space for operators' suggestion are made easily accessible in the shop floor as well as quality targets and Kaizen progresses ... 7 3
List of Tables
T ab le 1 -P ro cessin g rates...5 0
Table 2 -Material Movement, Current Layout ... 51
Chapter 1: Introduction
This Thesis addresses the various improvements implemented by a team of four MIT Master of Engineering in Manufacturing students at Konarka Technologies manufacturing plant. It briefly mentions all the improvements implemented by the team while specifically focusing on the author's contribution in establishing a continuous improvement framework for waste reduction in material and information flow. This was accomplished through a Shop floor reorganization Kaizen event and the assistance provided in implementing part tracking tools such as and online barcode part tracking system and Kanban card information boards, a production scheduling tool to help achieve an efficient production plan and finally a Kaizen Board to help continue the improvement activities carried out during the course of this research at Konarka Technologies, an organic photo voltaic solar panel manufacturing startup. This research work was carried out at the company's recently opened New Bedford plant. The plant is currently running pilot runs and is in the process of setting up systems to gear up for full scale production.
Other projects focuses include production scheduling and data analysis (Jason Chow's thesis [1]), Kaizen 5S continuous improvement (Gregorio Colaci's thesis [2]), and improved shop floor information sharing (Ming Gong's thesis [3]). Some of these projects were worked on as a team which each member focusing on solving different issues which have a common solution. This approach ensured that the tools and improvements implemented would help achieve multiple benefits.
1.1 Company Background
Konarka Technologies is the world leader in organic photovoltaic technology. The company was started in 2001 by a group of scientists at the University of Massachusetts, Lowell. The team was led by Dr. Sukant Tripathy, an internationally renowned material scientist at UMASS, Dr. Alan Heeger, a Nobel Laureate in Chemistry, and Howard Berke, the current Executive Chairman of the company. The vision of the company is to "imagine a world free
of carbon emissions, a world where even the poorest. Most remote village has internet access & electricity, and a world where power is safe, plentiful and truly green." [4]. the organic photovoltaic technology developed by the founding members led to investments of over $170 million in startup capital and government research grants. The company currently has investment collaborations with companies such as Chevron, Total and Massachusetts Green energy Fund etc. Konarka Technologies has a staff of over 80 people in 2 locations; Lowell, MA and New Bedford, MA. The R&D facilities and corporate office as located in Lowell, MA which also has a small scale pilot manufacturing unit. In the first quarter of 2009, the company expanded to a 250,000 sq. ft. manufacturing plant in New Bedford, MA. This facility was formerly a Polaroid plant with a low energy footprint and a continuous roll-to-roll manufacturing capability.
1.2 Markets
The Company's product portfolio caters to 3 markets namely, Portable Power, Remote Power and Building Integrated Photo Voltacis (BIPV) applications. The Potable Power markets consist mainly of charging units for small portable devices such as mobile phones and laptops whereas the Remote Power markets use large sized panels to cover carports, awnings and tents which provide power to electric car charging ports, advertising boards etc. The company caters to these markets through two kinds of channels; direct sales and sales to other manufacturers who integrate these components into their products. The third market is the BIPV applications where solar panels are sandwiched between sheets of glass and used as windows, retractable shades and greenhouses. (see Appendix A)
Konarka is now focusing on shifting towards manufacturing larger solar panels and hence is concentrating more on the BIPV market. This shift has led to the evolution of the product & manufacturing processes which will be described in the later sections.
1.3 Product - Power Plastic
Power plastic is thin, flexible and lightweight solar panel which converts solar energy into electricity by passing sunlight through a specialized polymer material. This photo-reactive
polymer material is the heart of OPV and is a Konarka's patented technology. Konarka's founder Dr. Alan Heeger won the Nobel Prize in 2000 for synthesizing this polymer. In addition to this polymer patent Konarka technology is also protected by over 350 patents in research and manufacturing of OPV panels.[4] They are constantly improving the performance and are currently at 8.3% efficiency (NREL certified). Further layers included with in power plastic are shown in the Figure 1.
e Transparent Electrode -This is the cathode and acts as the source for electrons.
" Printed Active Materials - Photo reactive polymer
" Primary Electrode - This Silver layer acts as the anode which collects the electrons. " Substrate - This is a conductive layer on which the anode, cathode and active
polymer are coated.
e Transparent Packaging: These layers which are present on either side, help protect
the organic polymer and other layers from degradation.
Transparent
Packaging
Transparent
Electrode
uMuPrinted
Active
Material
Prinary
Electrode
Substrate
LOWThe different layers are coated on the substrate in lanes which are about half inch wide. These lanes are connected to each other in a series connection. This type of printing gives it the striped appearance that is shown in the Figure 2. The number of lanes in a product determines the voltage rating. Konarka typically produces 20 and 40 lane panels. These lanes are connected on each end to a buss bar which is used for making external connections. The roll is divided into 1 foot long sections during the coating process. Each section is called a module and multiple modules are connected in parallel to form a panel of the required size and current rating.
Figure 2 -20 lane wide, 6 modules Product (620) [4] Characteristics that determine Product Variety:
e Density of the primary electrode - opaque and grid silver patterns
e Transparency of the polymer - BIPV applications require higher transparency level e Color of the active polymer - red, green, gray
e Packaging material -clear or matt finish encapsulation
* Length of the panel - can range from 1 module to 11 modules in length
As mentioned in earlier sections, Konarka is currently focusing on BIPV application and hence the product is being altered to meet the specific demands of the market. Transparent polymer with slightly reduced efficiency is being produced specifically for the BIPV market.
3 polymer color options are offered to appeal to wide range of customers. The dimension of the product is also defined by the size of the window in which it would be integrated. The company is moving towards wider formats to accommodate large windows (60 lane product). Also the gap between modules is being eliminated to have seam less window integrated panels. All these changes add complexity to the operations in terms of increased product range and modified manufacturing processes to accommodate these above mentioned changes.
1.4 Photovoltaic Industry Overview
Photovoltaics are the fastest growing power-generation technology, with an average annual increase of 60% in power-generating capacity from 2004 to 2009 (up to 21 GW in power generated in 2009). With the sun producing approximately 1 kW/m 2 of energy on a sunny day, photovoltaic technology is a promising renewable energy source for the world's energy needs. If all of the sun's energy that strikes the earth is collected for one hour, it is enough to meet the world's energy needs for one year [5].
There are many different types of photovoltaic technologies which are differentiated based on the material and manufacturing process, and these can be roughly divided into three types. The most common form of solar panels is the bulk crystalline silicon (c-Si, or just Si) solar cell. This technology capitalizes on the well-developed semiconductor industry which processes silicon ingots for use in semiconductor devices, and as such, the Si solar panel industry is also well-developed. However, these panels are on the order of hundreds of micrometers, and due to the use of large quantities of Si material, the cost per panel is high. Consequently, the solar photovoltaic market is trending towards thin-film solar panels; although the efficiency may be slightly lower compared to Si solar cells, the material costs are significantly reduced. Thin-film solar panels can be deposited on glass or on flexible
substrates, which allows for flexibility of the panels; Si solar panels can only be deposited onto rigid glass. Amorphous silicon (a-Si), copper indium gallium selenide (CIGS) and cadmium telluride (CdTe) are the three most common thin-film solar panel materials. Typically, these panels are manufactured using physical vapor deposition (PVD) or chemical vapor deposition (CVD) processes and may require vacuum conditions, and this increases the manufacturing costs and process complexity. These processes are also size-limited and difficult to scale up. Moreover, CIGS and CdTe require toxic materials in its manufacturing processes and are toxic at the end of life, which presents an additional challenge in manufacturing and recycling the panels [6]
Because of the limitations of the above thin-film solar technologies, alternate inexpensive and non-toxic materials and large-scale manufacturing technologies are being explored. This category includes dye-sensitized solar cells and organic photovoltaics (OPVs). Because
of the ability for the materials to be processed in a solution form, the solar panels can be manufactured using a roll-to-roll process by coating or printing the active materials on a flexible substrate. The solar conversion efficiency of these panels is quite low, but the organic solar panels have the lowest manufacturing complexity, and the organic materials used can have various colors and transparencies, allowing for greater customization in the solar panels.
Moreover, the low-light electricity generation capacity in organic photovoltaics is much higher than in other technologies, allowing the panels to generate electricity even indoors or on cloudy days. Thus, the total energy collected by OPVs is comparable to other technologies; even though the solar conversion efficiency is lower (see Error! Reference source not found.). Konarka Technologies is a world leader in the roll-to-roll manufacturing of organic photovoltaics.
During morning hours, Power Plastic begins collecting energy earlier.
60
1
s50
During midday hours, Power Plastic energy collection increases at a faster rate, due to our superior thermal coefficient.
N OPV - Power Plastic
m aSi
N cSi
N CIGS
Solar Irradiance
5 AM 7 AM 12 PM
Power Plastic continues to collect energy later in the day, while others "flatline". 1400
3
1200 1000 E 800 U 600 M 400 200 0 7 PM 9 PMFigure 3 -Total Energy Collected in one Day (per watt equivalent panel) [4]
The three metrics used to judge the performance of organic photovoltaic technology relative to other photovoltaics and forms of energy are cost, solar conversion efficiency and lifetime. Currently, Konarka is able to achieve a 8.3% efficiency and a 5-year lifetime in a laboratory setting, and its cost per watt is comparable to that of Si solar panels. However, to increase its competitive advantage, these three performance factors have to improve through improvements in R&D and manufacturing, as the efficiency is much lower
1.5 Manufacturing Processes
1.5.1 Manufacturing Facility
The manufacturing site is a 250,000 sq. ft. former Polaroid facility located in New Bedford, MA. Polaroid's world leading film production plant gave Konarka great starting advantages. With some changes of Polaroid's film producing facility, Konarka currently manufactures thin film OPV solar panels with its continuous roll-to-roll printing technique. This equipment allows Konarka to produce panels as wide as 60 inches.
1.5.2 Process Overview
Thin film OPV solar panels are made using an electronic printing technology that coat layers of material onto a transparent plastic sheet. A schematic layout of different layers of the product is shown in Figure 4.
The print head can have 10 lanes, 20 lanes, or 40 lanes slits for liquid coating onto the plastic web. The print head must be precisely adjusted for desired product architecture.
Figure 4 - Product Architecture showing the various layers, Buss bar and Encapsulation [4]
After the solar panels have been properly coated, it will go through a finishing process that encapsulates the solar panels between two plastic barriers. Therefore, the entire manufacturing process can be categorized into coating processes and finishing processes. With the adoption of continuous roll-to-roll printing technology, all the coating processes are and operating reliably. Currently, the finishing processes are still labor intensive and new to the company. This project focuses primarily on the finishing processes. More details about the whole manufacturing process are given in the following paragraphs.
1.5.3 Coating Processes
The coating processes consist of a total of 6 layers printed on top of the substrate: * Laser Scoring of Transparent Electrode,
e Hole Blocking Layer,
* Semiconductor Layer,
e Hole Injections Layer, e PEDOT Layer,
e Silver Electrode.
The coating process, which runs on a continuous web that is up to 4,000 feet long, can run 100 ft/min. This process takes place in a clean room environment, and the precision of different coating layers will affect the functionality of the solar panels. After silver electrode coating, the product will be transported to the finishing processes to turn it into a complete panel (Figure 5).
Incoming PEDOT Base Silver Electrode Hole-Blocking Layer PEDOT Layer Semiconductor Layer
Hole-Injection
Layer
To Finishing Processes1.5.4 Finishing Processes
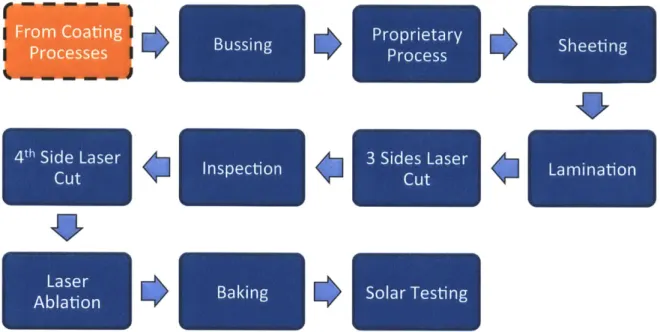
The bussing process is considered the start of finishing process. The finishing process schematic is shown in Figure 6.
From Coating Processes 4th Side Laser Cut Ablation
-*
*
*
Proprietary Process 3 Sides Laser Cut Solar Testing Bussing Inspection BakingFigure 6 -Finishing Processes. During Bussing and P.P. the product is in roll format and stored in nitrogen cabinets between the processes. After sheeting and lamination the product is in panel format and it is manually handle from process to process.
After coating, the solar panels will be stored in a roll format waiting to be finished. In the initial bussing process, the panels will be unrolled, and then bussed with conductive side bus bars, and then rolled again for storage. Similarly, another proprietary process after bussing, will require rolling and unrolling of the panels.
Then, the panels are unrolled and cut or "sheeted" to desired length followed by top and bottom lamination with plastic barriers and adhesives. An automated laser-cutting machine cuts the laminated panels on three sides (front, left, and right). This automated machine currently cannot cut the fourth side because the laser cannot move fast enough to cut the ending edge as it moves. All four edges will have a 1-inch margin of laminated
*
Sheeting
Lamination
material for packaging. The sheeting, lamination, and 3 sides laser cut processes are then streamed together.
After lamination, the panels will be visually inspected for aesthetic defects such as lamination bubbles or adhesive clots. Then, the panels will be trimmed on the 4th edge via laser cutter followed by laser ablations of two small holes in the lamination on two bus bars for electrical connection.
The panels are then baked in an oven a minimum of 3 hours for curing the adhesives used in lamination. Finally, the solar panels will be tested for solar power absorption.
Chapter 2: Problem Statement and Objectives
2.1 Problem Statement
During the initial observation period, the team identified several problems and possible areas of improvement. The issues were categorized into 2 sections: Technical issues that require retrofitting and troubleshooting some of the old equipment to get them ready for full scale production and operations management issues that require establishing material and information tracking systems to ensure better control on the production process. Each problem has been analyzed in terms of two key parameters: the probability of successful solution and the value that the improvement could bring to the company. This process has caused us to focus where our efforts are more needed (value addition) and where our capabilities and expertise can support us in accomplishing the goals we have set, given our time constraints. The value addition given to the company has been evaluated relative to the company and its start-up nature. The team believed that it is more important to build an improvement culture and bring concepts and ideas instead of focusing on a
single technical problem.
2.1.1 Operations Management Issues
The two main issues of focus were improving material movement through the shop floor to reduce wastage and increase problem visibility, and establishing part tracking systems that can help managers and operators track work-in-process inventory and to have accurate predictability of lead times. Also there is a need for a more structured platform for carrying out improvement activities in which all the operators are involved and feel a sense of ownership towards the solutions.
2.1.1.1 Material Flow
During our observations and interviews with the operators the team has identified that there is scope for improvement in the way the various processes are arranged on the shop floor. We have identified the need for a more structured movement of materials around the shop floor. This could lead to better problem visibility and increasing productivity. The objective of the company for this year is to ramp up their production be able to meet a potential growth in customer demand. Given this, they will need to rearrange their shop floor to reflect this growth. There needs to be more space allotted for work-in-process inventory in order to handle larger volumes. Also the lead times for their processes have to be documented and used to accurately predict delivery dates.
2.1.1.2 Information Flow
The information flow and part tracking systems that exist are manual and labor intensive. There is need for automating these systems in order to have better control over the inventory and status of the production orders. Not having track of work-in-process inventory leads to time consuming and inefficient operations for the operators such as manual counting and looking for parts. Problems are hidden and not quantified because the current performances in term of yield and time are not recorded. These problems will worsen as volumes increase and there is a need for automated part tracking and to have to system accessible to the operators.
2.1.2 Technical Issues
Here are some of the technical issues with the existing finishing processes that were investigated before defining our area of focus.
2.1.2.1 Lamination
The lamination is the finishing process where the company is experiencing most problems. The main issue is related to air bubbles that develop in the adhesive underneath the lamination material. The bubbles do not affect the performance of the panels but they are a cosmetic issue that needs to be solved especially since the company that sees potential
growth in the window integrated solar panels. However, operators and management are already focused on this problem and they have the experience and the expertise to work on it. The Team feels that the value addition it can bring is not substantial and we have decided not to focus on it.
2.1.2.2 Ablation
The ablation process is carried out manually panel-by-panel by the operator. It is a time consuming process and it requires manual handling of the panels that should be minimized in order to prevent scratches. Ideally this process needs to be in-line with the lamination. This will solve the issue of handling, will speed up the process and there will be less work-in-process inventory since the whole operations from sheeting to ablation will be in-line. Despite the fact that designing an in-line ablation machine would be of a great value for the company we feel that given the time constraints of the project the probability of success is low. Also, there are more pressing issues in the shop floor that need to be tackled first. 2.1.2.3 Solar Testing
As with ablation this operation is manual and since 100% of the panels are tested it is a very slow process relative to all others, especially for big panels. Having an in-line solar test station would be the ideal situation but it does not seem the biggest concern right now, both for the company and for us. Also, in terms of future plans a test on each panel may not be necessary and we think there is much more work to do upstream before focusing on solar testing.
2.2 Project Objectives
Based on the problems identified during the observation phase the team has decided to focus on improving the operations of the company in the finishing stage of production. Our goal is not just to leave the company with tools to improve its manufacturing operations, but to explain the process that has brought us to their development and to demonstrate their effectiveness, in order to ensure future continuous improvement activities.
In term of the short-term objectives, the main focus has been to provide some tools necessary to boost the production and to build a reliable and efficient system able to meet the future demand, since the company is expecting to grow rapidly in the future. This represents in fact another challenge: at the time of our project the company was still not running at full capacity. It is worth reiterating that Konarka Technologies was focusing on improvement of its manufacturing process and production was focused mainly on a series of test product. That said, the team has worked on the improvement of the current system, but always taking into consideration the future plans and perspectives of the company. The production model that was in place, was working well enough in the small scale, but it would not be able to keep up with the growth that Konarka Technologies expects.
To implement these improvements different projects were split between the members of the team. The planning phase for all the projects was worked on as a team so as to critique each other's ideas and ensure a robust and error proof design.
Some of the improvement activities the team implemented were
e Defining and implementing an improved material flow for the finishing process
through a Kaizen event that involved all the operators and engineers involved in the finishing process. This helps in increasing problem visibility and in having better control on the work-in-process inventory. This topic is the main focus of this thesis and will be explained in detail in later chapters.
" Automated part tracking system schematic that tracks panels through various processing steps. The schematic and framework was designed and the project was handed over to a team of in house engineers for implementation. In addition to this Kanban card tracking board was implemented that tracks rolls of material and production orders by means of a physical board placed on the shop floor. This project has been. These topics are discussed in detail in Jason Chow's [1] and Ming Gong's thesis [3].
* Production scheduling Tool that helps schedulers in accurately predicting production lead times and hence reduce work-in-process inventory. This tool is designed to be editable according to the improvements in the processing times of
each of the machines. This topic is discussed in detail in Jason Chow's thesis [1]. * Finally implementing a Kaizen Board that tracks continuous improvement Kaizen
activities through its various stages and to display company's current status by means of a 5S survey. This topic is discussed in detail in Gregorio Colaci's thesis [2]
Chapter 3: Literature Review
The objective of the projects undertaken at Konarka was to implement improvements and develop system that would help the company reduce the wastage in terms of material movement, work in progress inventory and to incorporate a continuous improvement culture. We have reviewed lean manufacturing to understand the various ways of reducing waste, Kaizen events to study the process of implementing changes with operator acceptance and finally 5S methodology to evaluate the system and to quantify improvements.
3.1 Lean Manufacturing
Lean manufacturing is a production practice that increases the effectiveness of the company's resources for value creation for the end customer. In other word, this practice increases or maintains the value of its product to the company's customer while lowers its own manufacturing cost. The lean concept is centered on preserving value while reducing work and resource use. The lean philosophy is originally derived from the Toyota Production System (TPS) [8]. TPS is renowned for its waste reduction practices and achievements that also improve overall customer value. The success of Toyota relied heavily on its TPS philosophy and concepts.
Lean practices involve production flow improvement and is centered around optimization of the use of resources, whether time or capital, The two major lean concepts are smoothing work flow (Just in Time) and human oriented automation (smart automation which focuses on what humans do best and empower humans with automated machines/systems). Currently, Konarka, as a startup company, still lacks a robust structured information gathering and sharing system. Therefore, our work at the company focuses mainly on smoothing workflow, consolidating information sharing, and other operation improvements. As such, the two lean implementations we seek to achieve are waste reduction and Kaizen continuous improvement.
3.1.1 Waste Reduction
In lean manufacturing, waste is a loose term that describes any ineffective usage of resources. All unnecessary materials, resources, and non-value added work are considered waste. Specifically, there are product transport & human movement waste, inventory & inconsistent flow, over-processing waste, and defect wastes [9]. In the following literature review, applicable theory and examples will be discussed in details.
3.1.1.1 Product Transport & Human Movement Waste
Product transport & human movement waste are mostly productive time and resources wasted on non-value added work. Usually, this can be reduced via improving the process flow, factory layout, and possibly the machines. Historically, perhaps the most famous implementation of this is Henry Ford's moving assembly line [10].
Henry Ford saw workers in automobile industry waste a lot of time walking back and forth, getting different tools and parts. To reduce all of these movement wastes, Ford introduced the moving assembly line that drastically reduced people's movement within the factory. The assembly line moved the automobile smoothly in an in-line assembly plant where all the automobile parts were assembled onto the car at different workstations. Thus, workers didn't have to move at all, and each worker just needed to handle a specific simple assembly task with a designated tool. This revolutionary manufacturing idea soon has spread throughout the world, and fundamentally has boosted manufacturing capacity (especially automobile) to an unprecedented level.
Similarly, the factory layout is crucial to product transport and human movement waste reduction. Common practices include Value Stream Mapping or Process Stream Mapping, which originated from Toyota [9]. At Toyota, it is also known as "material and information flow system". The five steps of this Value Stream Mapping implementation are followed:
1. Identify the product or service
2. Understand and Identify the current layout, manufacturing steps, process delays, and information flows of the factory
3. Evaluate the current process flow map and identify possible areas of improvement 4. Design a future layout and process stream map
5. Implement the improvements, get feedback and adjust accordingly
Ideally, Value Stream Mapping also identifies the value-added processes. Thus, operational managers can minimize the non-value added processes and focuses on the big value added processes. In Konarka, however, the target products are solar panels that are coated in a roll-to-roll manufacturing process; therefore, our main objective would be to organize and smooth production flow to reduce movement waste. An organized layout will facilitate material movement and minimize worker idleness due to lost parts or unorganized material handling.
3.1.1.2 Inventory & Inconsistent Flow
Three main reasons for keeping inventory are: to buffer against lead time, to offset uncertainties, and to take advantage of economy of scale (bulk transport). Work-in-process (WIP) inventory is created to offset different process variations so that it can smooth out the production line. On the other hand, finished inventory work is a buffer against production lead-time. There is raw material inventory, WIP inventory, and finished goods inventory. Focusing on the finishing side of Konarka's manufacturing facility, we will look closely at managing WIP inventory.
Just in Time (JIT) production is a practice of reducing WIP inventory with continuous and smooth production processes. This will require detailed process time study and scheduling improvements. It is also essential to make the fluctuating or problematic process more apparent so that people can identify the problem as soon as possible.
Barcode or RFID identifications are also commonly used to track the work-in-process inventory throughout the production line. An accompanying database can systematically track the exact quantity, quality, and location of the WIP inventory. On the shop floor, it may also be easier to work with a more physical form of inventory tracking such as a physical information board.
3.1.1.3 Over-processing Waste
Over-processing waste refers to the ineffective manufacturing process or design used in the facility. Designed for Manufacturing (DFM) and machine automation practices (e.g. laser trimming and ablation machine) can be implemented to reduce such over-processing waste. These improvements, however, require a longer development phase and fall outside of the scope of our project.
3.1.1.4 Defects Waste
Solar panel defects are a major manufacturing problem at Konarka. Many panels with low efficiency and aesthetic defects such as bubbles or adhesive overflow would become scrap, later recycled for silver. Removing these defective panels at early stage of the process also avoid over-processing waste. It is essential for the company to establish and maintain a robust yield tracking that facilitate production yield improvement. Currently, most defects occur at the coating and lamination processes, and permanent employees are already working on them.
3.2 Kaizen
Kaizen is a Japanese word meaning "improvement", and is commonly used to refer to continuous improvement [11]. It was developed by Japanese businesses during the restoration period after the World War II. When applied in manufacturing, Kaizen signifies companywide activities that continuously improve the manufacturing process and systems involving all employees.
Kaizen is usually implemented as a standardized and periodic activity within the company to achieve lean manufacturing. It seeks to implement the scientific method of hypothesis, testing, learning, and improvement to every corner of the factory with involvement of all of its workforce. In some companies such as Toyota, there are teams that are formed solely for managing Kaizen activities within the company. A standardized cycle of Kaizen activity may include the following.
1. Standardize operations and systems 2. Measure operation performance 3. Set performance goal
4. Obtain feedback from all workers; innovate ideas 5. Standardize new systems
6. Repeat
As a continuous improvement model, Kaizen seeks to find the root causes of problems and unceasingly improve operations. The active involvement of all the employees have profound benefits such as improved teamwork, morale, personal discipline, and voice for suggestions. Such company cultures usually contribute to a company's success.
3.3
5S
Methodology
The 5S methodology ([12], [13], [14], [15], [16]) is a tool used to improve operational performance. It involves the organization at all the level and instills ownership of the process in each employees. The procedure is an effective way used in several companies to implement a continuous improvement culture and quantify its result. The key step and the most challenging one is to establish, especially with the operators (the closest people to the processes) a commitment to improve. At this point the improvement can actually begin, and this will lead to visible wins that will increase the motivation of the team, giving them a sense of ownership of the whole improvement process and increasing their commitment to the new philosophy (Figure 6).
1.
4. Increased
Motivation
rCommitted to
Improve
2. Begin
Improvement]
3. Gain Visible
JWins
_,
VFigure 7 - Continuous Improvement Cycle [15]
The SS are 5 steps that have to be followed by the operator and management to achieve the set goals. The 5S's originally correspond to the Japanese words: seiri, seiton, seiso, seiketsu and shitsuke, the english equivalent of which are: sort, straighten, shine, standardize, sustain (Figure 7).
The first 3S will lead to visible and practical results and are led by the shop floor. However, these steps have to be supported by the management which objective is to provide standardize procedures and sustainability for the continuous improvement.
Shop Floor Led Management Led Visible and Practical Cultural Figure 8 - 5S Methodology
Sort: The first step involves identify all the unnecessary items (tools, parts, work-in-process inventory) in the work area and then if not needed remove them. It is suggested to apply to 48-hour rule in order to evaluate whether an item is necessary or not. If something is going to be used in the following 48 hours it belongs there, otherwise must be disposed. It is important during implementation of sorting to look at everything: material, supplies, paperwork and not just at the core equipment. Also, in order for the procedure to be effective is has to be carried out by a team and not a single operator. The sorting stage is a big opportunity to reorganize the shop floor and to prioritize tools as per requirement and keeping them in easily accessible places.
Set in Order: The next step right after Sorting is Straight or Set In Order. Everything is in place and there is a place for everything is the idea that has to be followed while thinking about this step. The workplace should be arranged to ease the work carried out there and
to increase the flow of work. Everything has a clearly designed space and it is kept in that space. The goal is to promote efficient workflow and decrease time wasted to look for what is needed; operators should know where things are at a glance. The Straighten step helps to make material and tools accessible and to make
Shine: The aim of the Shine step is to maintain cleanliness as part of the daily work. Cleaning involved all the workspaces and equipment. They should be kept clean and organized through regular daily actions. Every operator is responsible for keeping the work area clean and orderly and a coordinator for the cleaning operations is clearly defined. Implementing Shine makes cleaning and inspection easier and makes errors stand out immediately.
Standardize: Standardize begins the cultural change. After successfully working through the first three steps, the physical changes made should become the standard for that work area. This step has to be led by the management that will provide documented standard operating procedures, 5S training and regular meetings.
Sustain: The final step is to maintain the benefits attained through the SS changes. This could be the hardest step to implement. Focus has to be maintained on the new procedures in order not to allow falling back into the old ways. Sustain is also an opportunity to seek for improvement, constantly reviewing the procedure and looking for chances for further development.
3.3.1 Objectives
In order to successfully implement the 5S methodology, as most of the tools of lean manufacturing, it is important that all the people involved understand its goals and objectives. It has to be clear that the adoption is not and end itself.
Improve Productivity:
Reducing time wasted to look for tools and material locating each piece of equipment in a defined location and getting rid of everything that is not necessary will result in an increased productivity of the plant.
Improve Plant Maintenance:
Through the 5S each operator will feel ownership of part of the plant. He will be responsible for keeping it tidy and clean and will notice potential problems before they spread out in the organization.
Improve Quality:
Lack of cleanliness and a disorganized environment can have a serious impact on the quality of the product manufactured in the facility. Also, it may impact the image of the company from the perspective of either customers or investors, whereas a well-organized facility sends a message of a well-organized company. In addition to that, reduced movement of material and standardized procedures help in keeping the quality of the product high.
Improve Safety:
Through SS it is possible to improve also Safety. Layout improvements, standardized procedures in place, clear pathways can significantly contribute to increase the safety of the workplace.
Chapter 4: Methodology
This thesis focuses mainly on improving the material flow by reorganizing the shop floor through a Kaizen event. The first part of this chapter describes the material flow improvements Kaizen event and later briefly describes the rest of the projects that were worked on by the team that helped in reducing waste and work-in-process inventory. The projects that the team has undertaken at Konarka have substantial personnel involvement associated with them. Any changes that we plan to make to the current system or new systems that we plan on implementing needed a lot of support from all the operators involved in these processes. It was important that we do not force any of our ideas on to them without considering their suggestions and opinions. Even the most mathematically optimized system can fail if we ignore the power of the human factor.
Hence most of our work here was based mainly on qualitatively understanding the operators mind set and resistance to change and designing a system that is welcomed by the people who will be using it. Our work involved an iterative design process that included multiple interviews with the operators, managers and finally with higher management. We have also involved the operators in the early design phase as part of the Kaizen event so as encourage them to take more initiatives and to finally develop a continuous improvement culture on the shop floor.
4.1 Material Flow Improvement Kaizen Event
Optimizing a plant layout can lead to improved productivity and better visibility of the issues and hence is the first and most important step towards eliminating waste on the shop floor. Further changes can be implemented along the way to increase productivity as demand for the product increases. These improvements can help Konarka optimize on space and improve productivity while having good visibility of the process issues such as bottle necks and machine starvation from lack of inventory.
4.1.1 Current plant layout
This project mainly deals with the finishing operations of the Konarka's New Bedford (KNB) roll-to-roll OPV manufacturing plant. KNB plant is a former Polaroid photographic film manufacturing plant that Konarka purchased along with the Polaroid equipment and hence comes with a few inherent constraints. Some of the equipment is difficult to relocate without incurring huge costs. Also the KNB plant has almost 3 times the space required for Konarka's current scale of operations. This might be thought of a non-issue as typically plant layout optimization events are done to increase the productivity within the available space without expanding to a new facility. But it was interesting to look at how having more space than required can cause material flow issues.
There are seven steps involved in the finishing process that follows the coating process. Of the seven steps involved in the finishing stage, the product is in a roll form during the first three operations and then gets sheeted into individual panels which make their way through the remaining value adding steps. The rolls are stored in pin racks and are handled using modified folk lifts. The handling of individual panels is more difficult than the rolls owing to the wide product mix manufactured by Konarka. The longer panels (eg: product code 1140 - 11 module long and 40 lane wide, which is 12ft x 3ft) are stored on flat top metal tables covered with scratch proofing material and are handled manually by a team. Manual handling leads to increased risk of damaging the panels and loss of productivity. Different strategies were required to improve the handling of these two forms of the product. Also OPVs degrade when exposed to oxygen and hence have to be stored in Nitrogen cabinets before they are encapsulated in a barrier material during one the finishing steps. More details will be provided in the results section regarding the exact layout and the scale of each of the machines.
4.1.2 Mapping and Documentation
A map of the current layout with all the machines and inventory handlers marked to dimension was needed to assist in the planning phase. Konarka's finishing process layout has been changed over the years because of the changes in the product size and the
addition on more processing steps, but the floor layout plan has not been updated to reflect these changes. Also it does not include the material handling tables or the dimensions of the machines. Accordingly, all the available resources were measured, labeled and documented with their dimensions, material handling and nitrogen supply capability. Later the resources were categorized according their utility and assigned appropriate naming conventions. Based on the documentation an updated current floor layout was created. Using this layout the current flow of the material was mapped. This floor mapping helped us identify the problems in the layout and served a useful tool during the reorganization phase.
4.1.3 Time study and inventory analysis
The next step in the process was to identify the bottlenecks in the process and to analyze the inventory requirements at each station so as to allocate appropriate space for inventory storage. Konarka is currently in the pilot-run phase and is in the process of ramping up their production to full scale manufacturing. Our project was to plan the layout suitable for full scale production. This created a challenge as the time studies performed were not representative of the actual production. There were difficulties in getting sufficient data points for the time study as the production runs were infrequent and limited in quantity of panels produced. Also the inventory levels required at each station have been calculated based on the current state of the system and then interpolated to future production rates. The equipment used on the floor is not yet robust and is being worked on simultaneously by Konarka engineers and the product is still in the introduction phase therefore constantly undergoing changes. These changes reduced the time at some of the processes and added time at others. At times new processes were also introduced into the system. One other challenge faced was that both the test runs and production runs were being run on the same cell and at times created inconsistent data. This method of evaluating the shop floor did not seem effective because of the above mentioned issues.
4.1.4 Observation and interviews
To understand the issues faced by the operators, the team worked on the shop floor for a week alongside the other operators and got an insight into the practical constraints and problems in the layout. With the help of our experience, floor mapping and time study we were able to identify all the problems in the layout.
Firstly the finishing area is divided up into 2 rooms which reduce the visibility of the problems. At times inventory begins to pile up in one of the rooms and there are no systems in place to communicate the same to the processes in the other room. Also the solar testing process, packaging, shipping and finished goods inventory are mixed up, without specific demarcation.
Secondly, the material flows in a zigzag manner around the finishing area in both the rooms because of improper placement of equipment. Also there is no specified location for the work-in-process inventory of each of the processes. This creates confusion and results in operators spending valuable production time searching for panels in the vast floor space. As mentioned earlier the panels have to be stored in nitrogen cabinets prior to lamination. It was found that these nitrogen cabinets are not located near the process that use the cabinets.
Despite the ample supply of floor space operators constantly find themselves being short of space on the handling tables and also floor space to accommodate more tables. We deduced that this is caused by the cluttered arrangement of the various process and miscalculations of the inventory and space required at the quality check process. To solve this issue operators manually move the panels to a table outside the clutter zone. The large panels are like the 1140s are very difficult to handle as they have to rolled individually or require a couple of operators to safely move them around. Also, there is a high risk of damaging the panels every time they are moved from one location to the other. This unplanned movement causes panels to go missing from time to time or they end up not meeting customer deadlines.
The situation at the solar tester is similar. Excessive inventory were found near the solar tester location without a clear visual record of panels that have been tested, ones that have failed or the ones that are waiting to be tested. This could create issues in terms of identifying the approximate lead time to finish a batch of panels.
In addition to our observations the operators were interviewed to get first-hand information about the issues that make their work difficult. Some of them were able to point out the problems and even suggest improvements to solve them. This was a good learning experience as we could think about the line between the theoretically optimal layout and practically feasible layout. On the other hand some of the operators that were interviewed found that there were no issues with the zigzag movement of materials. This also warned us about the possible resistance to change from some of the operators.
4.1.5 Kaizen event
There are two sides to implementing an improvement. One is defining the improvement and the second is operators following and implementing the improvement. The defining part can be done with mathematical analysis and optimization packages, but the difficult part is ensuring the changes stick and are implemented. This can only be done if the operators are involved in the defining phase and the improvements are designed to make their work simpler with less stressful without adding extra work.
Hence, with the approval of management, a layout improvement Kaizen event was started. The MIT team, shop floor operators, engineers and operations managers were included in the Kaizen team. The team was faced with a challenge; as this was the first Kaizen event at Konarka Technologies, we had to introduce the Kaizen team to the culture, the goals and the terminology of Kaizen and continuous improvement before executing the event. .We structured the event in two meetings plus an implementation stage to follow. The first meeting was meant to be an introduction to these topics and a way to encourage questions and considerations. The second meeting was to involve the operators in the design process of the layout.
4.2 Inventory Tracking System
In addition to the shop floor layout improvements implemented by the, the MIT team has implemented other improvements that help in tracking panels through various stages of the manufacturing process. This project is explained in detail in Chow's [1] and Gong's [3] thesis. This project further assisted the author in reducing waste and work-in-process inventory. This part of the improvement activities are targeted at improving information flow to track work-in-process and finished goods inventory. To ensure a robust system the team had developed 2 systems that would work in synergy to have an error-proof tracking of all the solar panels. The first is an automated part tracking system that scans and records data on all the panels at each of the processing steps. The second system is a physical representation of the movement of batches of material on a Kanban card board. The Kanban cards are moved on the board as of panels move to the next processing step, thereby giving a quickly easily interpreted overview of the current state of production. 4.2.1 Automatic barcode part tracking system
The first stage of this project was to develop a tracking system schematic, which illustrates the flow of material and where barcodes are printed and read. The team discussed the feasibility of this system with the stakeholders in this project, and both our group and the stakeholders feel that the implementation of this system will allow Konarka to greatly reduce its operating costs by reducing unnecessary inventory through the tracking system and also determining which processes require immediate attention to increase the yield and process rates. In this phase we have identified the need of the company and seek a tradeoff between an ideal system and a system implementable in the short term yet open to future upgrades. The first barcode printer for example has been located at the bussing step; although it would be better to have it at the end of the coating stage where the roll product if first completed. However, the coating process is a very fast and somewhat inaccessible process and it was not recommendable to implement an unproven system there at first. We have decided that the ideal location was on the bussing machine that is separated from the other processes. It can be started and stopped without big issues and it is definitely the
right place for tests. While thinking about the schematic, we have kept in mind also economic constraints and designed the system around the equipment already owned by Konarka and minimizing the purchase of new equipment. Further details of the overall project can be found in Chow's [1] (barcode system and data analysis) and Gong's [3] (operator interface) thesis.
4.2.2 Kanban Board
As discussed in the earlier section, there is a plan to implement a tracking system using data matrix that can be read with a barcode reader and transfer the data to an online database. This database will be stored online in Microsoft Dynamics, and can be accessed by production managers. This information, however, does not finds its way back to the shop floor especially with the difficulty of ongoing barcode tracking system development. Additionally, most operators are unfamiliar with the SQL online database, and the system still lacks a user friendly output display. Therefore in the interim, a Kanban style information board is proposed to keep track of work-in-process (WIP) inventory. This information board, which provides production information in the form of cards for each batch of production, can be very helpful for schedulers, operators and managers.
It is very important to display basic production information such as raw material, work-in-process and finished goods inventory's exact location and quantity to the operators on the floor to have a visual feedback on the current manufacturing progress. Information about the availability of work-in-process (WIP) inventory at each process gives the operator a visual warning that certain specific manufacturing process is becoming the bottleneck process. These small cues can help smoothing the production line. It is agreed that all this information will be available in electronic form in a database, but is inaccessible to the operators for the short term because of tracking system implementation difficulties and software user interfacing. Physical information boards can work very well in communicating information on the shop floor with total involvement of all the operators and act as a check on the electronic system and vice versa.
![Figure 1 - Coated Layers in Konarka's Power Plastic [4]](https://thumb-eu.123doks.com/thumbv2/123doknet/14679736.558963/12.918.120.774.557.974/figure-coated-layers-in-konarka-s-power-plastic.webp)
![Figure 2 - 20 lane wide, 6 modules Product (620) [4]](https://thumb-eu.123doks.com/thumbv2/123doknet/14679736.558963/13.918.116.788.455.641/figure-lane-wide-modules-product.webp)
![Figure 3 - Total Energy Collected in one Day (per watt equivalent panel) [4]](https://thumb-eu.123doks.com/thumbv2/123doknet/14679736.558963/16.918.105.832.110.595/figure-total-energy-collected-day-watt-equivalent-panel.webp)
![Figure 4 - Product Architecture showing the various layers, Buss bar and Encapsulation [4]](https://thumb-eu.123doks.com/thumbv2/123doknet/14679736.558963/18.918.115.793.110.652/figure-product-architecture-showing-various-layers-buss-encapsulation.webp)

![Figure 7 - Continuous Improvement Cycle [15]](https://thumb-eu.123doks.com/thumbv2/123doknet/14679736.558963/32.918.234.694.124.409/figure-continuous-improvement-cycle.webp)