HAL Id: hal-01009012
https://hal.archives-ouvertes.fr/hal-01009012
Submitted on 22 May 2018
HAL is a multi-disciplinary open access
archive for the deposit and dissemination of
sci-entific research documents, whether they are
pub-lished or not. The documents may come from
teaching and research institutions in France or
abroad, or from public or private research centers.
L’archive ouverte pluridisciplinaire HAL, est
destinée au dépôt et à la diffusion de documents
scientifiques de niveau recherche, publiés ou non,
émanant des établissements d’enseignement et de
recherche français ou étrangers, des laboratoires
publics ou privés.
Texture Analysis based Detection and Classification of
Surface Features on Ageing Infrastructure Elements
Michael O’Byrne, Bidisha Ghosh, Vikram Pakrashi, Franck Schoefs
To cite this version:
Michael O’Byrne, Bidisha Ghosh, Vikram Pakrashi, Franck Schoefs. Texture Analysis based
Detec-tion and ClassificaDetec-tion of Surface Features on Ageing Infrastructure Elements. BCRI2012 Bridge &
Concrete Research in Ireland, 2012, Cork, Ireland. �hal-01009012�
ABSTRACT: This paper presents a texture analysis based approach for the detection of damaged regions on the surface of infrastructural elements. A k-means clustering algorithm was used to partition regions with similar textural properties. Four texture measures were derived from a Grey Level Co-occurrence Matrix (GLCM) namely; contrast, homogeneity, entropy and Angular Second Moment (ASM). The approach is validated successfully on an image of a damaged concrete bridge beam. The performance of this Non-Destructive Testing (NDT) technique is evaluated for various values of k through the use of performance points in the Receiver Operating Characteristic (ROC) space. The technique may be deployed as a Structural Health Monitoring (SHM) tool to track the extent of surface damage, and can used in a Bridge Management System (BMS) to aid structured decision making and scheduling of repair work.
KEY WORDS: Damage Detection, Image Processing, Texture Analysis, Grey Level Co-occurrence Matrix (GLCM),
k-means Clustering, Bridge Management Systems (BMS). 1 INTRODUCTION
Bridges may be subjected to numerous forms of damage during their service life. The damage may include cracking, corrosion of reinforcement bars, leaching, rust spotting, spalling, honeycombing, collision damage, efflorescence, wear etc. [1].With this in mind, regular inspections of the integrity of structures are vital to ensure they remain safe and fit for purpose. Currently, many structures are assessed under a regime of visual inspections of varying scope; from a cursory check for gross defects, to a close examination of all surfaces, including the use of special equipment if necessary. The quality of data collected often depends on the ability of the inspectors to observe and objectively record details of damage. The damage is usually described and archived qualitatively by the inspector, with appropriate photographs attached as evidence behind the qualitative comments. An attempt to quantify the severity of the damage is generally made at this stage through the use of a numerical scale. The scales typically range over a limited number of categories (e.g. 5 levels), leading to some degree of uncertainty and vagueness. The use of numerical scales, though helpful for relative ranking and prioritising, does not lend itself to be integrated with future quantitative analyses or experiments and repair options as this level are usually based on qualitative comments based on personal expertise. The output from visual inspections can markedly vary and can have a lower level of
accuracy and repeatability of detection compared to other inspection methods [2]. An image processing based detection approach acts as a relatively inexpensive tool to facilitate maintenance management and can offer a greater reproducible and measurable performance over visual inspection techniques [3]. Image processing based techniques have received significant attention in many other fields. However, they are yet to be explored to their full potential in the area of Structural Health Monitoring (SHM).
Image based analysis is a form of Non-destructive testing (NDT), which can provide useful information on the state of the structure [4]. This in turn may be fed into a Bridge Management System (BMS). The output from the BMS can help in the planning of long-term repair strategies and enable informed decisions to be made when prioritising resources towards the correction of deficiencies. Furthermore, information acquired from NDT techniques increase understanding of defect initiation and propagation and provide a solid foundation for improving ageing laws for real structures or for updating existing models to predict the behaviour of a particular structure and thus achieve a more reliable and suitable management strategy. This aspect has attracted a growing interest in recent years as the importance of life cycle optimisation and the related financial benefits continue to be recognised [5, 6]. An important aspect of managing a bridge is having a means to determine the current health of bridge elements based on past inspection data. An image processing approach caters for this as captured images can be archived for assessment of degradation over time, thereby enabling the rate of propagation of damage to be estimated. Image processing techniques are particularly relevant to bridge monitoring as there are typically large sections that are largely inaccessible to close-up visual inspections and other NDT techniques. From an image processing perspective, the images can be acquired from a relatively far distance from the surface under consideration thereby minimising road user delay costs, minimising inspection time and cost related to access equipment, improving safety aspects of the inspection process, and keeping the structure in operation. There exists a broad range of NDT techniques used to asses structural integrity such as ultrasonic scanning [7], acoustic emission techniques and eddy current testing [8]. The most suitable choice of NDT for a given application will largely depend on the damage to be detected and will require an in-depth knowledge of the advantages and limitations associated with each option. The measure of the on-site performance of a NDT tool is still an
Texture Analysis based Detection and Classification of Surface Features on Ageing
Infrastructure Elements
Michael O'Byrne 1, Bidisha Ghosh2, Vikram Pakrashi 3, Franck Schoefs4
1,2
Trinity College Dublin, Department of Civil, Structural and Environmental Engineering, Dublin 1, Ireland
3
University College Cork, Department of Civil and Environmental Engineering, College Road, Cork, Ireland
4
LUNAM Université, Université de Nantes-Ecole Centrale de Nantes-CNRS, GeM, Institute for Research in Civil and Mechanical Engineering, UMR 6183& IXEAD/CAPACITES Scociety, University of Nantes 2, rue de la Houssinière BP
92208 44322 Nantes Cedex 3, France
pertinent question in many cases [9]. Image processing based techniques, in conjunction with powerful detection algorithms, can be considered as an accessible, inexpensive, and easily deployable technique for visual inspection. The primary limitations of this approach are the lack of penetration below the surface of the material and the requirement of good visibility and lighting conditions. Previous image processing based methods have relied on colour information [10, 11], textural information [12], or a combination of the two (Wu and Tsai, 2006) to segment and extract regions of interest in images.
Texture and colour based segmentation approaches are the primary modes of segmentation employed for image analysis. While both approaches have important applications in image processing methods, the colour based methods have been researched to a much greater extent. Texture may be considered as an innate property of surfaces. It may be qualified by terms such as fine, coarse, smooth, rippled, molled, irregular, or lineated [13]. Texture segmentation finds particular relevance in cases where the regions of interest are more separable from the background based on their texture than colour. There are numerous texture based image segmentation techniques. Such techniques include wavelet analysis [14], Laws’ texture energy [15] and Grey Level Co-occurrence Matrix (GLCM) [16]. This paper presents an enhanced texture based detection technique involving GLCM. GLCM is a well established texture analysis method and offers a highly accurate approach for quantifying the perceived texture in an image. k-means clustering is subsequently used to partition regions of similar texture features together. GLCM had been used previously in conjunction with k-means classification on magnetic resonance images [17], however their algorithm used a different set of statistics. It is felt that the four statistics used in the proposed technique provide a well-rounded description of the texture in the image whilst offsetting unnecessary computational time that would result from the inclusion of additional statistics that would only contribute to a minimal increase in accuracy of detection.
The methodology of the proposed technique is detailed in the following section. The technique is applied to an image of a concrete bridge beam featuring cracking to concrete and exposed reinforcement. The successful application of the method is presented and the performance of the technique is evaluated.
2 METHODOLOGY
A semi-automatic image based damage detection algorithm is proposed in this paper. The algorithm involves two steps; the first step is using a GLCM to develop to a texture characteristics map of an image of a damaged surface. The image is in a greyscale form which is represented by a single numerical array, or plane, that is populated by pixel intensity values. Typical ranges for intensity values are 0 to 255, or 0 to 1. Black is represented by 0 in both cases while white is denoted by 255 and 1 respectively. Values within this range represent intermediate shades of grey. The second step in the algorithm is to partition the damaged regions in the image
using k-means clustering. These two steps are discussed in detail in the following subsections.
2.1 Texture Characteristics Map
A texture characteristics feature vector {
v
f}a,b has to begenerated for each pixel within the original image, I, where f indicates the index of the vector element, while a and b indicate the spatial coordinates of a pixel. The GLCM is a matrix of frequency values that combinations of pixel intensities appear in some specific spatial arrangement within an image or sub-image. In this paper, the GLCM is generated for a sub-image that is attained through a sliding window, SW, of size N-pixel x N-pixel with centre positioned at (a,b) at any stage of the convolution throughout the overall image. There are four texture features calculated from the GLCM, namely: homogeneity, contrast, entropy and Angular Second Moment (ASM). Some of these features relate to certain texture characteristics in the image such as homogeneity or contrast. Other features describe aspects such as image complexity or the transition of pixel intensity values. However, in spite of each of the aforementioned features containing some degree of information about the texture characteristics of the image, it is difficult to establish which textural trait is represented by each feature.
Each entry in the GLCM corresponds to the number of occurrences of a pair of grey levels (i,j,d,θ) in the sliding window, where i denotes the grey level in the reference pixel,
j denotes the grey level in the destination pixel, d is the interpixel distance and θ is the angle of offset between neighbouring pixels. Both i and j can take integer values between 1 and G, where G is the total number of grey levels. The grey levels are defined on a scale of 1 - 12 instead of a typical scale of 1 - 255. Quantisizing in this manner promotes computational parsimony and avoids sparse matrices. Pixel combinations that are close together tend to be more relevant than pixel combinations that are far away from each other in terms of interpixel distances. With this in mind, a value of 1 was chosen as the interpixel distance (i.e. only combinations of pixels which shared a corner or had a shared edge were counted). This allowed for an algorithm that considered a significant amount of useful information whilst minimising complexity and computing time. Four angles for the offset were chosen: θ = 0°, θ = 45°, θ = 90°, θ = 135°. The GLCM is calculated for each of the four offsets for each position of the sliding window. The GLCM is populated as per equation 1.
2 1 1
1
( , , , )
if
( , )
1
and
(
,
)
where
0
otherwise
N N u v x yP i j d
A
N
SW u v
i
SW u
d v
d
j
A
θ
= ==
=
+
+
=
=
∑ ∑
(1)
(2)
where dx and dy are the horizontal and vertical offsets between neighbouring pixels in the sliding window which are dependent on d and θ, and SW(u,v) gives the quantized pixel intensity value at the spatial coordinates u and v in the window.
An important prerequisite to the process of generating statistics from the GLCM is to normalise the matrix which is achieved through:
( , , , )
( , , , )
P i j d
p i j d
R
θ
θ
=
(3)
where R represents the total number of grey level pairs (i,j) for a given (d, θ) pair within the window. This normalised GLCM was used to calculate four values for each of the four texture measures corresponding to the four offset angles. As it is not known which angle of offset provides the most meaningful value for each texture measure, the average of the four texture measures was calculated and assigned to the texture measure in question, as per equation 4.
,
( )
where = {0 ,45 ,90 ,135 }
f fv
v
length
θ θ=
Θ
Θ
∑
o o o o(4)
The following features were determined from the GLCM:
1. Homogeneity gives a measure of the similarity in the image.
i-j
n
j
i
p
n
Hom
G i G j=
⋅
=
∑ ∑
= =where
)
,
(
1 1 (5)Hom ranges from 0 to G-1. A value of 0 indicates a strong similarity in the image.
2. Contrast is a measure of the local variations present in an image. If there is a high amount of variation the contrast will be high.
=
∑
∑ ∑
= = − = G i G j G nj
i
p
n
Con
1 1 1 0 2)
,
(
(6)Con ranges from 0 to (G-1)2. A value of 0 indicates a constant image.
3. Entropy is a statistical measure of randomness.
∑ ∑
= =−
=
G i G jj
i
p
j
i
p
e
1 1 2)
,
(
log
)
,
(
(7)e ranges from 0 to infinity.
4. Angular Second Moment (ASM) represents the uniformity of distribution of grey level in the image.
{
}
∑ ∑
= ==
G i G jj
i
p
ASM
1 1 2)
,
(
(8)ASM ranges from 1/G2 to 1. A value of 1 indicates a constant image.
2.2 k- means Clustering
The k-means clustering algorithm partitions N observations into k clusters in which each observation belongs to the cluster
with the nearest cluster centre by iteratively minimizing the squared sum of a computed norm from each observation to its cluster centre, over all clusters. The result is a set of clusters that are as compact and well-separated as possible.
For a Euclidean norm, the overall objective function,
J
is minimized as 2 1 1 ˆ ˆ∑ ∑
= =−
=
k j N l c l cA
A
J
(9)where
A −
lA
ˆc 2is the distance measure between a data point Al and the cluster centre Aĉ, is an indicator of the distance of the Nĉ data points from their respective cluster centres. An optimum value of k can generally be attained by considering the level of detail or precision required. For a higher k value, there will be a stronger correlation between pixels within each cluster. This is advantageous if one wishes to reduce the rate of misclassification. An ROC based optimization framework is explored in Section 3, where different k values are tested in an attempt to determine which produces the best outcome.A schematic of the methodology is presented in Figure 1.
Figure 1. Flow chart of the proposed methodology.
3 EVALUATION OF TECHNIQUE
The proposed technique was performed on an image of exposed reinforcement on an outer bridge beam (Figure 2).
Figure 2. Sample Image of a Damaged Bridge Beam.
Various k values were used in the k-means clustering stage; ranging from 2 to 5. The detected regions using the proposed technique for each value of k are presented in Figure 3.
Figure 3. Detected Regions for Various Values of k. The performance of the texture analysis based detection in conjunction with the k-means clustering for various values of
k is evaluated by plotting performance points in the Receiver Operating Characteristic (ROC) space. The ROC space provides a common and convenient tool for graphically characterising the performance of NDT techniques and its usage has recently been extended to image detection [18]]. A box counting approach similar to the procedure described in [19] was employed to calculate the Detection Rate (DR) and Misclassification Rate (MCR) for each image. This involved visually segmenting the images and comparing them with the
k-means clustered images.
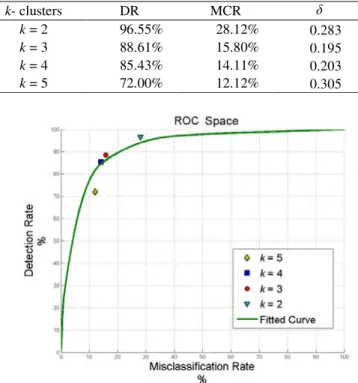
Figure 4. Visually Identified Damaged Region. The DR and the MCR provide the coordinates for a point in the ROC space, which allows for a graphical illustration of the performance of the technique. A convenient way of ranking and analysing the performance of points in the ROC space is by means of the alpha-delta method [20, 21]. Essentially, this method relies on calculating the angle, α, and the Euclidean distance, δ, between the best performance point (coordinates (0,100%)) and the considered point to give a measure of the performance of the considered point. For this situation only the delta, δ, parameter is required. A low value for δ is indicative of a strong performing technique. The detection and misclassification rates, along with the δ value, are summarized in Table 1 and the corresponding coordinate points are shown in the ROC space in Figure 5. A fitted curve is also shown for illustration purposes.
Table 1 - Performance of the Proposed Technique.
k- clusters DR MCR δ
k = 2 96.55% 28.12% 0.283
k = 3 88.61% 15.80% 0.195
k = 4 85.43% 14.11% 0.203
k = 5 72.00% 12.12% 0.305
Figure 5. Performance Points in the ROC Space for the Proposed Technique.
The proposed technique performed well at defining the outer shape and size of the damaged region. However, as the value of k is increased, the detected regions become less homogenous with a greater prominence of undetected regions contained within the greater damaged area. It may be noted from the Figure 5 that when k is equal to either 3 or 4, a high performance level is achieved. The value of 3 for k is slightly better as evident from the lower value of δ. There is a relatively low detection rate in the case when k is equal to 5, while the converse is true for when k is equal to 2, i.e. there is a relatively high misclassification rate. As a result, relatively large values of δ accompany both of these cases.
A significant proportion of the misclassification rate may be attributed to the small spurious regions that are frequently included in the cluster corresponding to the damaged region. A simple way of reducing the misclassification rate without any significant reduction in the detection rate would be to apply an additional algorithm that removes these isolated regions that are below a certain area.
The result from performing k-means clustering directly on the colour image to group regions with similar pixel intensity values is graphically illustrated in Figure 6.
Figure 6. Image Clustered Based on the Pixel Intensity Values
It may be observed that this approach produced extremely poor results, so much so that it is not even apparent which cluster predominantly corresponds to the damaged region. This comparison highlights the usefulness of texture analysis on images featuring damaged regions that are more separable based on their textural characteristics rather than colour information. In this case the image was partitioned into 3 clusters; however other values of k performed to a similar level.
4 CONCLUSION
A texture based image processing technique to detect damage on the surface of bridge elements has been proposed. Although popular in other fields, image processing techniques have received little attention in the field of Structural Health Monitoring (SHM). Their potential as a tool that could be employed in a Building Management System (BMS) has been outlined. As a case study, the proposed technique was
successfully applied to an image of a damaged concrete bridge beam. The statistics derived from the Grey Level Co-occurrence Matrix (GLCM) were found to be effective at describing the perceived texture in the image, while the k-means clustering demonstrated a strong ability at grouping texture features corresponding to damaged regions for a range of k values. The ROC space was employed as a tool to evaluate the performance of the technique and as a means to obtain an optimum value of the k parameter to maximise the detection accuracy of the algorithm.
ACKNOWLEDGMENTS
The authors wish to thank the Irish Research Council for Science, Engineering and Technology (IRCSET) for providing a grant to support this research and CAPACITES/IXEAD society for the practical and financial assistance.
REFERENCES
[1] 1. Tarighat, A. and A. Miyamoto, Fuzzy concrete bridge deck
condition rating method for practical bridge management system.
Expert Systems with Applications, 2009. 36(10): p. 12077-12085. [2] 2. Agin, G.J., Computer Vision Systems for Industrial Inspection and
Assembly. Computer, 1980. 13(5): p. 11-20.
[3] 3. Gallwey, T.J. and C.G. Drury, Task Complexity in Visual
Inspection. Human Factors: The Journal of the Human Factors and Ergonomics Society, 1986. 28(5): p. 595-606.
[4] 4. Sinha, S.K., P.W. Fieguth, and M.A. Polak, Computer vision
techniques for automatic structural assessment of underground pipes. Computer-Aided Civil and Infrastructure Engineering, 2003. 18(2): p. 95-112.
[5] 5. Sarma, K.C. and H. Adeli, Cost optimization of concrete
structures. Journal of structural engineering New York, N.Y., 1998. 124(5): p. 570-578.
[6] 6. Sirca Jr, G.F. and H. Adeli, Cost optimization of prestressed
concrete bridges. Journal of Structural Engineering, 2005. 131(3): p. 380-388.
[7] 7. Iyer, S.R., S.K. Sinha, and A.J. Schokker, - Ultrasonic C-Scan
Imaging of Post-Tensioned Concrete Bridge Structures for Detection of Corrosion and Voids. 2005. - 20(- 2): p. - 94. [8] 8. Yusa, N., et al., Detection of embedded fatigue cracks in Inconel
weld overlay and the evaluation of the minimum thickness of the weld overlay using eddy current testing. Nuclear Engineering and Design, 2006. 236(18): p. 1852-1859.
[9] 9. Schoefs, F., Abraham, O., Popovics, J. , Quantitative evaluation of
NDT method performance: application example based on contactless impact echo measurements for void detection in tendon duct. Construction and Building Materials (CBM), 2012a(Special Issue ‘NDT’).
[10] 10. Iyer, S. and S.K. Sinha, - Segmentation of Pipe Images for Crack
Detection in Buried Sewers. 2006. - 21(- 6): p. - 410.
[11] 11. Tsai, Y. and Y. Huang, - Automatic Detection of Deficient Video
Log Images Using a Histogram Equity Index and an Adaptive Gaussian Mixture Model. 2010. - 25(- 7): p. - 493.
[12] 12. Cord, A. and S. Chambon, - Automatic Road Defect Detection by
Textural Pattern Recognition Based on AdaBoost. 2011: p. - no. [13] 13. Haralick, R.M., K. Shanmugam, and I.H. Dinstein, Textural
Features for Image Classification. Systems, Man and Cybernetics, IEEE Transactions on, 1973. 3(6): p. 610-621.
[14] 14. Lu, C.S., P.C. Chung, and C.F. Chen, Unsupervised texture
segmentation via wavelet transform. Pattern Recognition, 1997.
30(5): p. 729-742.
[15] 15. Choi, B., et al. Human body parts candidate segmentation using
laws texture energy measures with skin color. in 13th
International Conference on Advanced Communication Technology: Smart Service Innovation through Mobile
Interactivity, ICACT 2011, February 13, 2011 - February 16, 2011. 2011. Gangwon-Do, Korea, Republic of: Institute of Electrical and Electronics Engineers Inc.
[16] 16. Gadelmawla, E.S., A vision system for surface roughness
characterization using the gray level co-occurrence matrix. NDT and E International, 2004. 37(7): p. 577-588.
[17] 17. Bastos, L.D.O., P. Liatsis, and A. Conci. Automatic texture
segmentation based on k-means clustering and efficient calculation of co-occurrence features. in 15th International
Conference on Systems, Signals and Image Processing, IWSSIP 2008, June 25, 2008 - June 28, 2008. 2008. Bratislava, Slovakia: Inst. of Elec. and Elec. Eng. Computer Society.
[18] 18. Pakrashi, V., et al., ROC dependent event isolation method for
image processing based assessment of corroded harbour structures. Structure and Infrastructure Engineering, 2010. 6(3): p. 365-378.
[19] 19. O'Byrne, M., et al., Receiver Operating Characteristics of a
Modified Edge Detection for Corrosion Classification, in Forum
Bauinformatik 23rd European Conference2011: Cork, Ireland. [20] 20. Schoefs F., B.J., Clément A., Capra B. , The αδ method for
modelling expert Judgment and combination of NDT tools in RBI context: application to Marine Structures, Structure and Infrastructure Engineering: Maintenance, Management, Life-Cycle Design and performance (NSIE). SMonitoring, Modeling and Assessment of Structural Deterioration in Marine Environments, 2012b. 8(Special Issue): p. 531-543.
[21] 21. Baroth, J., D. Breysse, and F. Schoefs, Construction Reliability, ed. I. Ltd2011: Wiley.