Development of a Platform for Sensing Cellular
Electrical Activity Using Nitrogen Vacancy Centers
in Nanodiamonds
by
Anubhav Sinha
S.B., EECS and Chemistry, Massachusetts Institute of Technology
(2014)
Submitted to the Department of Electrical Engineering and Computer
Science
in partial fulfillment of the requirements for the degree of
Master of Engineering in Electrical Engineering and Computer Science
at the MASSACH
OF 1
MASSACHUSETTS INSTITUTE OF TECHNOLOGY
7
September 2015
@
Anubhav Sinha, MMXV. All rights reserved. LI The author hereby grants to MIT permission to reproduce and to distribute publicly paper and electronic copies of this thesis documentin whole or in part in any medium now known or hereafter created.
USETTS INSTITUTE JQCHNQLOGY L 1 9 016
RARIES
ARCHIVES
Signature redacted
A uthor ...
o...
Department of Electrical Engineering and Computer
Science
Certified by.
Signature redacted
September 8, 2015
Prof. Dirk R. Englund
Jamieson ar" r Development Assistant Professor
Accepted by ..
Signature redacted
Thesis Supervisor
Dr. Christopher J. Terman
Chairman, Masters of Engineering Thesis Committee
77 Massachusetts Avenue Cambridge, MA 02139 http://Iibraries.mit.edu/ask
MITLibraries
DISCLAIMER NOTICE
Due to the condition of the original material, there are unavoidable flaws in this reproduction. We have made every effort possible to provide you with the best copy available.
Thank you.
Thesis contains pages with copy/printer ink
markings.
Development of a Platform for Sensing Cellular Electrical
Activity Using Nitrogen Vacancy Centers in Nanodiamonds
by
Anubhav Sinha
Submitted to the Department of Electrical Engineering and Computer Science on September 8, 2015, in partial fulfillment of the
requirements for the degree of
Master of Engineering in Electrical Engineering and Computer Science
Abstract
The nitrogen vacancy center (NV) in diamond hosts unique optical properties that allows it to be used for sensing magnetic fields, electric fields, and temperature. In addition, the photostability of the NV center and the biocompatibility of diamond suggests the utility of the NV center for biosensing. The dependence of the charge state of the NV center on the local electrochemical environment suggests that the NV center could be used as an optical sensor for electrophysiology.
In this thesis, a platform to evaluate the utility of the NV center for voltage sensing is established. First, an electrophysiology setup is built and characterized on HEK293 cells. The setup adds functionality to a home built microscope so that cells can be electrically controlled while simultaneously observing the fluorescence. Second, the staining of neurons with hydrogen-terminated nanodiamonds (NDs) with NV centers is improved. Together, the improved staining of neurons with nanodiamonds along with using the electrophysiology setup to observe modulation forms a platform for future study of the NV center as a voltage sensor.
Thesis Supervisor: Prof. Dirk R. Englund
Acknowledgments
I would like to express my sincere gratitude to Professor Dirk Englund for all of his guidance and support throughout my time in the lab.
I would especially like to thank Sinan Karaveli for his extensive mentorship
through-out my project. I would also like to thank the rest of the Quantum Photonics Labo-ratory for all of their help both inside and out of the lab.
My project has been a highly collaborative one and I am extremely grateful for
having had great collaborators in the Boyden Lab. I am especially grateful to Or Shemesh for hands-on help with all aspects of my project.
Finally, I would like to thank my parents for their unyielding love and support.
A
Contents
1 Introduction 17
2 Electrophysiology theory and current sensing methods 21
2.1 Cellular electrophysiology . . . . 21
2.2 Current electrophysiology methods . . . . 25
2.2.1 Electrical m ethods . . . . 25
2.2.2 Optical m ethods . . . . 27
2.2.3 Actuation and all-optical electrophysiology . . . . 31
3 The nitrogen vacancy center in diamond and its potential as a volt-age sensor 33 3.1 Electronic structure of the NV center . . . . 33
3.2 Sensing using the NV center . . . . 37
3.3 Biological applications of NV centers . . . . 40
3.4 Towards voltage sensing with NV centers . . . . 41
4 Electrophysiology setup design and measurements 43 4.1 Building the electrophysiology setup . . . . 43
4.1.1 Existing microscope setup . . . . 43
4.1.2 Setup of electrophysiology electronics . . . . 44
4.1.3 Pipette holder and micropipette preparation . . . . 45
4.2 Electrophysiology experiments on HEK cells . . . . 46
4.2.1 Sample preparation . . . . 47
7
4.2.2 Patch clamp recordings . . . . 49
4.3 M odel experim ent . . . . 51
5 Improved labeling of neurons and HEK293 cells with hydrogenated nanodiamonds 57 5.1 Labeling cells with 16 nm nanodiamonds . . . . 58
5.1.1 Micellation of 16 nm nanodiamonds . . . . 58
5.1.2 Staining HEK cells with 16 nm nanodiamond micelles . . . . . 59
5.1.3 Repeated micellation and characterization . . . . 59
5.1.4 Staining of neurons with 16 nm nanodiamonds . . . . 60
5.2 Labeling neurons with 25 nm nanodiamonds . . . . 62
5.2.1 Characterization of 25 nm hydrogenated nanodiamonds . . . . 62
5.2.2 Micellation and optimization of staining conditions . . . . 63
5.2.3 Imaging of live neurons . . . . 64
5.3 Summary of micellation experiments . . . . 66
List of Figures
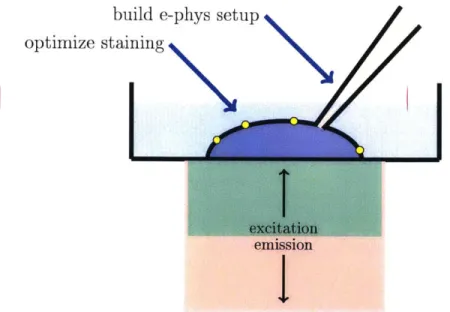
1-1 A schematic describing the specific work presented in this thesis within
the overall platform. A cell has been stained with nanodiamonds (shown in yellow) and has been patch clamped (pipette shown in or-ange). The fluorescence from the nanodiamonds is recorded and is analyzed with the voltage measurements in order to determine the voltage-sensing ability of the NV center. . . . . 19
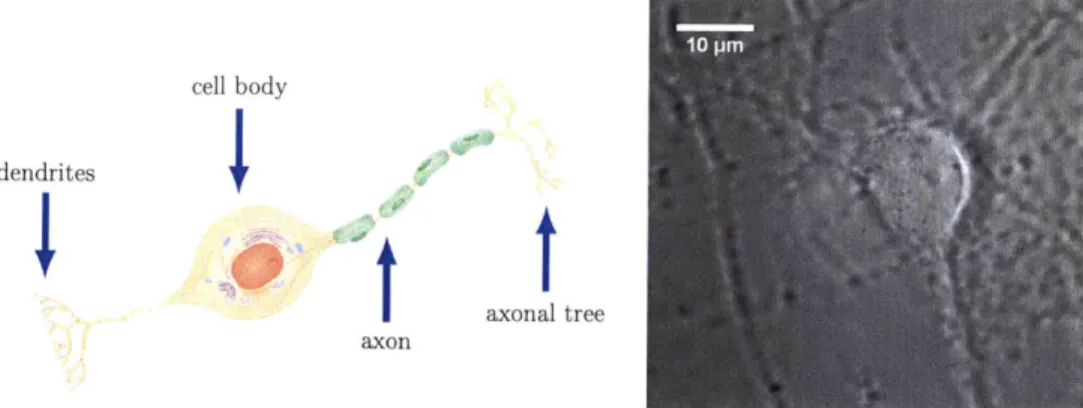
2-1 Left. The most significant anatomical features of a neuron are
high-lighted on this cartoon. Information arrives at the dendrites, is inte-grated at the cell body, is propagated down the axon, and is trans-mitted through the axonal tree. Figure adopted from [26]. Right. Bright-field image of a neuron taken with 100x magnification. .... 22
2-2 The Na+/K+ pump and leakage channels are constantly functional. When the membrane is at the resting potential, the voltage-gated chan-nels are closed. Under membrane depolarization, the sodium influx channel opens first. After the membrane has sufficiently depolarized, the sodium influx channels become inactivated and the potassium chan-nels open, beginning repolarization. Hyperpolarization is caused by the opening of additional potassium channels 127]. . . . . 23
2-3 The four stages of the action potential are shown. Stage 1: initial
membrane depolarization up to the threshold potential. Stage 2: rapid membrane depolarization due to Na+ influx. Stage 3: Membrane re-polarization due to K+ efflux. Stage 4: Membrane hyperre-polarization. Figure generated using NEURON software [29]. . . . . 24 2-4 The major classes of techniques used to detect neuronal activity in
culture are shown above. Blue boxes denote approaches and red boxes represent methods 191 1811 301. . . . . 25 2-5 The geometry of the pipette and cell for various cellular recording
modalities are shown. In each geometry, there is one electrode (com-monly Ag/AgCl) inside the micropipette and another ground electrode inside the bath. . . . . 26
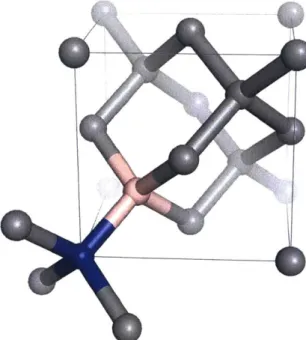
3-1 Example structure of the NV center within the diamond lattice. The substitutional nitrogen atom is shown in blue and the vacancy is shown in pink. . . . . 34
3-2 Schematic energy level diagram of the electronic structure of the
NV-center. Important transitions are also shown. Based on [52] [23]. . . 35 3-3 NV- and NV0 fluorescence emission spectra in high pressure high
tem-perature nanodiamonds at room temtem-perature. Image adopted from [24]. . . . . 3 5
3-4 Energy level diagram of the electronic structure of the NVO center [52]. 37 3-5 A. Three representative fluorescence time traces of hydroxylated NDs
subject to the voltage trace shown. B. Histogram of the average max-imal fluorescence contrast percent for hydroxylated NDs. C. Repre-sentative fluorescence time traces of hydrogenated NDs subject to the voltage trace shown. D. Histogram of the average maximal fluores-cence contrast percent for hydrogenated NDs. Figure adapted from
3-6 A. Fluorescence time trace of two hydroxylated NDs in response to 100 mV square wave pulses. B. Fluorescence time-trace of a cluster
of hydrogenated NDs to 100 mV square wave pulses of duration 5 ms. Figure adopted from [24]. C. Fluorescence time traces of multiple
clusters of NDs integrated together in response to 20 mV pulses. . . 40
4-1 A simplified schematic of the microscope is shown. For wide field imaging, a 532 nm laser (for wide field excitation) enters the microscope and is reflected by a dichroic mirror to the sample. The fluorescence is collected and imaged onto an emCCD camera. For confocal imaging, the excitation is provided by the galvanometer scanning confocal add-on. After reflection onto the sample and collection of the emission, the emitted light is spectrally filtered and coupled to a single-mode fiber (not shown). Figure modified and used with permission from Sinan K araveli. . . . . 44
4-2 Representative images are shown for the left and right pipettes pulled from the thick capilary glass. For the thin glass, only a single pipette is pulled per capilary glass. . . . . 47
4-3 The major additions to the setup for electrophysiology are shown. The optics remain unchanged. Cells for electrophysiology are cultured on glass bottom petri plates for imaging. The ground electrode is secured in the bath. The micropipette is partially filled with intracellular so-lution (ICS) and the chlorided part of the pipette wire electrode is in contact with the ICS. A length of silicone tubing is connected to the pipette holder for buccal pressure manipulation. The pipette holder, headstage, micromanipulator, and mounting platform are connected as show n . . . . . 48
4-4 Top. Bright-field image of patch clamped HEK cell. Center. Current clamp experiment protocol for current injection. 2000 pA pulses were injected for 200 ms periodically. Bottom. The membrane voltage response to the current injection. . . . . 50
4-5 Top. Bright-field image of patch clamped HEK cell used for voltage clamp experiments. Center. The VC experiment stepped from -150 mV to +150 mV in 50 mV steps. The duration of the pulse lasted 200 ms. Bottom. The resulting currents needed in order to maintain the membrane potential. Note that no compensation was set on the amplifier, so capacitive transients remain. . . . . 52
4-6 Left. Fluorescence image with additional bright-field illumination of the patch clamped HEK cell with NVs added to the solution. Right. Fluorescence image with no bright-field illumination. . . . . 53
4-7 Top. The membrane voltage and fluorescence intensity from the NV center on the cell are plotted together on the same time axis. Bottom. The logarithm of the Fourier Transform for the intensity is shown. 55
4-8 The fluorescence intensity for the full duration recording is shown. 56 5-1 Left. Representative HEK cell stained with micelles containing
PEG350-PE. Sample imaged using 100x oil immersion objective. Mixed bright-field illumination with fluorescence excitation image shown. Right. HEK cells stained with PEG5000-PE-containing micelles. Sample im-aged with 63x oil immersion objective. . . . . 59 5-2 HEK cell imaged after staining with improved PEG5000-PE containing
micelles. Left. Bright-field and laser illumination. Right. Fluores-cence only. . . . . 60 5-3 Fluorescence images of neurons stained with nanodiamond
contain-ing micelles. Left. DOTAP-only micelles. Center. Micelles with
PEG2000-PE and DOTAP. Right. Micelles with PEG5000-PE and
5-4 Reprentative confocal image and spectrum of an NV center labeling a neuron. ... ... 61 5-5 Upper Left. A wide-field image of the nanodiamonds is shown. Laser
excitation power was 70 mW and the sample was imaged through the 100x oil immersion objective. Four NVs are highlighted in red. Upper
Right. A confocal image of the nanodiamonds is shown. The color
bar is the number of counts from the APD and the x-y axes are in microns. The four spots from the wide-field image are highlighted in this figure. Confocal scans were taken with 200 [tW of power with a
dwell time of 2 ms. Bottom. Spectra from the labeled points. . . 62
5-6 The staining efficiency is shown for representative cells for the IX
mi-celles in Plating Medium and in Tyrode solution. In plating medium, there are nine bright spots on various z-planes for that cell (two shown). For the staining carried out in Tyrode solution, there are five bright spots on several z-planes for the cell. Overall, staining in plating medium led to more NVs per cell. . . . . 64
5-7 Wide-field and fluorescence images of a cell stained using the optimal
protocol that exhibited poor staining. This image was taken six weeks after the micelles were prepared. . . . . 65 5-8 Bright-field and fluorescence images (Z-projection) are shown for a
List of Tables
2.1 Important ion gradients for electrophysiological phenomena. Adapted from [28]. . . . . 22 4.1 For each glass pipette capillary, the program used to pull pipettes is
shown along with the typical tip size and resistance in solution for an ICS-filled micropipette in a bath of Tyrode's solution. . . . . 46
'a
Chapter 1
Introduction
The functional activity of the nervous system in higher organisms leads to emergent complex behaviors. The connectome, the complete map of neural connections within the brain, provides the "wiring diagram" for information in the form of action po-tentials to be carried and processed [1]. These networks are incredibly complex with about 1011 neurons in the adult human brain and over 10" synapses between neurons. Information processing through this highly interconnected network is responsible for complex processes [1J.
To understand how a complex network of neurons processes information, tools are needed to interrogate the structural connectivity of the neurons as well as the dynamics of action potential propagation through the network [2]. An ideal tool to study a living brain would allow for simultaneous structural identification of neurons at sufficient resolution to resolve synapses (20-40 nm in size) as well as simultaneous detection of electrical activity [3]. Currently, no such methods exist. To study the structure of the connectome, high throughput electron microscopy has been successful but suffers from the limitation of requiring extensive sample processing and fixation
[41 [5]. Super-resolution methods such as STORM/PALM have also shown success in
tracing neural paths and offer the advantage of color multiplexing [6] [7].
The dynamics of single neurons within larger networks has been studied in great detail by intracellular electrode or patch clamp recordings. However, these methods are extremely challenging to scale in order to study an entire network simultaneously
[8]. To study neural networks, sensitive and noninvasive methods that operate at high
spatiotemporal resolution over a large region are needed. The peak of an action poten-tial is extremely brief, lasting 1 ms with voltage depolarization approximately 80-100 mV above the resting potential [9]. To capture these events, a reporter/detector sys-tem must be sufficiently sensitive to detect the action potential and report it at a frequency of 1 kHz. Such a method must also be able to discern action potentials between different neurons that are spatially close together. The invasiveness of a detection modality is an important factor affecting its scalability for studying a large ensemble of neurons [9]. Methods that are minimally toxic allow for longer recordings to be taken. The need to genetically engineer an organism or cell line is also a related metric of invasiveness.
Two main classes of methods are commonly used to make neuronal recordings: electrical and optical methods. Current electrical methods suffer from limitations in their scalability while most optical methods suffer from photobleaching, cytotoxicity, and limited spatiotemporal resolution.
The optical properties of the negatively charged nitrogen-vacancy center (NV-center) center, a crystallographic defect in diamond, have been extensively studied for applications in quantum information science and nanoscale sensing [10] [11] [12]. The NV- center has emerged as a highly sensitive nanoscale sensor for magnetic fields
[13] [14] [15], electric fields [16] [17], and temperature [18], among other properties.
Diamond is also a potentially biocompatible material that is minimally cytotoxic
[19] [20]. Together, the sensing properties of diamond and its biocompatibility have
aroused great interest in using the NV center for all-optical detection of neuronal action potentials [21] [22] [23].
In this thesis, a platform is developed to evaluate the utility of the NV center within nanodiamonds (NDs) for this purpose. Recent work has shown that NV centers within NDs modulate their charge state in response to an applied voltage [24]. This charge state switching is optically detectable as a change in fluorescence intensity when passed through a 650 nm longpass filter. Hydrogenated nanodiamonds have been shown to exhibit particularly large fluorescence changes (AF/F), making them
of particular interest [241. In addition to this, a technique for staining neurons with nanodianonds has been recently developed 1251.
For characterization of the NV center for sensing purposes., full electrical control of single cells labeled with NDs containing NV centers is needed while imaging changes in the the NV center fluorescence. To be able to carry out such aii experiment, we developed two concurrent approaches. The first is building an electrophysiology rig around an existing homebuilt microscope and the second is effectively delivering the nanodliamonds of interest to the neurons.
In Chapter 2, fundamentals of electrophysiology and current state of the art tech-niques for sensing action potentials are outlined. In Chapter 3, the photophysics of the NV center are described. Chapter 4 details the design and characterization of the electrophysiology rig that was built. Chapter 5 describes the optimization and characterization of the neuronal labeling process. Chapter 6 summarizes the work and provides an outlook for future work. Figure 1-1 relates the work presented in Chapters 4 and 5 to the overall platform.
build e-phys setup optimize staining
excitation
emlission
I
Figure 1-1: A schematic describing the specific work presented in this thesis within the overall platform. A cell has been stained with nanodiamonds (shown in yellow) and has been patch clamped (pipette shown in orange). The fluorescence from the nanodiamonds is recorded and is analyzed with the voltage measurements in order to determine the voltage-sensing ability of the NV center.
Chapter 2
Electrophysiology theory and current
sensing methods
Electrophysiology encompasses a diverse set of methods and techniques used to study the electrical properties of cells and tissues. In this section, the fundamentals of neuronal electrophysiology are outlined in Section 2.1 and current methodology is reviewed in Section 2.2.
2.1
CeJlular electrophysiology
Neurons code, transmit, integrate, and decode information in the form of action potentials, localized changes in the electrical membrane potential that propagate along neurons [3]. Most neurons follow an overall architecture for information flow.
A cartoon drawing of a neuron and a brightfield image are shown in Figure 2-1. A chemical signal at one of the dendrites is received and converted into an electrical
signal. The signals from many dendrites are integrated at the cell body. If the total stimulus is strong enough to pass over the axon hillock, a positive-feedback process results in an action potential which is carried down the axon. The electrical signal is converted to a chemical signal at the nerve terminals of the axonal tree and passed on to the dendrites of a downstream cell at a chemical synapse [27].
dendrites
IJ
cel bodY1k
I
axonal tree axonFigure 2-1: Left. The most significant anatomical features of a neuron are high-lighted on this cartoon. Information arrives at the dendrites, is integrated at the cell body, is propagated down the axon, and is transmitted through the axonal tree. Figure adopted from [26]. Right. Bright-field image of a neuron taken with 100x magnification.
environment. Specialized membrane proteins are needed to allow for ion transport to occur. These proteins include ion channels that allow for ion-selective facilitated diffusion through a protein pore in the membrane as well as poreless transporters [271
128]. Of particular relevance for electrophysiology are pumps that carry out active transport of molecules against their electrochemical gradient [27J.
Ion Intracellular concentration (mM) Extracellular concentration
Na+ 5 20 130 -160
IK+ 130-160 4 8
Ca2+ 0.05 - 1 1.2 4
Cl- 1-60 100 140
Table 2.1: Important ion gradients for electrophysiological phenomena. Adapted from [28].
The concentrations and fluxes of ions between the intracellular and extracellular environments result in an electrical potential across the membrane potential [271.
In physiological systems, the most important ions for electrical activity and their typical concentrations are given in Table 2.1 (adapted from [281). There are many transport proteins that are responsible for producing the ion concentration gradient. The Na+ K+-ATPase pump is of particular note and is primarily responsible for the maintenance of the sodium and potassium ion gradients. In addition, there are also Na+, K+, and Cl- leak (hannels (among others) that allow for facilitated diffusion
down the concentration gradients and create leakage currents that are very important in determining the membrane potential
[27].
In the resting potential steady state, there are no net changes of ion concentrations. Every ion in solution has an associated membrane conductance that gives the ease for that species to pass through the membrane, an associated Nernst electrochemical potential from the concentration gradient, and a current density that is carried by the ion as it crosses the membrane
[271.
In addition, there is an active current for each ion as well. A network circuit model can be built from which the membrane current density, membrane conductance, membrane capacitance, and membrane potential can be obtained[27].
In animal neurons, the resting membrane potential is typically in the range of -60 - -70 mV[28].
Figure 2-2 shows the most important transporters and their relative ion fluxes into out of the cell along with the resting potential.Na+ transport O K+ transport
-Extracellular
High Na+; Low K+
Intracellular
Low Na+; High K+
Na+/K+ pump Leakage channels V-gated channels (closed)
Figure 2-2: The Na+/K+ pump and leakage channels a're constantly functional. When the membrane is at the resting potential, the voltage-gated channels are closed. Under membrane depolarization, the sodium influx channel opens first. After the membrane has sufficiently depolarized, the sodium influx channels become inactivated and the potassium channels open, beginning repolarization. Hyperpolarization is caused by the opening of additional potassium channels
[27].
The key phenomena distinguishing the action potential from the resting potential (shown as stage 1 in Figure 2-3) is the fact that the membrane conductance to par-ticular ions in neurons rapidly changes in response to changes in the local voltage. In
neurons, an electrical depolarization that crosses a certain threshold voltage leads to the opening of voltage-gated sodium channels allowing for influx of Na+ that further depolarizes the membrane. As the membrane voltage increases, positive feedback rapidly causes more sodium channels to open, depolarizing the membrane potential to roughly 80-100 mV above the resting membrane potential (stage 2 in Figure 2-3). The sodium gates rapidly inactivate and Na+ is transported out of the membrane. The depolarized membrane potential also causes voltage-gated K+ channels to open, causing an efflux of K+ to exit the cell. This restores the membrane potential towards the resting membrane potential (stage 3). Additional K+ channels open during this phase leading to hyperpolarization of the cell membrane before restoration of the membrane potential to the resting value (stage 4) [28]
[27].
The membrane potential change during the action potential depolarizes the adjacent part of the membrane and propagates the action potential;. hyperpolarization ensures that propagation of the action potential is one-direction[271.
20 E o -20 _ 3 . 0 2 -40 threshold potential E-60 -80 0 2 4 6 8 Time (ms)
Figure 2-3: The four stages of the action potential are shown. Stage 1: initial mem-brane depolarization up to the threshold potential. Stage 2: rapid memmem-brane depo-larization due to Na+ influx. Stage 3: Membrane repodepo-larization due to K+ efflux. Stage 4: Membrane hyperpolarization. Figure generated using NEURON software
2.2
Current electrophysiology methods
Electrical and optical methods are the two primary classes of techniques used to study the dynamics of neuronal systems at cellular resolution
[9].
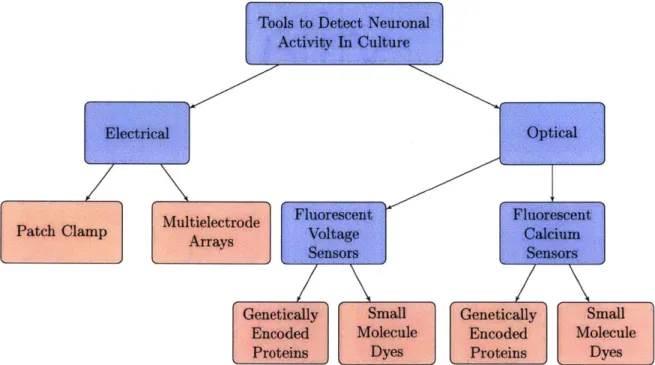
Figure 2-4 summarizes the major methods used in cellular electrophysiology.Tools to Detect Neuronal
Activity In Culture
Electrical Optical
Multielectrode Fluorescent Fluorescent
Patch Clamp ArasVoltage Calcium
Sensors Sensors
Genetically Small Genetically Small
Encoded Molecule Encoded Molecule
Proteins Dyes Proteins Dyes
Figure 2-4: The major classes of techniques used to detect neuronal activity in culture are shown above. Blue boxes denote approach s and red boxes represent methods [9]
[8] [30].
2.2.1
Electrical methods
Electrical methods place electrodes in close proximity to a region of interest and measure the potential between the sample electrode and a reference electrode [27].
Sharp electrode recordings and patch clamp recordings are common for the study
of single cells, both of which utilize a glass micropipette containing a metallic electrode in fluid contact with the intracellular environment of a cell of interest. Sharp-electrode recordings utilize a very sharp tip that can penetrate the membrane and minimally disturb the cellular ionic environment. The patch clamp takes a different approach that brings a micropipette with a large tip ( 1-3 pim) in suction-sealed contact with the
cell. Individual ion channels can be studied in this modality. Additional suction can be applied to rupture the membrane patch, bringing the electrode inside the pipette in direct electrical contact with the solution inside the cell. The pipette solution gradually dialyzes the intracellular solution over the course of several minutes
[28].
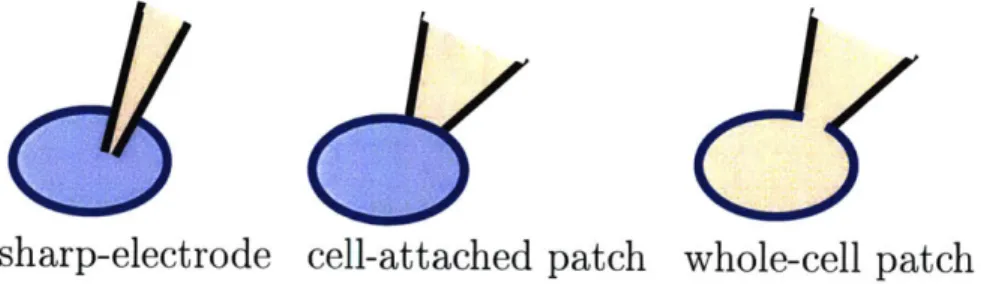
The geometries of these setups are shown in Figure 2-5.
sharp-electrode cell-attached patch whole-cell patch
Figure 2-5: The geometry of the pipette and cell for various cellular recording modal-ities are shown. In each geometry, there is one electrode (commonly Ag/AgCl) inside the micropipette and another ground electrode inside the bath.
Intracellular recordings can be made either in the voltage clamp (VC) mode or the current clamp (IC) mode. In the VC mode, a measurement of the membrane potential is made at some time, compared to a target membrane voltage, and an appropriate amount of current to compensate for the difference is injected into the cell. In this way, the membrane potential is "clamped" to some value. VC experiments allow for the membrane potential to be adjusted independent of the ionic currents, allowing for current-voltage characteristics of the membrane to be studied. Current clamp experiments inject current into the cell and allow the membrane potential to vary. Current clamp experiments allow for the study of the membrane potential in response to electrical stimulation. Together, VC and IC experiments allow for effective characterization of the electrical properties of cells [28].
Recordings from sharp-electrodes and patch clamps provide accurate electrical measurements at very high temporal resolution. They also provide well-localized information about a single cell. However, these methods are very sensitive to physical vibrations and electrical noise. Low-drift micromanipulators and a stable optical setup are needed to minimize physical vibrations and low-noise amplifiers are needed to detect very small currents (on the order of pA). Accordingly, these techniques are
extremely difficult to scale to systems of many neurons [9]. Patch chips, microfluidic devices that break into cells from below through pores, have been used but are limited
by their fabrication process-they cannot be specifically targeted to single cells [31].
Multielectrode arrays (MEAs) are devices containing structured arrays of elec-trodes that are placed in close contact (not intracellularly) to a sample preparation. MEAs are often hundreds to thousands of electrodes in size with micron-scale separa-tion, offering great versatility in the types of experiments that can be run. Simulta-neous stimulation/observation through multiple electrodes can be carried out. They provide high-quality spatial resolution of signals due to the nature of the structured array but relating that information to specific cells is challenging, requiring extensive post-processing and inference [9].
2.2.2
Optical methods
Fluorescent voltage sensors or calcium sensors are the most commonly used optical sensors of cellular electrical activity. These sensors are small molecule dyes or genet-ically encoded proteins that modulate their fluorescent properties as a result of an action potential.
Before escribing specific molecular mechanisms of these sen ors, several universal limitations of dyes should be noted. First, they suffer from photobleaching, signifi-cantly limiting the duration of a recording. For example, the genetically encoded dye ArcLight bleaches on the order of 4.8% per 2 seconds of laser illumination [32]. Sec-ond, dyes are often toxic to cells. In addition to intrinsic toxicity, the photobleaching process of all dyes produces free radicals and reactive oxygen species. High power laser excitation also heats up the sample preparation which is particularly problematic for dim dyes requiring stronger excitation [8]. Third, it can be challenging to target the dyes to the appropriate location. The extracellular matrix and plasma membrane are barriers for external staining by a small molecule dye while protein-based sensors require genetic modification.
The workhorse for testing many of the various voltage or calcium imaging indictors is the Human Embryonic Kidney 293 (HEK) cell line. HEK cells are easy to culture,
easy to genetically modify, and more robust than neurons, thus lending themselves well towards screening applications. However, HEK cells are not an ideal model for neurons. Many voltage sensors show significantly higher changes in their fluorescence in HEK cells compared to neurons. For example, ArcLight shows a 35% AF/F change in fluorescence intensity compared to approximately 3-5% AF/F in neurons
[32]. Despite this challenge, HEK cells remain a useful organism for testing and
engineering sensors. For example, spontaneously spiking HEK cells have been used for electrophysiology-free screening of voltage indicators [33].
Voltage sensors
Voltage-sensitive dyes (VSDs) transduce changes in the membrane potential into changes in the fluorescence emission. There are several significant challenges to this. First, the membrane's electric field is screened by ions in solution. The Debye length in physiological solution is on the order of a nanometer, essentially requiring that voltage-sensors be inside the membrane [8]. This limits the signal as the dye is lim-ited to a two dimensional surface instead of the three dimensional cytosolic volume. The fragility of the membrane to molecular perturbations or intense illumination makes such direct vo tage-sensing challenging [8].
There are several commonly used physical mechanisms of voltage sersitivity for dyes. These include methods that use the voltage to alter the dye molecule's shape or position within the membrane resulting in changes in the emission spectra. Related FRET mechanisms utilize voltage-coupled changes in the relative position of the donor/acceptor molecules to modulate the FRET efficiency. An electrochromic or Stark shift mechanism is another significant method to couple the electric field to the fluorescence [8].
The change in voltage during an action potential can be from 80 - 100 mV over
a membrane thickness of 5 - 10 nm, leading to a high field change on the order of
107 V/M. Many modern small-molecule VSDs are electrochromic dyes that are
engi-neered to respond strongly to the local electric field. These sensors respond quickly to the field since they only rely on charge redistribution instead of conformational
changes [8]. An important examples of a small-molecule electrochromic dye includes the ANNINE-6plus dye [34]. ANNINE-6plus generates a fluorescence contrast of about 30% AF/F for a 100 mV change in mammalian cardiomyocytes [35]. The use of a quantum-confined Stark effect in a quantum dot has also has also been proposed but has yet to be realized [36].
The VoltageFluor family of dyes utilize a different approach to respond to the elec-tric field [37] [38]. These dyes utilize voltage-selective photoinduced electron transfer to quench the excited state of the dye during the resting potential membrane state. Under depolarization, quenching becomes less favorable and the dye fluoresces more brightly. These dyes exhibited a sensitivity of 10% AF/F for a 100 mV depolarization in rat neurons and up to 48% AF/F for a 100 mV depolarization in HEK cells [38].
Genetically-encoded voltage indicators (GEVIs) have the advantage that they can be targeted to specific cells instead of staining every membrane present in a preparation. GEVIs typically have a voltage-sensitive domain (often derived from voltage-gated ion channels) and a fluorescent protein that modulates its fluorescence intensity in response to conformational changes of the voltage-sensitive domain [8]
A major family of voltage-imaging proteins are derivatives of the ArcLight protein [39] [32]. ArcLight derivatives have been shown to have a sensitivity of 5%AF/F
per 100mV with cn/off time constant on the order of 10 ms in neurjms. Another novel sensor is ASAPI, exhibiting on/off time constants of approximately 2 ms with 4-5%AF/F change in fluorescence for a single action potential [40].
An important new class of high-performance GEVIs is the Arch family. These voltage sensors are based on Archaerhodopsin 3 (Arch), a microbial light-driven pro-ton pump from Halorubrum sodomense
[41].
Arch had been used as an optogenetic inhibitor but has been utilized in "reverse" as a voltage sensor. Arch's intrinsic pho-tocurrent has been suppressed in the Arch derivatives QuasAr1 and QuasAr2 [42]. QuasAri has a time constant of approximately 50 ps along with a sensitivity of ap-proximately 20%AF/F for an action potential event, putting its time resolution on par with typical electronic methods. QuasAr2 improves the SNR from measurementsap-proximately 0.4 ms
[42].
QuasArs are very dim reporters due to their poor fluorescence quantum yield, requiring their very high high excitation powers. They photobleach quite slowly with time constants on the order of several minutes1421.
Overall, many of the genetically encoded voltage indicators are quite dim and suffer from poor SNR ratios for recordings. Recent work has improved upon many of these limitations from multiple approaches and has produced new families of improved sensors. However, certain limitations remain, including photobleaching, toxicity is-sues, brightness/SNR challenges, and localization of events at high spatial resolution [43].
Calcium sensors
Calcium sensors use a second messenger approach by detecting the rapid increase
(10-100 fold) of intracellular calcium ions that accompanies the action potential [30]. The
calcium influx originates from multiple sources including voltage- and ligand-gated ion channels as well as release from storage sites within the cell. Calcium-sensitive dyes can be free in the cytosol which improves the signal. The primary limitation of calcium sensing dyes is in temporal resolution; the timescales of the voltage dynamics are much faster than the time scales at which the cha ges in intracellular calcium ion concentrations can be detected and transduced in o an optical signal. Many common calcium-sensing dyes have on/off times on the order of 100 ms. In addition, subthreshhold events (depolarization events too small to cause an action potential) are difficult to detect via calcium imaging but can be detected via voltage imaging
[30].
On a molecular level, calcium-sensitive dyes change their fluorescence emission in response to a binding event of a calcium ion. For small-molecule dyes, the most common approach is through design of a dye with a chelation site for the Ca2+ ion.
For genetically encoded calcium indicators (GECIs), the most common approach is through engineering fusion proteins containing a calcium binding protein (such as calmodulin) with a fluorescent protein.
dyes were significant early developments. However, for the space of neuroscience applications, they have increasingly replaced by genetically encoded calcium sensors
[301. The GCaMP family of proteins is the most commonly used class of proteins
for calcium imaging [44] [45]. The recently engineered GCaMP6f protein shows a fluorescence change of 20-30% AF/F for a single action potential in dissociated rat hippocampal neurons. However, the rise time constants for the dye are on the order of 50 ms and the decay times are approximately 150 ms which is too slow for clear resolution of every action potential [44].
2.2.3
Actuation and all-optical electrophysiology
Sophisticated all-optical electrophysiology experiments require selective stimulation and wide-field observation of a large ensemble of cells. Electrical events need to be detected at millisecond resolution and the cell undergoing each depolarization must be clearly identifiable, a challenge in dense confluent cultures [8]. The stimulation and readout must be optically multiplexable with separate channels for excitation and observation.
Actuation methods form an important part of an all-optical electrophysiology system. There are a variety of approaches for noninvasive actuation of neuronal systems that complement all-optical approaches to electrophysiology [9]. Of particular note are widely used optogenetic methods that use light to selectively neuromodulate cells through introduction of light-activated ion channels into cells. When these ion channels are expressed and exposed to particular wavelengths of light, they open and cause a change in the membrane potential. Both excitatory and inhibitory stimuli can be provided. Recent work in optogenetics has allowed for color multiplexing in stimulation
146].
Specific cells can be targeted through use of a spatial light modulator or a digital micromirror device [471.Localized heating and chemical stimulation are alternative approaches to optoge-netics. The strong water absorption peak in the infrared produces a rapid increase in temperature that causes a transient increase in the membrane capacitance that creates depolarizing currents. A sufficiently strong IR stimulus thus results in the
ini-tiation of an action potential [48]. Magnetic nanoparticles can also be used similarly; radio-frequency fields cause localized heating that results in neuronal stimulation [49]. Chemical stimulants can also modulating the activity of ligand-gated ion channels
[50].
All-optical electrophysiology methods are currently limited by the resolution of current voltage/calcium sensing methods. The development of a sensor of cellu-lar electrical activity with high spatiotemporal resolution would enable sophisticated experiments to be performed [8] [3]. A recent protein-based approach to this chal-lenge has been the development of Optopatch, the fusion of QuasAr with a CheRiff, a blue-sensitive optogenetic actuator [42]. However, Optopatch requires extremely high excitation powers, liming the field of view and retains photobleaching limitations of dyes.
Nanomaterials exhibiting non-photobleachable fluorescence may be able to sur-pass several of these barriers. Fluorescent nanoparticles such as quantum dots or diamond color centers are photostable and can be localized to a high degree of preci-sion using super-resolution microscopy [36] [23]. The nitrogen-vacancy center within diamond is a highly studied crystallographic defect within diamond. Recent work has shown the sensitivity of the nitrogen vacancy center to the electric field as well as the biocompatibility of diamond, suggesting its potential use as an optical indicator of neuronal activity [24] [51].
Chapter 3
The nitrogen vacancy center in
diamond and its potential as a
voltage sensor
The electronic structure of the NV center is described in Section 3.1. Sensing using the NV center is reviewed in Section 3.2 and biological applications of diamonds con-taining the NV center are described in Section 3.3. Section 3.4 suggests an approach to investigate voltage sensing with NV centers in nanodiamonds.
3.1
Electronic structure of the NV center
The nitrogen vacancy center is a crystallographic defect in diamond that consists of a substitutional nitrogen atom and an adjacent vacancy in the diamond lattice as shown in Figure 3-1.
The NV center can exist in several different charge states: NV-, NV0, and NV+.
The negatively charged NV center NV- is comprised of six electrons. Using a chem-ical bonding model, three of those electrons come from the dangling bonds of the carbons adjacent to the vacancy site, two electrons from the nitrogen substitutional impurity, and the sixth electron from an additional donor in the lattice [23]. The loss of one electron from the vacancy yields NV0 and the loss of a second electron yields
Figure 3-1: Example structure of the NV center within the diamond lattice. The substitutional nitrogen atom is shown in blue and the vacancy is shown in pink.
NV+. Two out of the six electrons are unpaired; the NV- center can accordingly be
considered as a system of two holes rather than six electrons as an effective spin S = 1
system. A simplified energy level diagran of the NV- center is shown in Figure 3-2
152]
[23].Diamond has a large bandgap of 5.5 eV that leads to its optical clarity; defects introduce additional states within the bandgap. The electronic structure of the NV-center consists of a spin triplet ground state 3A
2, a spin triplet excited state 3E and
a metastable singlet state with two levels 'A, and I1E. The spin triplet ground and excited states are split into sublevels (m, = -1, 0., +1) depending on the electron spins. In the absence of any external field, the ns = 1 spin states are degenerate
and show zero-field splittings in the ground and excited states as shown in Figure 3-2
[52] [231 [53J.
In the presence of a magnetic field, the degeneracy is lifted and the m, = +1 and ms = -1 states are split by the Zeeman effect. The frequency separation is 2,B where 7 is the electron gyromagnetic ratio and B is the magneticfield in the direction of' the NV axis [521 1231.
conduction band 1.42 GHz m s = 0 ~~ --- ...
B-field
- -m -ms =+ 2.87 GH z m - -1' mH = 0 metastable singlet stateI
'A 1E valence bandFigure 3-2: Schematic energy level diagram center. Important transitions are also shown.
1
Cn C)
A:
550 600
of the electronic structure of the NV Based on [52] [231.
650 700
Wavelength (nm)
750 800
Figure 3-3: NV- and NV0 fluorescence emission spectra in high pressure high
tem-perature nanodiamonds at room temtem-perature. Image adopted from
[24].
5.5 eV
637 nm(1.945 eV)
3A2
NV-(ZPL) at 637 nm corresponding to transitions between the 3E excited state and the
3A
2 ground state. The emission spectrum also contains a broad phonon sideband from approximately 630 nm to 800 nm. The phonon vibrational modes form a band of states above the 3A
2 and 3E states. Coupling to these modes adds additional
transitions that result in the broad phonon sideband [52].
Excitation from the ground state to the excited state of NV- is spin-conserving
1521
[23]. The excited states can decay through two different pathways. The first pathway
(spin-conserving) is through a fast radiative transition back to the ground state. The second pathway (spin-nonconserving) is nonradiative decay through the long-lived metastable singlet state 'A1 [23]. An excited state electron in the m, = t1 states has a significantly larger chance of decaying via the nonradiative pathway compared to an excited state electron in the m. = 0 state. The nonradiative decay pathway leads to an optical contrast of approximately 30%. Nonradiative decay through the singlet state repumps the electron to the m, = 0 spin state
1521
[23].The spin state of the NV- center can be initialized to the m, = 0 state through a
long green excitation laser pulse. The application of microwave radiation at resonant frequencies between sublevel transitions can be used to initialize the spin state into the m, - +1 or m, = -1 state [23]. The spin initialization, control, and readout properties of the NV- center have made it an attiactive material for applications in quantum information science and for nanoscale sensing. However, the charge state of the NV- center is known to be unstable [54] [55] [56]. Certain types of high-intensity laser illumination or diamond surface terminations have been shown to convert NV-to NV0 [24]. For spin-based applications in quantum information processing, preser-vation of the NV- charge state is essential.
The electronic structure of the NV0 center is shown in Figure 3-4 and its fluores-cence emission spectra is shown in Figure 3-3. The electronic structure of the NV0 center consists of a spin doublet ground state 2E and excited state 2A along with a
spin quartet state 4A2 [52] [57]
[58].
The NV0 spectra shows a sharp zero-phonon lineat 575 nm with a broad phonon sideband from approximately 580 nm to 750 nm. The differing emission spectrum allows for spectral discernment of the NV center charge
conduction band
2
A
.5.5 eV 575 1m 4A2
2E
valence band
Figure 3-4: Energy level diagran of the electronic structure of the NV0 center 1521. state.
Much of the attention focused on the NV center has been focused on control and maintenance of the NV- charge state in bulk diamond
|561 [59]
1601. Material engineering and active control systems have been used to control the charge state. For an NV center located near the surface of a bulk diamond crystal, llydrogen-teriinated diamond promotes the NV" charge state while oxygen-termination promotesNV-1611. This has been attributed to band-bending effects caused by the negative electron
affinity of' the hydrogen termination [24J. Active devices have been fabricated on bulk diamond that apply electric fields that lead to NV charge state switching
[91
1601. In addition, charge-state switching has also been shown in nanodiamonds as
well in a model electrochemical cell [241. Through these methods, it is possible to achieve reversible control of NV" to NV- conversion. In addition, these studies have
additionally revealed reversible conversion between NV to the NV+ charge state, the nonfluorescent dark state
[59].
3.2
Sensing using the NV center
The NV- center has been used for several different sensing systems that take advan-tage of optical detection of the NV- spin state. The most widespread application
is for magnetometry [13]
114]
[15]. Through optically detected magnetic resonance(ODMR) experiments, microwave radiation through an antenna near the NV- center is swept through the resonant frequency while observing the fluorescence contrast.
When the microwave frequency is on resonance with the ground state m, = 0 -+ -1
transition or the ground state m, = 0 -+ +1 transition, the electron is pumped into
the nonzero spin state and accordingly shows optical contrast [13] [14]. The difference between the resonant frequencies of the two transitions corresponds to the magnetic field in the NV axis due to the Zeeman splitting. ODMR with the NV center has been used in widefield imaging with bulk diamond, with nanodiamonds, as well as with scanning probes [23].
In addition to magnetic field sensing, the NV- center has also been used for sensing of electron spins [62] [63], nuclear spins [64] [65] [66], temperature [67] and charge [68].
Many of these utilize more complex pulse sequences for sensing similar to methods in magnetic resonance imaging [23]. The spin state can also be measured through selective conversion of the m, = 0 state to NVO, allowing for single-shot readout of the spin state [69].
The NV- center has also been shown to be sensitive to electric fields through Stark shift and spin-orbit coupling mechanisms [16] [17]. In addition to sensing electric fields directly through these mechanisms, a charge-state conversion scheme between NV-and NV0 can be used to measure the local environment of the NV center [59] [24].
Hydroxylated and hydrogenated nanodiamonds have been demonstrated to show reversible control of their charge state through experiments carried out in an electro-chemical cell [24]. In Figure 3-5, fluorescence modulation data is shown in response to an applied voltage (adapted from [24]). A 650 nm longpass filter was used in the wide-field image acquisition to select for NV- fluorescence (as can be seen from Figure
3-3). For hydroxylated NDs, the mechanism is thought to be primarily charge-state
switching between NV- and NV0 and results from band bending as a result of the
electric field from the potential. In the case of hydrogenated NDs, the mechanism is thought to be primarily switching between NV0 and the nonfluorescent dark state
electrochemical cell studies show that the NV center can serve as an effective sensor
for the local potential environment through modulation of the charge state.
hydroxylated NDs
A
0
0 0. >- ZSMVV 1.9 2_-_----2 -M)0
10I
1 2 3 4 5 6 7 8 9 10 AF JF,, a- 1.65 1 .55 0 20 40 60 80 100 120 0 5 10 15 Time (s) Time (s) 05hydrogenated NDsD
00'>05l 1,/\A
IV
,
0 0) 305 2 20 15-i_6v -) 5 10 15 20 25 30 35 40 "Fn F;J -j 0 20 40 60 80 100 120 0 5 10 Time (s) Time (s)Figure 3-5: A. Three representative fluorescence time traces of hvdroxvlated NDs subject to the voltage trace shown. B. Histogram of the average maximal fluorescence
contrast percent for hydroxylated NDs. C. Representative fluorescence time traces of
hydrogenated NDs subject to the voltage trace shown. D. Histogram of the average maximal fluorescence contrast percent for hydrogenated NDs. Figure adapted from
124].
The electrochemical cell studies have also shown that NV centers within
nan-odiaionds are sensitive to small changes in the electric field with high temporal
resolution [24]. Figure 3-6A demonstrates individual hydroxylated NDs showing sel-sitive fluorescence modulation in response to 100 mV square wave pulses. Figure 3-6B
duration 100 mV voltage pulses and Figure 3-6C demonstrates that multiple clusters
of NDs can be used to detect voltage changes as low as 20 mV 124]. Taken together, these results show that the integrated signal from multiple NV centers are sensitive
enough to resolve low amplitude events and are also fast enough to resolve dynamics
nearly on the duration of neuronal activity.
0
A >B
09 >8 -079 CU 08 0 5 T (s 40_0_ 8 10 12 > ~~~~Tm (s)--T--l-l---lT 0.3 0.2 1.05 -j 0 z 1.00 0.95 0 0.2 0.4 0.6 Time (s) o.17. 1 0.98-0 96- I) 0 94[
I I 0 5 10 15 Time (s) 20 25Figure 3-6: A. Fluorescence time trace of two hydroxylated NDs in response to 100 mV square wave pulses. B. Fluorescence time-trace of a cluster of hydrogenated NDs to 100 mV square wave pulses of duration 5 ms. Figure adopted from 1241. C.
Fluorescence time traces of multiple clusters of NDs integrated together in response to 20 mY pulses.
0
3.3
Biological applications of NV centers
NV centers in both bulk diamond and in nanodiamnonds have been used for a variety
of applications in biosensing and labeling. Diamond is an attractive material for
I Iii 11111
0.8C
a) 0) -_ 0 E 0 zbiological applications as the sp3 lattice of diamond is chemically nonreactive and
biologically inert [70] [51] [71] [72]. Nanodiamonds have been shown to have low cytotoxicity in neurons [51] [71]. In addition, chemical modification of the surface of nanodiamonds enables covalent attachment of biomolecules [23] [73].
The NV center is both bright (emitting more than 106 photons/second) and pho-tostable, providing an advantage over small molecule dyes and fluorescent proteins
[23]. Photobleaching of emitters is a major limitation of fluorescence microscopy; the
absence of photobleaching of the NV center enables longer-duration recordings. The
NV center is also compatible with several super-resolutions imaging techniques [74] [75].
Most biological applications of the NV center have focused on the use of the NV center as a photostable tag or on NV- spin state based sensing. For tagging appli-cations, the NV center has been used for tracking the orientation of nanodiamonds in HeLa cells [76], tracking quiescent cancer stem cells [77], and particle tracking within Drosophila melanogaster embryos
[78].
NV- magnetometry has been usedto image the magnetic fields of magnetotactic bacteria [791 as well as the magnetic fields of magnetic nanoparticles that selectively labeled cancer cells [80]. Single-cell thermometry has also been performed as well [81].
3.4
Towards voltage sensing with NV centers
The optical properties of the NV- center suggest its utility as a voltage sensor. The brightness and photostability of the NV center as well as its compatibility with super-resolution methods addresses significant challenges with current tools for optical elec-trophysiology [23]. Several approaches for NV-based electrophysiology have been proposed.
One approach is to use the NV- center as a magnetometer to measure the magnetic fields associated with an action potential event [21] [22]. Through physical simulation, neuronal magnetometry using shallow NV centers in bulk diamond has been shown to be viable but has yet to be experimentally realized. A related approach seeks to use
the electric-field dependence of the NV- center's resonances to detect the changing electric field caused by an action potential [23]. Another approach that has been computationally tested utilizes the optically detected decoherence of an NV center in a diamond scanning probe near the surface of a membrane. The decoherence rate will vary if a nearby ion channel is open or closed
[821.
Relaxometry has been experimentally used to locate gadolinium ions labeling phospholipids in an artificial lipid bilayer [831.In this thesis, charge state switching is targeted as the physical mechanism to transduce local environmental changes to an optical signal for detection of cellular electrical activity. In particular, the time resolution and voltage sensitivity suggest that charge state modulation is a viable viable approach for optical electrophysiology [241. A characteristic that distinguishes this approach from other proposals for using the NV center for electrophysiology is the absence of microwave control of the NV center. Aqueous solutions absorb microwave radiation and so requiring the delivery of microwave power to NVs located on or near the cell significantly heats the sample, often killing the cells.
A two-part platform was developed to test the utility of the NV center for this
optical electrophysiology. The first part was adding the capability to perform electro-physiology experiments to an existing microscop and the second part was optimizing the hydrogen-terminated nanodiamond staining of neurons. Together, these enable experiments where electrical control of cells can be established while changes in the
NV fluorescence are detected.
In Chapter 4, the design of the electrophysiology rig is described along with results testing the setup on HEK293 cells. Though the setup was validated on HEK cells, it can immediately be used for experiments on neurons as well. Work on improving the staining efficiency of hydrogen-terminated nanodiamonds on neurons is described in Chapter 5. An existing nanodiamond micellation delivery process [251 was opti-mized for hydrogen-terminated nanodiamonds. Hydrogenated nanodiamonds showed promising results in an electrochemical cell environment, suggesting the utility of hydrogen-terminated nanodiamonds for sensing action potentials.
![Figure generated using NEURON software [29]. . . . . . . . . . . . . 24 2-4 The major classes of techniques used to detect neuronal activity in](https://thumb-eu.123doks.com/thumbv2/123doknet/14732732.573405/11.918.126.782.90.1186/figure-generated-neuron-software-classes-techniques-neuronal-activity.webp)