UNIVERSITÉ DE MONTRÉAL
SEISMIC DESIGN AND QUALIFICATION OF ALL-STEEL BUCKLING-RESTRAINED BRACED FRAMES FOR CANADIAN APPLICATIONS
MORTEZA DEHGHANI
DÉPARTEMENT DES GÉNIES CIVIL, GÉOLOGIQUE, ET DES MINES ÉCOLE POLYTECHNIQUE DE MONTRÉAL
THÈSE PRÉSENTÉE EN VUE DE L’OBTENTION DU DIPLÔME DE PHILOSOPIAE DOCTOR
(GÉNIE CIVIL) DÉCEMBRE 2016
UNIVERSITÉ DE MONTRÉAL
ÉCOLE POLYTECHNIQUE DE MONTRÉAL
Cette thèse intitulée :
SEISMIC DESIGN AND QUALIFICATION OF ALL-STEEL BUCKLING-RESTRAINED BRACED FRAMES FOR CANADIAN APPLICATIONS
présentée par : DEHGHANI Morteza
en vue de l’obtention du diplôme de : Philosophiae Doctor a été dûment acceptée par le jury d’examen constitué de :
M. LÉGER Pierre, Ph. D., président
M. TREMBLAY Robert, Ph. D., membre et directeur de recherche M. BOUAANANI Najib, Ph. D., membre
DEDICATION
ACKNOWLEDGEMENTS
I would like to take this opportunity to express my deepest gratitude toward Professor Robert Tremblay whose continuous support and advice has made this work possible. I would also like to thank my evaluation committee members Professors Peter Dusicka, Pierre Léger, and Najib Bouaanani for accepting to review this dissertation. In course of these years I have been benefited from help and support of many individuals. Special thanks are given to the staff of Structural Engineering Laboratory of Polytechnique Montréal for their kind assistance during nearly four years that I spent in the lab. In particular, I am very grateful to Martin Leclerc, Patrice Bélanger, Romain Siguier and Xavier Willem for their direct involvement in this research project. I am also very thankful to my officemates Dr. Poulad Daneshvar, Dr. Fabien Eddy Lagier, Ilona Bartosh, Thierry Béland, and Armin Sadeghian for their support and friendship. Adam Korzekwa graciously shared his Master’s thesis work and ideas which is appreciated. Assistance received from Abdelfettah Abouhammada and Xavier Lachapelle-Touillard in conducting BRB and material tests is acknowledged. The scholarship awarded by Structural Steel Education Foundation (SSEF) is also acknowledged and appreciated. Steel plates used to fabricate specimens for material testing and BRB cores were donated by Canam-Bridges Company. Fabrication of BRB specimens, and debonding materials were donated by Lainco Inc. Stainless steel sheets were offered by Goodco Z-Tech Company. Contributions and collaborations from the mentioned companies are greatly appreciated. GRS department secretaries Mrs. Manon Latour, Mrs. Anne-Marie Goulet, and Mrs. Julie Dallaire are saluted for their help and kindness.
This endeavor would have not been absolutely possible without unconditional love and support of my beloved wife Maryam Nowrouzi. She deserves an everlasting credit for her endless patience and great kindness. Halfway through this PhD program, our beautiful daughter Hanna was born whose fourth birthday we will be celebrating just after my defence session. Her cute smile was so powerful that I could survived all these hard years.
RÉSUMÉ
Les contreventements à diagonales ductiles confinées (DDC) sont devenus le système de contreventement standard pour les bâtiments et pont pour résister aux charges sismiques. Ce système intègre un concept spécifique de diagonales, appelé, DDC, qui ne flambent pas en compression fournissant ainsi un mécanisme de dissipation d'énergie stable. La capacité de dissipation de l'énergie sismique des DDC est fortement reliée à la performance du mécanisme de retenue du flambement qui prévient le noyau ductile interne de subir une déformation latérale excessive. La force transmise au système de confinement dépend de plusieurs facteurs qui doivent évalués avec précision et intégré lors de la conception.
Dans cette étude, un système DDC robuste aux séismes a été développé et testé expérimentalement pour les conditions de chargement sismique extrêmes qui sont attendues au Canada. Le système de confinement de la diagonale est constitué uniquement d’éléments en acier, ce qui constitue un avantage important pour les fabricants en éliminant le besoin de couler du béton ou mortier. Cette étude combine des recherches expérimentales et analytiques afin de définir les données essentielles pour la conception de ce type de contreventement.
Les contreventements à diagonales ductiles confinées ont récemment été introduits dans les normes canadiennes de conception de bâtiments (NBCC 2010 et S16-09) en tant que système ductile résistant aux forces sismiques latérales. Afin d'estimer la demande en déformation pour la conception de DDC, une étude numérique a été menée sur des bâtiments de plusieurs étages contreventés avec ce système dans l’est et sud-ouest du Canada. Pour ces analyses, on a développé une méthode statistiquement robuste pour la sélection et la mise à l'échelle des données sismiques au sol. Dans cette méthode, les enregistrements sont sélectionnés en fonction des caractéristiques attendues du mouvement du sol en termes d'amplitude, de fréquence et de durée. Contrairement aux méthodes classiques, l'approche proposée est indépendante de la période fondamentale du bâtiment et, par conséquent, un ensemble d'enregistrements échelonnés peut être utilisé pour l'analyse de bâtiments présentant différentes caractéristiques dynamiques. L'étude numérique des DDC a indiqué qu’en général, la performance sismique sous les séismes de conception était satisfaisante. Néanmoins, ces analyses prédisent un déplacement latéral résiduel permanent important qui peut entraver la fonctionnalité du bâtiment immédiatement après le séisme et entraîner un coût de réparation considérable. La demande sismique pour le DDC dans l'est du
Canada est considérablement inférieure à celle de la côte ouest. Cette étude a montré que les charges sismiques de conception du CNBC pour les diaphragmes s'est révélée insuffisante, particulièrement aux étages inférieurs.
Afin d'obtenir des données fiables sur le comportement des matériaux de base, un programme expérimental de caractérisation du matériau utilisé a été réalisé. Les caractéristiques mécaniques de l'acier CSA G40-21 350WT ont été étudiées en réalisant des essais à l’échelle locale à température ambiante et à des températures sous le point de congélation. En particulier, le comportement écrouissant sous chargement cyclique et résistance à la fatigue de cet acier ont été évalués et des modèles prédictifs ont été développés et calibrés pour être utilisés pour la conception du système de retenue. Le modèle étalonné a été mis en œuvre avec succès pour prédire la rupture par fatigue sous plusieurs protocoles de déplacements. Les résultats des essais montrent que ni la contrainte de rupture en traction, ni la fatigue à faible cycle de l'acier 350WT ne sont affectées par les conditions de température sous le point de congélation. Cependant, la combinaison d’une température en dessous de zéro et une vitesse de chargement rapide a conduit à une augmentation considérable de la limite élastique de l'acier.
Une méthode analytique a été développée pour la conception du système de confinement. Cette méthode considère diverses caractéristiques importantes du mécanisme des DDC, telles que l'écrouissage isotrope et cinématique sous sollicitation cyclique de l'acier du noyau, les forces de frottement, l’historique de friction, la rigidité du système de confinement et l'effet de Poisson. En général, les résultats obtenus de la méthode correspondent bien avec les résultats d'études expérimentales et d'analyses par éléments finis.
Dans la dernière phase de ce projet de recherche, le concept proposé pour la DDC a été validé au moyen de douze essais à grande échelle. Différents paramètres ont été étudiés, tel que l’espace libre autour du noyau, les conditions d’interface et la rigidité globale et locale du système de confinement. Trois nouvelles combinaisons de matériaux ont été étudiés pour l'interface noyau-système de confinement. Parmi celles-ci, la combinaison comprenant une tôle d'acier inoxydable et une feuille de UHMW-PE1 a été jugée la condition d’interface la plus efficace. Une rotule
1 Polyéthylène de masse molaire très élevée
plastique flexible a été introduite dans l'assemblage entre le DDC et le gousset pour obtenir un comportement stable tout ne minimisant les moments de flexion. Les résultats des essais ont démontré que le détail de rotule était efficace pour contrôler les moments de flexion imposés à la DDC. En plus des protocoles de chargement conventionnel, la performance du système proposé a été vérifiée sous diverses sollicitations sismiques induites par des séismes se produisant en surface de la croûte terrestre et à la jonction entre plaques tectoniques (séismes de subduction). Les observations expérimentales de ce projet ont permis de démontrer que le système DDC développé peut supporter de grandes déformations inélastiques cycliques sans perte de rigidité et de résistance et tout en offrant une ductilité résiduelle post-sismique significative.
ABSTRACT
Buckling-Restrained Braced Frames (BRBF) have become one of the standard ductile lateral systems for building structures and bridges to resist the earthquake loads. This system incorporates special diagonal elements, called BRB, that do not buckle in compression hence providing a stable and nearly symmetrical hysteretic response in tension and compression with high seismic energy dissipation capacity. The energy dissipation capability of BRBs is strongly linked to the performance of buckling restraining mechanism that constrains the internal ductile core from undergoing excessive lateral deformation. The force demand on the restraining system depends on several factors that should be precisely estimated and implemented in design.
In this study a seismically enduring patent-free BRB system was conceptually developed and experimentally qualified for extreme seismic loading conditions that are expected in Canada. The restraining system of the developed BRB is entirely built from steel that would be advantageous for steel fabricators as the need for concrete or mortar casting and curing are eliminated. In the course of this study and in order to acquire the essential data for proper design of the restraining system, a combination of analytical and experimental research is conducted.
BRBF has recently been introduced in the Canadian building design standards (NBCC 2010 and S16-09) as a ductile seismic lateral force resisting system. Aimed at estimation of design deformation demand on BRB elements, a numerical study was conducted on multi-storey code-conforming BRBFs in eastern and southwestern Canada. For time history analysis, a statistically robust method for ground motion record selection and scaling was developed. In this method records are selected based on the expected ground motion characteristics in terms of amplitude, frequency content and duration. Unlike conventional methods, the proposed approach is independent of the building fundamental period and accordingly one set of scaled records can be used for analysis of buildings with different dynamic characteristics. Numerical studies indicated that, in general, the seismic performance of BRBFs under design earthquakes is satisfactory. Nevertheless, these analyses predicted significant residual displacements which may impose considerable repair cost. The seismic demand on BRBFs in eastern Canada was found to be considerably lower than that of the west coast. This study also showed that the current NBCC design load for floor diaphragms could be significantly exceeded, especially at lower storeys.
In order to obtain reliable data on core material behaviour an experimental material characterization program was carried out. In this phase, important features of CSA G40-21 350WT steel were investigated by testing small-scale material specimens at room and subfreezing temperatures. In particular, the cyclic hardening behaviour and the low cycle fatigue life of this material were evaluated and the predictive models were developed and calibrated to be used in the design of the restrainer system. The calibrated model was successfully implemented to predict the failure life under several variable-amplitude loading patterns. For the conditions examined in this test program, the results show that neither the tensile fracture strain nor the low cycle fatigue of 350WT steel is affected by subfreezing temperature conditions. However, the combination of cold temperature and fast loading rates resulted in considerable increase in the yield strength of this type of steel.
An analytical method was developed to design the restrainer system. This method accounts for various important features of the BRB mechanism such as the cyclic strain hardening of the core, friction path, the constraining stiffness of the restrainer, and the Poisson’s effect. In general, predictions from the method agree well with results from past experimental data and finite element analysis simulations.
In the final phase, the developed BRB concept was evaluated through twelve full-scale tests. Various parameters such as gap, core-restrainer interfacial condition, and global and local stiffness of restrainer were investigated. Three new debonding material were proposed and qualified experimentally. Of the three tested cases, the combination of stainless steel sheets and UHMW-PE2 was found to be the most efficient option. A simple hinge connection for BRB-to-gusset plate joint was developed and implemented in the test specimens. Experimental observations indicated that the proposed hinge was effective to mitigate the damaging flexural demand on the BRB system. In addition to the standard loading, the performance of the developed system under repeated seismic loading was also considered and the loading histories from crustal and subduction earthquakes were included in the testing program. Experimental observations confirmed that the
2 Ultra-high-molecular-weight polyethylene
developed BRB system can sustain repeated large inelastic deformations without stiffness and strength degradation, while offering significant post-earthquake ductility capacity.
TABLE OF CONTENTS
DEDICATION ... III ACKNOWLEDGEMENTS ... IV RÉSUMÉ ... V ABSTRACT ...VIII TABLE OF CONTENTS... XI LIST OF TABLES ... XIX LIST OF FIGURES ... XXII LIST OF SYMBOLS AND ABBREVIATIONS ... XXXVIIICHAPTER 1 INTRODUCTION ... 1
1.1 Background ... 1
1.2 Research objectives ... 4
1.3 Research methodology ... 5
1.4 Organization ... 6
CHAPTER 2 LITERATURE REVIEW ... 8
2.1 General ... 8
2.1.1 Buckling-restrained brace ... 9
2.1.2 All-steel BRBs ... 10
2.2 Seismic design and demand on BRBFs... 13
2.2.1 BRBF design ... 13
2.2.2 Inelastic models for BRBs ... 17
2.2.3 Seismic demand and performance ... 22
2.2.4 Qualification testing and acceptance criteria ... 27
2.3.1 Global stability design ... 32
2.3.2 Normal thrust analysis ... 35
2.3.3 Interfacial friction... 45
CHAPTER 3 METHODOLOGY ... 47
3.1 General ... 47
3.2 Literature review ... 48
3.3 Ground motion selection and scaling ... 48
3.4 Estimation of displacement demands on BRBFs in Canada ... 49
3.4.1 Background ... 49
3.4.2 Design of code-conforming BRBFs ... 49
3.4.3 Inelastic modeling and analyses ... 51
3.4.4 Post-processing analysis results ... 51
3.5 Experimental material characterization of 350WT steel ... 61
3.5.1 Introduction ... 61
3.5.2 Specimens ... 62
3.5.3 Test setup, instrumentations, and execution ... 62
3.5.4 Loading ... 64
3.5.5 Test data analysis ... 65
3.6 Analytical estimation of normal thrust ... 74
3.7 Experimental qualification of full-scale all-steel BRBs ... 75
3.7.1 BRB specimens ... 75
3.7.2 Test setup and instrumentations ... 76
3.7.3 Loading protocols... 78
CHAPTER 4 ARTICLE 1 : ROBUST PERIOD-INDEPENDENT GROUND MOTION SELECTION AND SCALING FOR EFFECTIVE SEISMIC DESIGN AND ASSESSMENT . 90
4.1 Introduction ... 90
4.2 Record Selection ... 93
4.2.1 Dominant earthquake scenarios ... 93
4.2.2 Selection based on conditional IM ... 93
4.2.3 Proposed selection approach ... 95
4.2.4 Initial record selection ... 99
4.2.5 Selection refinement ... 101
4.3 Record Scaling ... 110
4.3.1 Conventional scaling methods ... 110
4.3.2 Least Moving Average (LMA) scaling method ... 116
4.4 Comparative Studies ... 122
4.4.1 Proposed selection refinement method versus random record drawing ... 122
4.4.2 Impacts of earthquake scenario and record allocation ... 124
4.4.3 Effect of scaling on inelastic demand of SDOFs ... 125
4.4.4 Impacts of selection and scaling on response of a multi-storey frame... 129
4.4.5 Robustness of the proposed method for MDOFs ... 131
4.4.6 Appropriate percentile of demand indices ... 133
4.5 Observations and Concluding Remarks ... 135
Acknowledgment ... 137
Nomenclature ... 137
References ... 141
CHAPTER 5 SEISMIC PERFORMANCE OF CANADIAN CODE-CONFORMING BUCKLING-RESTRAINED BRACED FRAMES ... 144
5.1 General ... 144
5.2 Introduction ... 144
5.3 Design of prototype models ... 146
5.3.1 Earthquake sources in populated areas of western and eastern Canada ... 146
5.3.2 Buildings studied ... 147
5.3.3 Seismic design loads ... 148
5.3.4 Design of the prototype BRBFs ... 150
5.3.5 Design results ... 153
5.4 Numerical models and ground motion records ... 157
5.4.1 Modelling assumptions ... 157
5.4.2 Ground motion selection and scaling ... 160
5.5 Analysis setting, results and post processing... 164
5.5.1 NTHA global demand (at frame level)... 166
5.5.2 Storey drift ratio ... 168
5.5.3 NTHA local demand (at brace level) ... 176
5.5.4 Performance of the columns ... 182
5.6 Effects of important design parameters ... 187
5.6.1 Site effects ... 187
5.6.2 Effect of bracing pattern or length of YS ... 191
5.6.3 Effect of core material grade ... 193
5.6.4 Effects of frame vertical irregularity ... 195
5.7 Robust estimate of the demand ... 197
5.7.1 Results of alternative ground motion sets ... 197
5.8 Observations and conclusions... 207
References ... 211
CHAPTER 6 ARTICLE 2 : FATIGUE FAILURE OF 350WT STEEL UNDER LARGE-STRAIN SEISMIC LOADING AT ROOM AND SUBFREEZING TEMPERATURES ... 214
6.1 Introduction ... 215
6.2 Experimental Program... 217
6.2.1 Test Matrix... 217
6.2.2 Test Specimens ... 218
6.2.3 Cyclic loading protocols ... 219
6.2.4 Test Set-up ... 222
6.3 Test Results and Discussions ... 226
6.3.1 Ancillary tests ... 226
6.3.2 Constant-amplitude tests ... 228
6.3.3 Variable-amplitude test ... 229
6.4 Fatigue Damage models ... 234
6.4.1 Strain-life models ... 234
6.4.2 Energy-life models ... 236
6.5 Fatigue failure prediction ... 239
6.5.1 Strain-life approach ... 240 6.5.2 Energy-life approach ... 244 6.6 Conclusions ... 247 Acknowledgment ... 248 Nomenclature ... 248 References ... 251
CHAPTER 7 ARTICLE 3 : AN ANALYTICAL MODEL FOR ESTIMATING RESTRAINER
DESIGN FORCES IN BOLTED BUCKLING-RESTRAINED BRACES ... 253
7.1 Introduction ... 254
7.2 Proposed Model ... 257
7.2.1 Buckling wavelength and normal thrust force ... 257
7.2.2 Core buckled shape and forces ... 257
7.2.3 Cyclic strain hardening of steel and Poisson’s effect ... 259
7.2.4 Iterative procedure and design forces ... 263
7.2.5 Determination of the buckling wavelengths and shapes ... 265
7.2.6 Restrainer stiffness ... 266
7.3 Application and validation of the proposed method ... 268
7.3.1 Case study I ... 269
7.3.2 Case study II ... 274
7.3.3 Estimation of stiffness and force demand on restrainer ... 281
7.4 Summary and conclusions ... 284
Acknowledgements ... 285
References ... 286
CHAPTER 8 ARTICLE 4 : DESIGN AND FULL-SCALE EXPERIMENTAL EVALUATION OF A SEISMICALLY RESILIENT STEEL BUCKLING RESTRAINED BRACE SYSTEM ... 288
8.1 Introduction ... 289
8.2 Test Program ... 290
8.2.1 BRB specimens ... 290
8.2.2 Knife plate hinge (KPH) detail ... 294
8.2.4 Interfacial conditions ... 303
8.2.5 Test setup and instrumentations ... 305
8.2.6 Loading histories ... 309 8.2.7 Test matrix ... 310 8.3 Experimental Results ... 313 8.3.1 General observations ... 313 8.3.2 Specific measurements ... 321 8.4 Conclusions ... 332 Acknowledgements ... 333 References ... 334
CHAPTER 9 GENERAL DISCUSSION ... 336
9.1 Introduction ... 336
9.2 Ground motion selection and scaling ... 336
9.3 Seismic design and performance of code-conforming BRBFs ... 340
9.4 Mechanical behaviour of 350WT steel ... 347
9.5 Analysis of normal thrust ... 354
9.6 Experimental qualification ... 357
CHAPTER 10 SUMMARY AND CONCLUSIONS ... 363
10.1 General ... 363
10.2 Summary and conclusions ... 364
10.2.1 Ground motion selection and scaling ... 365
10.2.2 Seismic design and demand on BRBFs ... 365
10.2.3 Mechanical behaviour of 350WT steel ... 367
10.2.5 Seismic qualification of all-steel BRBs ... 368
10.3 Recommendations ... 369
10.3.1 Ground motion selection and scaling ... 369
10.3.2 Seismic demand on BRBFs ... 369
10.3.3 Characterization of core material behaviour ... 371
10.3.4 Analysis of normal thrust on restrainer ... 372
10.3.5 Seismic qualification ... 373
LIST OF TABLES
Table 2.1: Analytical expressions developed by Korzekwa (2009). ... 40 Table 3.1: Ground motion records employed to design the seismic loading histories. ... 65 Table 4.1: Impacts of record selection and scaling on peak inter-storey drift of a 9 storey BRBF1.
... 131 Table 4.2: Impacts of selection and scaling technique on stability of responses of 9-storey BRBF with respect to the number of selected records. Peak inter-storey drift ratio is the response metric. ... 133 Table 5.1: Design values of the studied buildings. ... 155 Table 5.2: Different percentile levels of the global demand parameters (for each percentile level the highest values across all models are reported). ... 168 Table 5.3: Unadjusted probability of exceeding global performance limit computed for the “soft rock” Split-X frames (probabilities are shown in percent). ... 175 Table 5.4: Percentile levels of seismic demands on BRB core YS in the most critical prototypes subjected to the basic set of ground motion records. ... 178 Table 5.5: Different percentile levels of important global and local demand parameters of 3 to 15 storey Split-X prototypes designed for class E sites (soft soil) and subjected to intra–plate earthquakes. ... 190 Table 5.6: Unadjusted probabilities of exceeding global performance limits for Split-X frames on soft soil in the west subjected to intra–plate earthquakes (probabilities are shown in percent). ... 191 Table 5.7: Ratio between local demand parameters in the 3- to 9-storey Diagonal and Split-X BRBFs designed for “soft rock” site in Victoria, BC (west of Canada). ... 192 Table 5.8: Ratio between demands computed from an 11-storey frame with Fysc = 225 MPa and a 9-storey frame with Fysc = 345 MPa. (Both frames have a Split-X bracing pattern and were designed for “soft rock” site in Victoria in west Canada)... 195
Table 5.9: Statistics of demand parameters in the Split-X west prototypes subjected to intra–plate earthquakes of the alternative suites of ground motions scaled using three scaling techniques. ... 198 Table 5.10: Robust (adjusted) estimate of some important global and local demand indices obtained from NTHA results of 3- to 15-storey west Split-X models subjected to intra–plate source. ... 200 Table 5.11: Adjusted probabilities of exceeding performance limits for the Split-X west prototype located on “soft rock” sites and subjected to intra–plate earthquakes (values are in percent). ... 201 Table 5.12: Suggested amplification factor of two important BRBF design parameters. ... 205 Table 6.1: Test matrix ... 218 Table 6.2: Average tensile properties of 350WT steel at room and subfreezing temperatures ... 227 Table 6.3: Results of Charpy V-notch impact tests ... 228 Table 6.4: Intensity measures of the loading signals in the seismic-loading tests ... 231 Table 6.5: Parameters of strain-life fatigue damage models for 350WT steel. ... 236 Table 6.6: Fitted parameters of energy-life models and cyclic hardening and master curves of the 350WT steel ... 239 Table 6.7: Observed and predicted numbers of passes to failure in the seismic-loading experiments (numbers are rounded to nearest integer for clarity) ... 244 Table 7.1: Comparison between experimental results of specimen 2Dcs0.46 reported in (Metelli, et al., 2016), the proposed analytical method, and finite element analysis. ... 271 Table 7.2: Comparison between the proposed analytical method and finite element analysis (values in brackets are from finite element analysis). ... 277 Table 8.1: Average mechanical properties of core plate ... 291 Table 8.2: Restrainers’ sectional properties and summary of the design results at the target storey drift angle of 0.03 rad... 302 Table 8.3: Typical properties of the debonding materials verified in this study ... 305
Table 8.4: Test matrix. ... 312 Table 8.5: Summary of test results. ... 319 Table 9.1: Ratio of roof design drift predicted by Ro Rd Δroof to the NTHA maximum roof drift (Victoria class C site Split-X models). ... 345 Table 9.2: Ratio of roof design displacement predicted by 3/2 Sa(T1) T12/4π2 to the NTHA maximum roof displacement (Victoria class C site Split-X models). ... 345 Table 9.3: Number of level crossing of the design floor acceleration in Split-X Victoria prototypes
... 346 Table 9.4: Ratio of overload to significant duration in Split-X Victoria prototypes (class C site).
LIST OF FIGURES
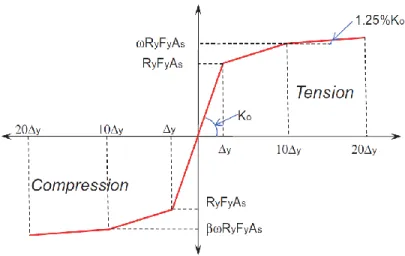
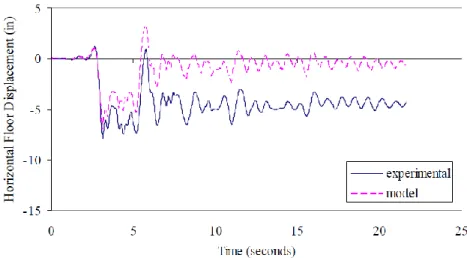
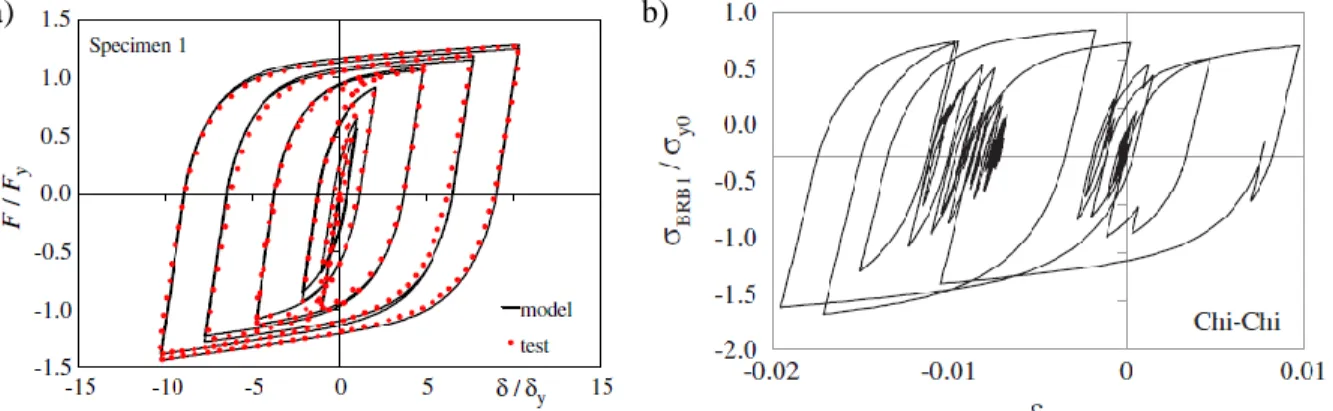
Figure 1.1: Typical failure mode of restrainer: a) all-steel restrainer (D’Aniello et al., 2014); b) bulging of steel tube in conventional mortar-filled BRB (Lin et al., 2016). ... 2 Figure 1.2: Hysteresis behaviour and fracture of an all-steel BRB with rough interfacial condition (steel versus steel) (Bolduc, et al., 2003). Note: failure occurred before finishing the second cycle of −/+1.4% drift ratio. ... 2 Figure 1.3: Examples of exposed steel braced structures in extremely cold environment and seismically-active region: a) multi-tiered steel braced frame as the vertical support in the material handling system of an iron ore mine in Baffin Island, Canadian territory of Nunavut with 2% in 50 years PGA of 0.125g (photo from: www.baffinland.com); b) steel arch railway bridge in Hurricane Gulch, Alaska with 2% in 50 years PGA of 0.5g) (photo by Ted Smith-Peterson obtained from www.railpictures.net). ... 4 Figure 2.1: Typical configuration and behaviour of Buckling-Restrained Brace element (Black et al., 2002)... 10 Figure 2.2: Preparation of an “all-steel BRB” for test at Structural Engineering laboratory of Polytechnique Montréal in 2002 (photos by Robert Tremblay). ... 11 Figure 2.3: Some possible configurations of “all-steel BRBs” (Note: dark color is restrainer and lighter color is core). ... 11 Figure 2.4: Schematic of core normal thrust on the restrainer after high-mode buckling, (Usami et al., 2008)... 12 Figure 2.5: Typical BRB backbone curve for estimation of strength adjustment factors, (Dutta et al., 2010)... 16 Figure 2.6: Evaluation of design forces in beam and columns of BRBF, Bosco, et al. (2013). .... 16 Figure 2.7: Comparison between experimentally measured and numerically predicted storey displacement, (Fahnestock, 2006). ... 19 Figure 2.8: Comparison between experimental BRB response under earthquake loading history and simulated response using Bouc-Wen model, (Black, et al., 2004). Note: Experiment was done under displacement-controlled loading. ... 20
Figure 2.9: Illustration of Bouc-Wen nonphysical behaviours under small amplitude load reversal: a) displacement drift; b) force relaxation, (Charalampakis, et al., 2009). ... 20 Figure 2.10: Comparison between experimental results and simulated BRB response using RUAUMOKO software, (Tremblay, et al., 2008). ... 21 Figure 2.11: a) Comparison between experimental results and the proposed BRB model in (Zona, et al., 2012). Note: loading is symmetric and displacement-controlled; b) BRB response using Zona model obtained from time history analysis, (Gu et al., 2014). Note the early yielding upon reloading after partial unloading. ... 21 Figure 2.12: Yield overshooting phenomenon in steel02 model. ... 22 Figure 2.13: Simulated cyclic test result by the BRB model developed in (Zsarnóczay, 2013). .. 22 Figure 2.14: Designed frame and building prototype model studied in (Fahnestock, et al., 2007b).
... 25 Figure 2.15: Peak and residual inter-storey drift of a 9-storey BRBF designed with the PBPD method outlined in (Sahoo, et al., 2010) (figure from the same reference). ... 26 Figure 2.16: Maximum and residual drift ratio in 6-storey BRBF and BRBF+MRF dual systems, (Kiggins, et al., 2006). ... 26 Figure 2.17: Conventional CBF, BRBF, and BRBF + elastic truss dual systems studied in (Tremblay, et al., 2007). ... 27 Figure 2.18: Comparison between inter-storey drift profile of bare BRBF and dual BRBF with elastic truss, (Merzouq, et al., 2006). ... 27 Figure 2.19: Statistics of the demand on BRBFs studied in (Sabelli, et al., 2003). ... 30 Figure 2.20 AISC-341 loading protocol for seismic qualification of BRBs. ... 31 Figure 2.21: Loading histories proposed by (Tremblay, et al., 2002): a) East, crustal events at distance; b) West, crustal events at distance; c) West, near-field events; and d) West, subduction events... 31 Figure 2.22: Combined global and local buckling in BRB (Usami, et al., 2008). ... 33
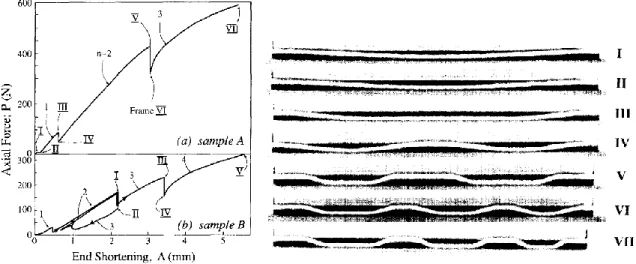
Figure 2.23: a) Global buckling of BRB due to plastic hinge formation at the non-yielding segment; b) additional bending moment due to out-of-plane movement; c) assumed collapse mechanism with plastic hinges at gusset plate ends, (Takeuchi, et al., 2014). ... 35 Figure 2.24: Load-displacement response and snapshots of the deformed configuration during at bifurcation points (mode transitions) (sample A), (Chai, 1998). ... 37 Figure 2.25: Buckling sequence of a bilaterally constrained column, (Chai, 1998). ... 37 Figure 2.26: a) Relation between loading and response parameters of a bilaterally-constrained elastic beam subjected to end shortening: a) axial force vs shortening; b) axial force vs normal thrust, (Chai, 1998). ... 38 Figure 2.27: Statistical variation in number of modes at the given axial shortening, (Chai, 2002).
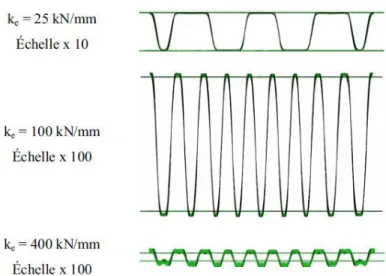
... 38 Figure 2.28: Buckling waveforms considered in the analytical development by Korzekwa (2009). Note: only two buckling waves are shown, i.e. m = 2. ... 40 Figure 2.29: Effect of restraining stiffness on the buckling wave number and waveforms, (Korzekwa, 2009). ... 41 Figure 2.30: Buckling waveforms studied in (Genna, et al., 2014). ... 42 Figure 2.31: Buckling wavelength factor as a function of normalized restraining stiff, (Bregoli, et al., 2016)... 42 Figure 2.32: Assumed: a) global buckling of brace; and b) local buckled shape of core in (Chou, et al., 2010)... 44 Figure 2.33: Frictional forces in BRB, (Chen, et al., 2016). ... 46 Figure 2.34 Non-uniform distribution of plastic strain of the core subjected to cyclic loads, (Korzekwa, 2009). ... 46 Figure 3.1: Process of selection and scaling of ground motion. ... 49 Figure 3.2: a) Plan of the studied building prototype (back-to-back brace bay arrangement is shown); b) Elevation view of the braced bays (only system with “back-to-back Split-X” chevron and “separated diagonal” braced panels are shown). ... 58
Figure 3.3: Designed building prototypes... 58 Figure 3.4: Considered chevron BRBF configurations. ... 59 Figure 3.5: Considered diagonal BRBF configurations. ... 59 Figure 3.6: Snapshot of the Excel tool developed for seismic design of BRBFs according to NBCC 2010 and S16-09. ... 60 Figure 3.7: Snapshot of the Excel worksheet for automatic design of BRBF columns. ... 60 Figure 3.8: Bouc-Wen model: a) General description of force-displacement relation; b) hysteresis response under symmetric displacement-controlled step loading. ... 61 Figure 3.9: Schematic view of chevron BRBF storey. ... 61 Figure 3.10: Test matrix for 350WT steel material characterization. ... 66 Figure 3.11: Geometry of specimens: a) Tension; b) Cyclic. ... 67 Figure 3.12: Measuring surface roughness of a specimen. ... 67 Figure 3.13: Verification of setup alignment using an instrumented specimen. ... 67 Figure 3.14: Lateral bracing of load frame: a) actuator end; b) crosshead. ... 68 Figure 3.15: Schematic view of the lateral bracing of the load frame actuator (illustrations courtesy of Martin Leclerc). ... 68 Figure 3.16: Installation stages of the assembled specimen into the load frame (1/2): a) assembled specimen; b) connecting to the top platen; c) clamping to the top platen; d) inserting the adjustment disk; e) pouring fast-curing mortar between base and adjustment disk; and f) moving down the assembled specimen until a small force is registered. ... 69 Figure 3.17: Installation stages of the assembled specimen into the load frame (2/2): a) pouring fast-curing mortar on the supports of the clamping system; b) placing the clamping system; c) clamping; and d) the final setup. ... 70 Figure 3.18: a) Deformed shape of specimen under large compressive strain when: a) there is no lateral bracing; b) the load frame is laterally braced (Specimens C107 vs C79). ... 70 Figure 3.19: Fracture mode of under fast monotonic tension. Gauge strain rate is 10%/s (Specimen M4 tested at room temperature). ... 71
Figure 3.20: Test setup for monotonic tensile under subfreezing condition (Specimen M17)... 71 Figure 3.21: The overall view of the test setup for cyclic tests at subfreezing temperature (Specimen C43)... 72 Figure 3.22: First-cycle hysteresis responses when strain rate was kept constant and when the first quarter cycle was conducted at a slow rate. Tests were done at room temperature. ... 72 Figure 3.23: scaled ground motion acceleration of the selected records for design of the seismic loading patterns... 73 Figure 3.24: Characteristics of the selected records: a) spectral response (ratio of 5% spectral acceleration to the PGA of record); b) Arias intensity built-up. ... 73 Figure 3.25: Charpy V-notch specimens. ... 74 Figure 3.26: Nominal geometry of the core. ... 79 Figure 3.27: Nominal geometry of the coupons machined from the core plates. ... 79 Figure 3.28: Nominal geometry of the two restrainer systems. ... 80 Figure 3.29: Assembled BRB specimen. ... 80 Figure 3.30: Low-frictional material evaluated for the debonding layer between the core and the restrainer: (1) 3M™ 5453 PTFE Glass Cloth Tape; (2) 3M™ 5181 Skived PTFE Tape; (3) Green Belting 150-5S High Modulus PTFE Tape; (4) DuraSurf ™ ETA UHMW-PE Tape; (5) 3M™ 5430 Squeak Reduction UHMW-PE Tape; (6) Green Belting 130-10A UHMW Polyolefin Tape; (7) DuraSurf ™ STS Silicone threated surface UHMW; (8) Dow Corning Molykote® D-321 R Anti-Friction Coating (Molybdenum disulphide MoS2); and (9) SLIP Plate® No. 1 graphite dry lubricant. ... 81 Figure 3.31: Longitudinal strain gages installed on the restrainer exterior surface (R2). ... 81 Figure 3.32: Preparation of restrainer R1 for the testing Specimen 2: a) surface cleaning by methyl ethyl ketone; b) application of UHMW-PE self-adhesive liner. ... 82 Figure 3.33: Application of graphite dry lubricant on the counterface of restrainer R1 for the testing Specimen 3. ... 82
Figure 3.34: Application of PTFE self-adhesive liner on the core of Specimen 11; b) spackled knife-plate hinge to measure the local strains using Data Image Correlation system. ... 82 Figure 3.35: Application of bolt pretension using calibrated wrench. ... 83 Figure 3.36: Schematic view of the BRB test setup. ... 83 Figure 3.37: String potentiometers for measuring the average axial deformation in the yielding segment of the BRB core. ... 83 Figure 3.38: LVDTs for measuring the restrainer movement and the knife-plate hinge rotation at the fixed end of Specimen 7. ... 84 Figure 3.39: Installed BRB specimen in the load frame. ... 84 Figure 3.40: Instrumentation for transverse strain measuring: a) plan view (Specimen 7 before closing the restrainer); b) installed specimen (Specimen 11). ... 85 Figure 3.41: Lubrication of the end spacer’s counterface using Molybdenum disulphide dry lubricant spray (Specimen 7). ... 85 Figure 3.42: Schematic view of an instrumented bolt. ... 85 Figure 3.43: Setup for calibration of instrumented bolts. ... 86 Figure 3.44: a) calibration; and b) re-calibration loading history for instrumented bolts. Note: response of bolt #2 is shown. ... 86 Figure 3.45: Load-strain response of instrumented bolt to the calibration loading history. The bolt gage factor is denoted by “gf” at the right upper corner of each plot. ... 87 Figure 3.46: Arrangement of the instrumented bolts... 88 Figure 3.47: The spackled exterior surface of restrainer R1b to monitor local strains. ... 88 Figure 3.48: Peak ductility and cumulative plastic ductility of the constant strength SDOFs designed for Victoria, BC under 44 ground motion records from M9.1 Tohoku megathrust earthquake. ... 89 Figure 4.1: Seismic hazard de-aggregation for 2% in 50 years probability of exceedance of spectral accelerations in Victoria at: a) T = 1.0 s; b) T = 2.0 s. (Data provided by Geological Survey of Canada (Halchuk et al., 2007)). ... 96
Figure 4.2: a) Magnitude and distance of the dominant events for scenarios S1 to S4 of the Victoria example. (Contribution of each event to the hazard is reported in thousandths); b) Total number of initially retrieved records for each event from PEER-NGA West ground motion database (lower bound of the ranges is exclusive and upper bound is inclusive). ... 99 Figure 4.3: Prediction models for Mean Period of acceleration signal: a) Theoretical model (parameters of this model are adopted from (Boore et al., 1997) for generic rock site in western North America); b) Empirical model (coefficients are from regression analysis reported in (Rathje, et al., 2004), forward directivity effects are not included)... 101 Figure 4.4: Correlation matrices (cell brightness increases with higher correlation coefficient) of: a) Intensity, b) Frequency content; and c) Duration IMs calculated for set of 160 initially selected records for M6.125 at 50 km event (absolute value of correlation coefficients (in percent) are shown). For definition of the IMs, refer to (Kramer, 1996; Kempton, et al., 2006; Ye, et al., 2011). ... 105 Figure 4.5: Distribution and scatter of principal parameters of 160 records in the bin M6.125 at 50 km for: a) and d) Amplitude; b) and e) Frequency content; and c) and f) Duration IMs. Shaded areas in the histograms show the ranges of the principal IMs of the refined set... 107 Figure 4.6: Statistical trends of normalized residual of spectral intensity of the refined records, ε, from the expected values as predicted by Boore-Atkinson 2008 GMPE for scenarios a) S1; b) S2; c) S3; and d) S4. (Note: MSE(ε) is the mean squared error between average epsilon of the records and the expected epsilon, i.e. 0, and MP84-16 is the mean of difference between 84th and 16th percentiles of the epsilons)... 109 Figure 4.7: Examples of imposing excessive input energy when frequency content of record is neglected in scaling process: a) High frequency record matched at a long period (9-storey building); and b) Low frequency record matched at a short period (3-storey building) (Note: subscripts and superscripts to periods, T, indicate mode number and the total number of storeys, respectively)... 112 Figure 4.8: Spectra from 6 possible solutions of the ASCE 7 record scaling method: a) Average of scaled spectra; b) Maximum of scaled spectra. (Note: records of set S5-R20 are used in the calculations)... 116
Figure 4.9: Excessive overshooting the target spectrum when conventional period-dependent scaling methods are used for analysis of a 4 storey torsionally-sensitive building by applying: a) MFP method (matched at the torsional mode, T = 2.2 s); b) ASCE 7 (approach 3, matched between 0.45 ≤ T ≤ 3.35 s). ... 118 Figure 4.10: Scaling by the Least Moving Average method for a typical: a) High frequency record; and b) Low frequency record (Calculations performed using 400 points over the 0.1-6.0 s period range using variable period windows with α = 0.5 and β = 1.5). ... 120 Figure 4.11: Variation of the scaling factors for a set of 266 records calculated by LMA method for different window sizes using: a) Constant averaging window; b) Variable averaging window; and c) Variable averaging window with constant β factor. ... 121 Figure 4.12: Comparison between CMS and the trend of scaled spectra obtained by LMA method for set S2-T20. Conditioning period for CMS is set to a) 1.0 s; b) 2.0 s (Note: For LMA, the records are scaled by variable moving average window within Tmin = 0.1 and Tmax = 4.0 s). ... 122 Figure 4.13: Impacts of random- vs trend-based selection refinement on mean and coefficient of variation (COV) of: a) & c) Base shear ratio; and b) & d) Cumulative plastic ductility, for a target ductility = 5.0 for scenario S2 with n = 10, 20 and 40 records (line thickness increase with n). ... 123 Figure 4.14: Influence of the scenario of dominant events and number of records on the average and 84th percentile spectral pseudo-velocity values calculated for trend-based refined and LMA scaled sets of scenarios: a) S1; b) S2; c) S3; and d) S4. Solid and dashed lines represent the average and 84th percentile values, respectively. (Note: MSE (PSVAvg.) and MSE (PSVP84) are the mean squared error between average and 84th percentile spectra, and the 2% in 50 years UHS ordinate, respectively. In MSE calculation, spectral values for range of 0.5 ≤ T ≤ 4.0 s are used). ... 125 Figure 4.15: Statistics of peak ductility obtained from inelastic response history analysis of SDOFs computed for different scenarios, number of records, and scaling methods: a) Un-scaled; b) MFP; c) MSE; and d) LMA (Note: records are refined using the proposed refinement method). ... 127
Figure 4.16: Statistics of normalized hysteresis energy obtained from inelastic response history analysis of SDOFs computed for different scenarios, number of records, and scaling methods: a) Un-scaled; b) MFP; c) MSE; and d) LMA. (Note: records are refined using the proposed refinement method). ... 128 Figure 4.17: Trend of the peak ductility demand of inelastic SDOFs subjected to randomly-refined sets of record from various scenarios and having different set sizes. Scaling is conducted by a) MSE; b) LMA. ... 129 Figure 4.18: Trends of inelastic demand in series of multi-storey buckling-restrained braced frames as the number of records changes. (Note: in ‘a’ filled bar indicates average, and combination of filled and unfilled bars indicate maximum of the demand). ... 132 Figure 4.19: a) Trend of acceleration spectra of 266 LMA-scaled records; Comparison between expected theoretical inelastic demand and the mean and upper percentile of demand as imposed by LMA-scaled set of 266 records. Demand indices are: a) peak ductility; and b) cumulative plastic ductility. (Note: MSE(X) is the mean squared error between expected value and the 88th percentile of LMA results, where is X is the spectral intensity or seismic demand). ... 135 Figure 5.1: a) Typical plan view of the building prototype (only Split-X option is shown); b) Elevation of the 9-storey Split-X and diagonal bracing patterns. ... 148 Figure 5.2: Stability related design parameters for the 9-storey Split-X BRBFs in Victoria (west) and Montreal (east): a) Storey design drift ratios; b) storey shear force amplification due to notional loads; c) total amplification factor of design storey shear force; and d) yielding segment strain demand. ... 156 Figure 5.3: Comparison between first mode analytical BRBF periods (T1) and the NBCC 2010 empirical periods of the buildings designed for: a) Western; and b) Eastern Canada sites. 157 Figure 5.4: a) conceptual modelling of BRBF; b) graphical definition of brace geometry; c) modelling of beam-and-brace-to-column hinge connection; and d) pin brace-to-gusset plate connection. ... 160 Figure 5.5: Spectra of scaled records for: a) Victoria intra–plate; b) Montréal Intra–plate; c) Victoria Intra–plate in soft soil; and d) Victoria Inter–plate. ... 162
Figure 5.6: Frequency content and duration of the basic and alternative sets. Colour-filled and unfilled markers represent values from the basic and alternative set, respectively. For definitions of the measures see (Dehghani, et al., 2016c). ... 163 Figure 5.7: Examples of scaled spectra of the alternative set: a) scaled by MFP method for the
15-storey model; b) scaled by MSE method for the 7-15-storey model. ... 163 Figure 5.8: a) and c) normalized base shear ratio from pushover analysis of the west and east
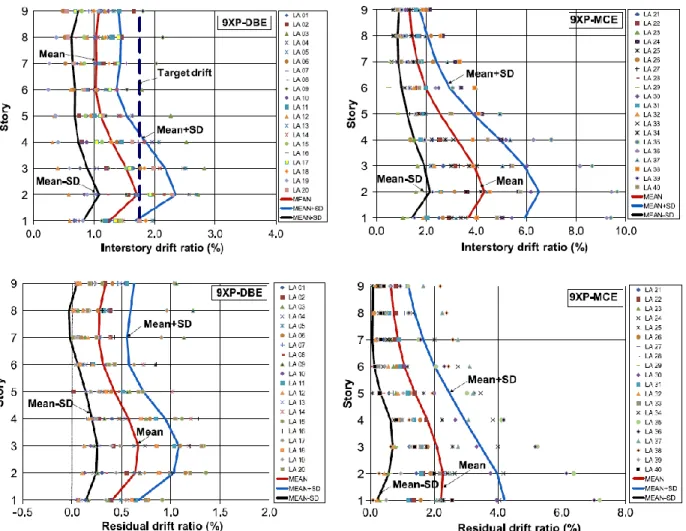
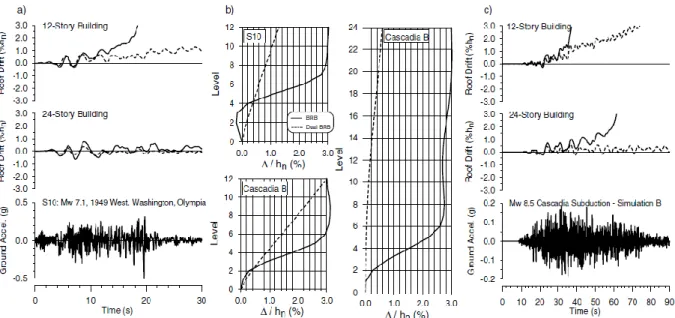
Split-X prototypes on “soft rock” site; b) and d) relation between first mode analytical period and post-yield stiffness of models in west and east. ... 166 Figure 5.9: Peak, and residual storey drift, and peak roof drift ratio demand in the: a) west prototypes under intra–plate event; b) west prototypes under inter–plate event; and c) east prototypes under intra–plate event. Note that the filled and unfilled markers represent the 50th and 84th percentile of the results, respectively. ... 170 Figure 5.10: Comparison between design drift ratio and NTHA results: a) 3W-X-C; b) 9W-X-C; and c) 15W-X-C models. ... 171 Figure 5.11: Comparison between NBCC 2010 design accelerations for diaphragm and
non-structural elements, and the results of nonlinear time history analysis. In some plots, the line representing the design acceleration of non-structural elements is not fully shown to put more emphasis on the diaphragm accelerations. ... 173 Figure 5.12: Effect of data treatment on the computed probability of exceedance of certain performance limit for a) and b) 9W-X-C model; c and d) all west “soft rock” Split-X models combined (3 to 15 storey). ... 176 Figure 5.13: Comparison between estimated ductility demand at design stage and 84th percentile robust estimate of YS ductility amplitude, i.e. ½Δμ1RF, computed from NTHA results of a) 3W-X-C; b) 9W-X-C; and 15W-X-C models. ... 181 Figure 5.14: a) Trends in maximum column demand/capacity ratio (CDCmax) and corresponding κ factor of 15W-X-C model, relative size of circles indicate the intensity of normalized bending moment demand (Mfn) and their colour indicate the floor level; b) Distribution of normalized bending moment demand on critical columns of the 9W-X-C model at all instants
of high axial load, i.e. Cfn ≥ 0.65; c) Trend of normalized axial force demand on the first storey columns of Split-X frames on site classes C and E in western Canada. ... 186 Figure 5.15: Demand spectra for ‘soft soil’ and ‘soft rock’ ground motion record suites compiled for intra–plate hazard in: a) and b) Victoria (west Canada); c) and d) Montréal (east Canada). ... 188 Figure 5.16: Comparison between demand parameters obtained from analysis of Split-X
prototypes designed for site soil class C and E in Victoria (Prototypes were subjected to ground motion set representing intra–plate hazard). ... 189 Figure 5.17: a) Normalized axial force demand versus κ factor in the columns of the 7W-D-C building. ... 193 Figure 5.18: Vertical frame irregularity in prototype 9W-X-C and its impact on: a) storey stiffness; b) storey drift ratios... 197 Figure 5.19: Adjusted cumulative probability distribution of various important global and local demand parameters for Split-X models under west intra–plate source. ... 204 Figure 5.20: Adjusted CDF of: a) maximum column demand/capacity ratio, CDCmax; b) normalized bending moment demand on columns at the time of CDCmax; c) moment gradient factor at time of CDCmax; and d) moment gradient factor at all occasions of large axial forces (i.e. Cfn ≥ 0.65). ... 206 Figure 6.1: Specimen geometry used in: a) tensile; b) cyclic; and c) complementary cyclic tests at Laval University (dimensions in mm). ... 219 Figure 6.2: Variable-amplitude loadings: a) step-loading histories; b) seismic-loading blocks. . 222 Figure 6.3: a) Lateral bracing of the actuator, b) and c) deformed shape of specimens tested in the laterally unbraced and braced load frame conditions, respectively (specimens tested under cyclic constant ±4% strains at room temperature). ... 223 Figure 6.4: Cold temperature test set-up for: a) tensile tests; and b) cyclic tests (lateral bracing system is not shown). ... 224 Figure 6.5: Cyclic test setup: a) Test fixture; b) distribution of temperature in the testing fixture at steady state conditions from heat transfer finite element analysis (the plot shows the measured
annex temperature history applied as the film temperature to a part of the fixture model inside the annex 𝐾 is the coefficient of thermal conductivity, 𝐶𝑝 is the specific heat, 𝛾 is the density, and ℎ𝑐 is the convective heat transfer coefficient). ... 226 Figure 6.6: Comparison of tensile response of 350WT steel at room and subfreezing condition (−40 °C). ... 227 Figure 6.7: Fracture mode of the Charpy V-notch specimens tested at: a) room (+24 °C); b) −40 °C; and c) −50 °C... 228 Figure 6.8: a) Hysteresis response in +PL [1.0X] experiment; b) trend of dissipated energy per pass in the seismic-loading tests. ... 233 Figure 6.9: Failure under variable-amplitude loadings. ... 234 Figure 6.10: Fitted test results to fatigue life models: a) simplified strain-life; and b) energy-life (total strain energy density). ... 236 Figure 6.11: Prediction of fatigue damage (or failure life) using strain-life model for: a)
Step-loading patterns; and b) Seismic-Step-loading patterns. ... 243 Figure 6.12: Prediction of fatigue damage (or failure life) using the Ellyin energy-life model for: a) Step-loading; and b) Seismic-loading patterns. ... 245 Figure 6.13: Prediction of fatigue damage (or failure life) using Lagoda-Macha energy-life model for: a) Step-loading; and b) Seismic-loading patterns. ... 247 Figure 7.1: a) Typical steel-encased BRB member; b) Weak axis local buckling of the core and longitudinal friction under axial compressive strains; and c) Stress-strain response of steel under cyclic inelastic loading. ... 255 Figure 7.2: a) Core buckling between FP and SP along the core; b) Forces acting on the inclined portion of a single buckling half-wave; and c) to g) some possible waveforms (adopted from (Bregoli, et al., 2016)). ... 258 Figure 7.3: a) Tangent and effective steel moduli, and cyclic yield resistance in a compression loading half-cycle (from cyclic test on a stocky specimen); b) Comparison between tangent, effective, and reduced moduli (values for 2nd cycle of loading is shown, 𝑛𝑐 = 2). Note: Reduced modulus is computed for a rectangular section. ... 260
Figure 7.4: Variation of the tangent modulus, effective modulus, and cyclic yield stress (RyFy = 361 MPa). ... 262 Figure 7.5: Finite element simulation results of specimen 2Dcs0.46 in (Metelli, et al., 2016): a) Hysteresis of axial force and normal thrust; b) and c) Deformed shapes of the core and contact pressure contour at 1.5% and 2.0% axial strains, respectively (Y-axis deformation is magnified by factor of 25). ... 273 Figure 7.6: FE analysis of specimen 2Dcs0.46 in (Metelli, et al., 2016): a) Distribution of axial strain between SP and FP at the end of the compressive excursion of the 2nd cycle with amplitudes of 0.5, 1.0, 1.5, and 2.0% strain; b) and c) Hysteresis responses at FP and SP, respectively. ... 274 Figure 7.7: Geometry and specification of Specimen 9 tested in Dehghani, et al. (2016b). ... 275 Figure 7.8: Models for estimating the restrainer stiffness: a) 3D finite element model of a restrainer segment (one- quarter of segment is modelled); b) and c) Simple models with 1-dimentional elastic beam elements; and d) plan, cross-section, and elevation views of the restrainer segment. ... 276 Figure 7.9: Axial force and normal thrust hysteresis from FE analysis for Sets 1, 2, and 3. ... 278 Figure 7.10: Deformed shapes and contours of contact pressure from FE analysis of Sets 1, 2, and 3 at the end of the 2nd cycle of loading at the given strain amplitude (Displacements along Y-axis are magnified by a factor of 75). ... 279 Figure 7.11: Continuous beam concept to estimate internal action in restrainer. ... 284 Figure 8.1: a) Geometry of the BRB core; b) and c) Restrainer R1 and R2; and c) Plan view of the assembled BRB with restrainer R1. ... 293 Figure 8.2: a) Elevation of the test setup; b) Beam-brace-column joint, and top and bottom gusset plates prior to connecting the BRB specimens; c) End rotations and bending moment demand induced by storey drifts. ... 297 Figure 8.3: a) and b) Shear and tensile force demands on the snug-tight bolts, respectively; c) Distance between point of moment transfer and gusset plate (see Eq. (8.13)); d) Normal thrust and frictional force due to core buckling. ... 303
Figure 8.4: a) General view of the test setup (Specimen 6); b) Insertion of BRB into the upper gusset slot; and c) Anchorage of the lower gusset plate to the laboratory strong floor. ... 306 Figure 8.5: Instrumentation: a) to monitor displacement in the yielding segment of the specimens; and b) and c) tracing transverse deformation of core. ... 307 Figure 8.6: a) Schematic view of BRB cross-section (PTFE-Stainless steel interface condition shown); b) location and position of strain gauges to monitor internal actions in the BRB member. ... 308 Figure 8.7: Schematic view of an instrumented bolt; b) arrangement of the instrumented bolt in Specimen 9. ... 308 Figure 8.8: Three-stage cyclic (TSC) loading pattern. ... 309 Figure 8.9: Hysteresis response of Specimens 2 to 12 (Sn-Pm indicates the response of Specimen n to the mth stage of loading; the interfacial condition is specified at the lower right corner of the plots). ... 314 Figure 8.10: a) Deformed shape of Specimen 6 at the end of test; b) Shearing of standard hole in the end filler sheet of Specimen 6; and c) Fractured core of Specimen 7 under FF seismic loading. ... 320 Figure 8.11: a) and b) Strong-axis buckling of the core in Specimen 11; c) Weak-axis buckling of the core in Specimen 12. ... 320 Figure 8.12: Hysteresis response of Specimen 9, 7, 11, and 12 during the last loading stage. ... 321 Figure 8.13: Buckling wave amplitude of: a) Specimen 11; b) Specimen 12. (Ly,f is the final length of the yielding segment). ... 322 Figure 8.14: a) and b) Moment-rotation response; and c) and d) axial force versus bending moment demand on the bottom and top knife plate hinge, respectively. Tension to compression loading path is indicated by the unfilled arrows. ... 324 Figure 8.15: Frictional force in a BRB with: a) SLR = 0.5 (stopper at mid-length); and b) SLR = 1.0 (stopper at end). ... 325 Figure 8.16: a) History of the restrainer movement in Specimen 9; b) Slip length ratios of selected specimens. Note: data in a) and b) are from the TSC-P1 loading. ... 326
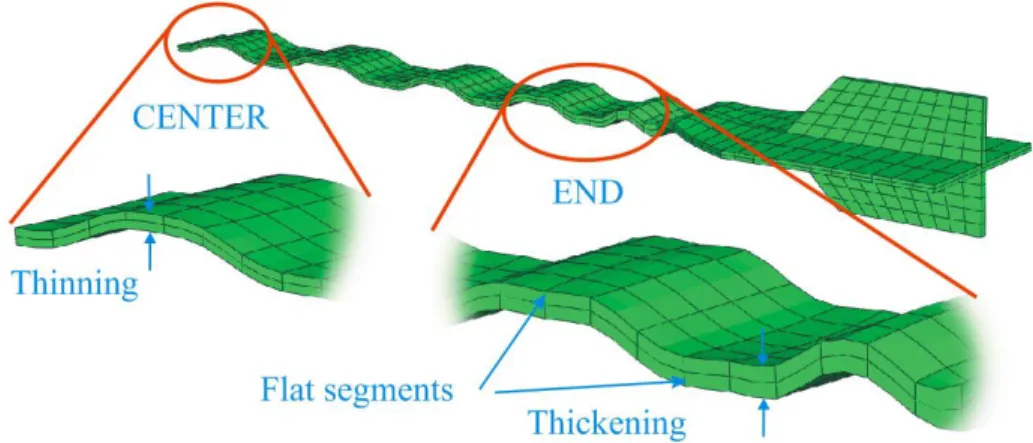
Figure 8.17: Strain at the mid-length of Specimen 12 during the TSC-P1 loading. ... 327 Figure 8.18: Specimen 9 under the TSC-P1 loading: a) Full history of the change in bolt tension (Tf = current tension; Tb = pretension); b) Change in the bolt preload during the last compressive excursion (from +90 to −90 mm). ... 329 Figure 8.19: Joint diagram obtained from finite element simulation. ... 330 Figure 8.20: Change in the core cross-section size along the yielding segment: a) width; and b) thickness. Note: positive and negative values indicate section budging and shrinkage, respectively. ... 331 Figure 8.21: Locations of fracture and close-up views of the fractured zone for selected specimens.
... 332 Figure 9.1: Ratio of inelastic to elastic peak displacement vs ratio of SDOF period to mean period of ground motion. ... 338 Figure 9.2: Comparison between bias in the estimated response of a SDOF system when ground motions are scaled by: a) MFP (a conventional method), and b) LMA methods. Note: elastic period of SDOF is 1.4 s. ... 340 Figure 9.3: Considered diagonal braced frame configurations. ... 341 Figure 9.4: Considered chevron braced frame configurations. ... 342 Figure 9.5: Relative steel tonnage-efficiency of different considered braced frame configurations: a) system with diagonally braced panels; b) system with chevron braced panels. ... 342 Figure 9.6: Pushover deformed shape of the 9-storey Split-X prototypes at roof design displacement: a) Victoria, b) Montréal, Note: displacement magnified by factor of 10; c) frame response at the first three storeys of the 9-storey Victoria and Montréal models, note: dots indicate the time instant that roof reached to the design displacement. ... 343 Figure 9.7: Statistical distribution of storey drift demand on 3- to 15-storey Split-X prototypes in Victoria site class C: a) maximum drift, b) residual drift. ... 344 Figure 9.8: Overload occasions of the first storey diaphragm in 5-storey Split-X BRBF designed for soil class C site in Victoria. ... 346
Figure 9.9: Test setup for subfreezing experiments. ... 349 Figure 9.10: Comparison between tensile behaviour under two conditions: quasi-static rate at room temperature, and dynamic rate at subfreezing temperature. ... 349 Figure 9.11: Tensile monotonic response of circumferentially notched specimens at room and subfreezing temperature. ... 350 Figure 9.12: Response of 350WT steel to symmetric and asymmetric strain loading. ... 352 Figure 9.13: Comparison between hardening behaviour under step-wise and constant amplitude tests. ... 353 Figure 9.14: Response of 350WT steel under asymmetric stress cycles. ... 354 Figure 9.15: Response of steel02 model to asymmetric stress cycles ... 354 Figure 9.16: Deformed shape of a BRB core at 6% shortening: a) 3D (continuum), and b) 2D (plane stress) model; c) total normal thrust as a function of analysis time; d) axial force vs axial shortening. ... 357 Figure 9.17: BRB specimen with stainless steel–PTFE interfacial condition. ... 359 Figure 9.18: a) 3D view of an assembled BRB specimen, b) loading frame with installed BRB specimen. ... 359 Figure 9.19: a) Close-up view of the loading frame gusset plate, b) lateral response of loading frame without BRB specimen. ... 360 Figure 9.20: Comparison between supplied 350WT steel in two phased of research: a) stress vs strain; b) normalized stress vs strain. ... 361
LIST OF SYMBOLS AND ABBREVIATIONS
Symbols𝐴𝑐 Cross-sectional area of core 𝐴𝑟 Cross-sectional area of restrainer 𝐶 Back stress hardening modulus 𝐶𝑓 Axial force demand on column
𝐶𝑝 Specific heat
𝐶𝑟 Factored axial force resistance of column
𝐷 Fatigue damage
𝐷5−95 Significant duration (a duration intensity measure) 𝐷Brk. Bracketed duration (a duration intensity measure) 𝐷Uni. Uniform duration (a duration intensity measure) 𝐷𝐿𝐶𝐹 Low cycle fatigue damage
𝐸 Young modulus
EL Elongation at fracture
𝐸𝑒𝑓𝑓 Effective hardening modulus
𝐸𝑡 Tangent modulus at the end of compressive excursion 𝐹𝑢 Ultimate tensile stress
𝐹𝑦,0.2% Lower yield stress measured by 0.2% offset method 𝐹𝑦,𝑈𝑝𝑝𝑒𝑟 Upper yield stress
𝐹𝑦𝑟 Nominal yield stress of the restrainer 𝐼𝑐 Core minor-axis moment of inertia
𝐼𝑟 Section moment of inertia of BRB restrainer 𝐾 Coefficient of thermal conductivity
𝐾′ Cyclic strength coefficient
𝐾∗ Coefficient of master curve (for non-Masing materials) 𝐾𝑒,min Minimum constraining stiffness
𝐾𝑒 Total available constraining stiffness against gap opening 𝑲𝑒 Elastic stiffness matrix of structure
𝐿𝑏𝑟 BRB work-point length
𝐿𝑒 Length of elastic non-yielding segment 𝐿𝑠 Slip length along core yielding segment 𝐿𝑠𝑐 Length of core yielding segment
𝐿𝑡 Moment transfer length
𝐿𝑦,𝑓 Deformed length of core yielding segment 𝐿𝑦 Length of core yielding segment
𝐿𝑦 Length of core yielding segment 𝐌 Mass matrix of structure
𝐌 Moment magnitude
𝑀𝑓 Bending demand on column
𝑀𝑘 Bending demand on knife-plate joint 𝑀𝑝,𝑘 Plastic moment capacity of knife-plate joint
𝑀𝑟 Bending moment demand on restrainer due to second-order effects 𝑀𝑟 Column factored bending resistance
𝑁 Normal thrust
𝑁𝑓 Number of cycles to failure
𝑁𝑓 Number of significant inelastic excursions 𝑃 Axial force acting on core
𝑃 Axial load
P50 Fiftieth percentile P84 Eighty-forth percentile P96 Ninety-sixth percentile
𝑃avg Average of maximum axial compressive and tensile force 𝑃max Maximum compressive design force
𝑃𝑐𝑟,𝑒 Elastic critical buckling load 𝑃𝑒 Euler buckling load of BRB 𝑃𝑓 Total accumulated frictional force
𝑃𝑛 Maximum compressive axial load carried by core 𝑃𝑦,𝑘 Axial yield resistance of knife-plate joint
𝑃𝑦 Actual yield strength of BRB 𝑃𝑦𝑐 Axial yield strength of BRB core 𝑄∞ Maximum change in yield size
R Generic distance from earthquake source to site 𝑅 Ratio of minimum to maximum strain in a half-cycle RA Area reduction at fracture
𝑅𝑎 Average surface roughness
𝑅𝑑 Ductility related response modification factor 𝑅𝑜 Overstrength related response modification factor 𝑅𝑦 Ratio of actual to nominal yield stress
𝑅𝑦𝐹𝑦 Actual yield stress of core 𝑆𝑎 Spectral acceleration
𝑆𝑎(𝑇 ) Spectral acceleration at a period 𝑇
𝑆𝑎Record(𝑇 ) Spectral acceleration of as-recorded ground motion at period 𝑇 𝑆𝑎Target(𝑇 ) Target spectral acceleration for scaling at period 𝑇
𝑆𝑟 Section modulus of restrainer 𝑆𝑥 Restrainer longitudinal bolt spacing 𝑇 Period of vibration
𝑇1 Fundamental period of structure (translational or torsional mode) 𝑇first First center of averaging window
𝑇last Last center of averaging window
𝑇max Maximum period included in the LMA process 𝑇min Minimum period included in the LMA process 𝑇𝐿𝑀𝐴 Period at which LMA scaling method is performed
𝑇𝑏 Bolt tension
𝑇𝑓 Bolt pretension
𝑇𝑖 ith period within the selected period points for LMA method 𝑇𝑚 Mean period of ground motion acceleration
𝑇𝑝𝑆𝑎 Period corresponding to maximum spectral acceleration 𝑇𝑝𝑆𝑣 Period corresponding to maximum spectral velocity
𝑇𝑟 Bolt nominal resistance 𝑇𝑢 Bolt ultimate tensile strength
𝑈 Elastic strain energy stored in the system
𝑈1 Moment amplification factor for compressive members 𝑉 Shear force at base of structure
𝑉 Work due to external loading
𝑉𝑁𝐵𝐶𝐶 Strength-design base shear as per NBCC 𝑉𝑓,𝑏 Shear force on bolts
𝑉𝑠30 Shear wave velocity in the top 30 meters of the site soil deposit 𝑊 Weight per unit length of restrainer
𝑊𝑎 Amplitude of energy density term
𝑊𝑝 Total plastic work in a single loading pass 𝑊𝑝𝑛 Normalized plastic work in the yielding segment 𝑆𝑅0.2/2.0 Ratio of spectral accelerations at 0.2 and 2.0 seconds 𝑋, 𝑌 Random variables
𝑎1, 𝑎2, 𝑎3 Coefficients for cyclic hardening model
𝑎ℎ Ratio of hinge-to-hinge length to the work-point length of BRB 𝑎max Maximum absolute of floor acceleration
𝑎𝑓 History of floor acceleration 𝑏 Fatigue strength exponent
𝑏 Saturation rat of isotropic hardening
𝑏𝑐 Core width
𝑐 Fatigue ductility exponent
𝑒𝑐 Eccentricity of axial load on column 𝑑𝐿 Shortening of a given half-wave
dR Resolution of distance parameter in seismic hazard deaggregation data d𝐌 Resolution of magnitude in seismic hazard deaggregation data
𝑑𝑟 Distance between end of restrainer and gusset plate 𝑔𝑦 Through-width gap between core and restrainer 𝑔𝑧 Through-thickness gap
ℎ Hardening modulus
ℎ𝑐 Convective heat transfer coefficient
𝑘𝑒,𝑙 Longitudinal stiffness of restrainer segment 𝑘𝑒,𝑡 Transversal stiffness of restrainer segment
𝑘𝑒 Constraining stiffness provided by restrainer segment
𝑘𝑟 Locally mobilized constraining stiffness against gap opening ℓ Length of buckling half-wave
n Target number of records for selection
𝑛 Number of buckling waves
𝑛′ Cyclic hardening exponent
𝑛∗ Exponent of master curve (for non-Masing materials) 𝑛𝑅𝐹𝑖 Counted cycles by Rainflow method
𝑛𝑏 Number of bolts along core yielding segment
𝑛𝑐 Number of loading cycle for a given strain amplitude 𝑛𝑖 Number of cycles of damaging events for a given intensity
𝑡𝑐 Core thickness
𝑟 Aspect ratio of knife-plate hinge
𝑣 Core deflection
𝑣 Interstorey relative velocity
𝑥 Distance from knife-plate hinge at the fixed end of brace 𝑥𝑖 Ranked (sorted) random variable
Δ0 Initial gap between core and restrainer
Δroof Roof lateral displacement with respect to the ground ΔΛ𝑅𝐹𝑖 Cycle counted ranges of parameter Λ
Δ𝑏𝑚 Storey design displacement drift
Δ𝑓 Storey drift obtained by elastic analysis under design base shear Δ𝜃𝑝𝑖 Plastic drift angle ranges obtained by cycle counting method Δ𝜉𝑅𝐹𝑖 Rainflow cycle counted ranges of parameter 𝜉
Δ𝜖max Largest strain range in the strain signal
Δ Total gap between core and restrainer
Δ𝑇max Maximum temperature changes in one single pass of seismic-loading Δ𝑊0𝑡 Strain energy corresponding to the fatigue limit
Δ𝑊𝑒+ Elastic strain energy of tensile stress in one cycle Δ𝑊𝑝 Plastic strain energy density in one cycle
Δ𝑊𝑡 Total strain energy density in one cycle Δ𝜇𝑝𝑖 Cycle counted ranges of core plastic ductility Δ𝜖𝑐 Strain range in core yielding segment
Δ𝜖𝑒 Elastic strain range Δ𝜖𝑝 Plastic strain range Δ/ℎ Storey drift ratio
Δ𝑇 Length of averaging window
Δ𝑇 Total temperature changes during test
Δ𝜎 Stress range
Δ𝜖 Strain range
Λ Amplification of design storey drift Ω2 Matrix of eigenvalues
Ω𝑑 Dynamic overstrength at the base of structure Π Total potential energy
∑ 𝜇𝑝 Accumulated plastic ductility in the core yielding segment
∑ 𝜇𝑝 Sum of inelastic displacement an SDOF divided by its yield displacement Σ(d𝜖𝑝) Sum of plastic strain increments (absolute values)
Φ Matrix of eigenvectors
𝛼 Exponent of energy-life fatigue models
𝛼 Factor defines the beginning of averaging window 𝛽 Compressive strength adjustment factor
𝛽 Factor defines the end of averaging window
𝛽2% Compressive strength adjustment factor at 2% storey drift ratio 𝛾 Back stress saturation rate of hardening modulus
𝛾 Buckling shape factor