CHAPTER 7
Carbon dynamics in the eutrophied Belgian
Coastal Zone
Nathalie Gypens1 and Alberto Vieira Borges2
1
Université Libre de Bruxelles (ULB), Ecologie des Systèmes Aquatiques (ESA) , CP221, boulevard du Triomphe, B-1050 Brussels, Belgium
2
Université de Liège, MARE, Unité d’Océanographie Chimique, Institut de Physique B5, B-4000 Sart Tilman, Belgium
7.1 Carbon cycle in coastal waters
Net autotrophic ecosystems, where gross primary production (GPP) exceeds
community respiration (CR), decrease carbon dioxide (CO2) in the surrounding
waters, while net heterotrophic systems, where GPP<CR, enrich the water in
CO2. Net ecosystem production (NEP = GPP-CR) is then one of the main
drivers of the exchange of CO2 between aquatic systems and the atmosphere.
Nevertheless, in coastal environments, the link between the exchange of CO2
with the atmosphere and the ecosystem metabolic status is not always direct (Gattuso et al., 1998; Borges, 2005; Borges et al., 2006). Besides NEP, the net
CO2 flux between the water column and the atmosphere is modulated by other
factors such as other biogeochemical processes (e.g. CaCO3
precipitation/dissolution), temperature and hydrodynamics (horizontal advection,
down and up-welling of waters with different CO2 concentration, residence time,
decoupling between organic carbon production and degradation within the water column).
Eutrophication manifests as a general increase of phytoplankton production and sometimes changes in planktonic composition in coastal zones (Billen et al.,
1991; Cloern, 2001). The effect of eutrophication on NEP and air-water CO2
fluxes has been investigated with the one-box global Shallow-water Ocean Carbonate Model (SOCM; Andersson & Mackenzie, 2004). This model
simulates a decrease of the CO2 emission from the coastal ocean to the
atmosphere since pre-industrial times and a neutral flux at present time (Andersson & Mackenzie, 2004; Mackenzie et al., 2004; 2005). This evolution is
explained by the combination of atmospheric CO2 rising and NEP enhancement
by the increased discharge of anthropogenic nutrients. Poorly investigated at the regional and local scale, the carbon dynamics in eutrophied coastal ecosystems is discussed in this chapter based on a synthesis of carbon
measurements and model simulations obtained in the Scheldt river plume, the Belgian Coastal Zone (BCZ) and adjacent marine waters.
7.2 Present-day carbon cycle in the Scheldt river plume
Figure 7.1 shows the time series of the partial pressure of CO2 (pCO2), air-water
CO2 fluxes (FCO2) and NEP obtained in front of the Zeebrugge harbour
between 2001 and 2004. As suggested by Borges and Frankignoulle (1999; 2002), this station is influenced by Scheldt waters and the observed carbon dynamics is representative of the Scheldt river plume. As shown on Figure 7.1a,
surface waters are under-saturated in CO2 with respect to atmospheric
equilibrium during spring and over-saturated during the rest of the year with the maximum over-saturation observed in late-summer. The NEP seasonal evolution shows a transient but pronounced autotrophic period occurring every spring but with a different timing (early April in 2001 and 2002, mid April in 2003
and 2004) and amplitude (maximal values ranging from 134 mmol m-2 d-1 in
2004 to 269 mmol m-2 d-1 in 2003; Fig. 7.1c). This autotrophic period can be
ascribed to the diatom-Phaeocystis spring bloom (e.g. Rousseau et al., 2002; 2008). It is followed by a marked heterotrophic period corresponding to zooplankton grazing (Daro et al., 2008) and bacterial degradation of the organic matter produced during spring (Rousseau et al., 2002). In summer, a net autotrophic event was recorded in 2001 and 2003, and a balanced metabolic status in 2002 and 2004 (Fig. 7.1c). This variability might be explained by the year-to-year fluctuation in time and amplitude of summer phytoplankton growth (Breton et al. 2006; Rousseau et al., 2008). Late summer is clearly characterized by net heterotrophy that decreases during fall, and a nearly balanced metabolic status is observed in winter.
At the annual scale the nearshore waters behave as a net heterotrophic system in 2001, 2002 and 2004, but autotrophic in 2003 (Table 7.1). Net heterotrophy of the Scheldt estuarine plume has been previously shown by Borges and Frankignoulle (2002) based on a simple organic carbon input/output budget.
This latter suggests that CO2 emission to the atmosphere observed in the
nearshore waters is only partly due to the input of CO2 from the Scheldt.
Therefore the net heterotrophy estimated for the nearshore waters must be subsidized by external inputs of organic carbon that can originate from either coastal tributaries and/or from the Scheldt.
The potential degradation of the organic matter discharged into the BCZ by the
Scheldt, estimated to 0.8-2 (Wollast, 1976) and 0.7-1.8 mol C m-2 yr-1 (Wollast,
1983), would correspond to a carbon flux of the same order of magnitude than the NEP values computed here (Table 7.1). These figures are however higher than those provided by Borges and Frankignoulle (2002) and based on the Soetaert and Herman (1995)’s estimations of organic matter discharged by the
Scheldt, i.e. between 0.3 and 0.6 mol C m-2 yr-1 depending on the surface area
0 250 500 750 1000 JFMAMJJASOND JFMAMJJ ASOND JFMAMJJASOND JFMAMJJ ASOND pCO 2 (µatm) 2001 2002 2003 2004 -40 -20 0 20 40 60 80 JFMAMJJASOND JFMAMJJ ASOND JFMAMJJASOND JFMAMJJ ASOND FCO 2 (mmol m -2 d -1) -300 -200 -100 0 100 200 300 JFMAMJJASOND JFMAMJJ ASOND JFMAMJJASOND JFMAMJJ ASOND NEP (mmol m -2 d -1)
a
b
c
0 250 500 750 1000 JFMAMJJASOND JFMAMJJ ASOND JFMAMJJASOND JFMAMJJ ASOND pCO 2 (µatm) 2001 2002 2003 2004 -40 -20 0 20 40 60 80 JFMAMJJASOND JFMAMJJ ASOND JFMAMJJASOND JFMAMJJ ASOND FCO 2 (mmol m -2 d -1) -300 -200 -100 0 100 200 300 JFMAMJJASOND JFMAMJJ ASOND JFMAMJJASOND JFMAMJJ ASOND NEP (mmol m -2 d -1)a
b
c
Figure 7.1 Time series of pCO2 (a), FCO2 (b) and NEP (c) in the Scheldt plume at a fixed
station off the Zeebrugge harbour. NEP is estimated from a mass balance of dissolved inorganic carbon (Borges et al., 2008).
Table 7.1. Scheldt winter freshwater discharge (Q) computed as the average of January and December of the previous year, and annual averages of pCO2, air-sea gradient of
pCO2 (?pCO2), FCO2 and NEP at a fixed station off the Zeebrugge harbour.
Q m3 s-1 pCO2 µatm ?pCO2 µatm FCO2 mol m-2 yr-1 NEP mol m-2 yr-1 2001 348 481 107 3.6 -4.2 2002 302 480 97 3.2 -3.8 2003 393 527 136 4.6 2.4 2004 210 533 153 6.6 -5.7
The pronounced spring (Fig.7.1c) and annual (Table 7.1) NEP computed in
2003 could be due to the stronger Scheldt discharge in winter (393 m3 s-1; Table
7.1) The latter increases the delivery of nutrients from diffuse source but not of organic matter from point source stimulating therefore the GPP without modifying heterotrophy sustained by allochthonous organic carbon. Supporting this, Gypens et al. (2004) showed in a model study comparing two contrasted years that annual GPP in the BCZ could increase by about 27% for an increase
of wintertime fresh water discharge from about 100 to 350 m3 s-1. Interestingly,
despite their net autotrophic status in 2003, the nearshore coastal waters were
estimated to act as net source of CO2 for the atmosphere (Table 7.1). This
confirms that a fraction of this CO2 emission is sustained by CO2 inputs from the
Scheldt (Borges & Frankignoulle, 2002; Schiettecatte et al., 2006) that would also be expected to increase with freshwater discharge.
The stronger annual heterotrophy computed for 2004 than for 2001 and 2002 could be due to a transient accumulation of part of the excess organic matter produced in 2003. Hence, we hypothesize that part of the non-steady accumulation of organic matter from 2003 to 2004 occurred in the sediments. Sedimentation of organic matter is important in the BCZ in agreement with the fact that nearshore sediments in the BCZ are exceptionally rich in organic carbon compared to the rest of the North Sea (Wollast 1976; de Haas et al. 2002; Vanaverbeke et al., 2008).
7.3 Present-day annual budget of NEP and FCO
2along the
Scheldt river-Southern Bight of the North Sea continuum
Based on the present results obtained in nearshore waters influenced by the Scheldt, those of Gazeau et al. (2005) for the Scheldt estuary, and those of Schiettecatte et al. (2007) for the Southern Bight of the North Sea (SBNS), we
established an annual budget of NEP and FCO2 along a continuum from the
Scheldt estuary to the SBNS (Fig. 7.2).
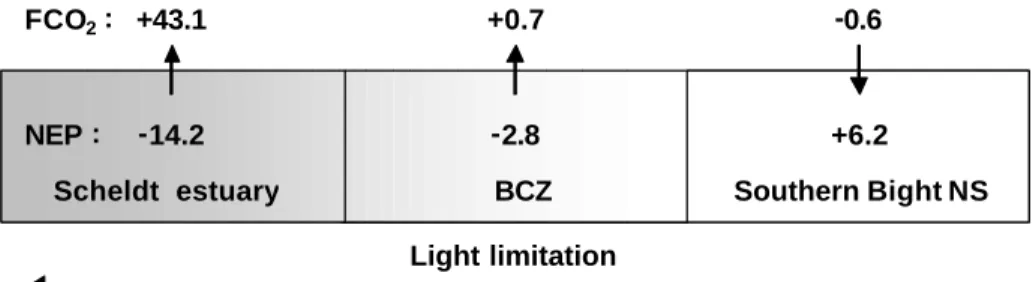
Scheldt estuary BCZ SouthernBight NS
Ratio allochtonousorganiccarbon inputs : inorganicnutrientinputs Light limitation NEP: FCO2: -2.8 +0.7 -0.6 +6.2 -14.2 +43.1
Figure 7.2. Annual budgets of NEP and FCO2 along a continuum from the Scheldt
The figures obtained are in agreement with the conceptual model of Borges et
al. (2006) whereby estuaries are strong sources of CO2 sustained by a net
heterotrophic metabolism, while temperate continental shelves act as sinks of
CO2 sustained by efficient carbon export. Also, estuaries are effective reactors
for organic matter mineralisation, hence strong sources of CO2 and inorganic
nutrients to the adjacent coastal ocean that acts as a sink for atmospheric CO2
(at temperate latitudes). Finally, this also confirms the role of physical settings in
determining the auto or heterotrophic status and direction of air-sea CO2 fluxes
in river plumes, whereby well mixed systems do not export efficiently organic
matter and act as sources of CO2, while stratified river plumes export organic
matter across the pycnocline and act as sinks of CO2 (Borges, 2005).
7.4 Past evolution of carbon dynamics in the BCZ in relation
to eutrophication and increased atmospheric CO
27.4.1 Effect of eutrophication on NEP and air-sea CO2 fluxes
The impact of changing human activities on the watershed and increased
atmospheric CO2 over the past 50 years on the role as sink or source for
atmospheric CO2 of the BCZ was investigated using a coupled river-coastal
model. The R-MIRO-CO2 model results from the off-line coupling between two
biogeochemical models, the RIVERSTRAHLER river model (e.g. Billen et al., 1994) and the marine MIRO model (Lancelot et al., 2005) including a
description of the carbonate system (MIRO-CO2; Gypens et al., 2004). Details
on the coupling between RIVERSTRAHLER and MIRO are provided in Lancelot
et al. (2007). For this application, the R-MIRO-CO2 model was implemented in a
multi-box frame from the Eastern Channel to the Belgian coastal zone (Fig. 6.2). Model simulations were performed using daily wind speed and sea surface
temperature and monthly atmospheric CO2. Nutrient river inputs were provided
by the RIVERSTRAHLER model applied to the Seine and Scheldt river systems. RIVERSTRAHLER implementation and description of meteorological forcing and nutrient point and diffuse sources at the scale of the Seine and Scheldt river systems over the past 50 years are reported in respectively Billen
et al. (2001) and Billen et al. (2005). For both basins, the following forcing
functions to the model were documented for the period 1950-2000: year-to-year variation of rainfall by 10 days period; land use modifications by 10 year period; changes in annual urban and industrial wastewater discharges by 5 year period. Model results are here shown in terms of historical evolution of nutrient and
carbon loads as well as annual air-sea CO2 fluxes and NEP simulated in the
BCZ.
Figure 7.3 shows the evolution of total nitrogen (Ntot), phosphorus (Ptot), dissolved silicate (DSi) and organic carbon annual loads simulated by the RIVERSTRAHLER model for the Seine and the Scheldt rivers between 1951 and 1998. The annual carbon and nutrient fluxes delivered by both rivers show similar trend but the magnitude of the nutrient loads delivered by the Seine is higher than by the Scheldt (about 5, 10 and 3 times respectively, for Ntot, Ptot and DSi). This results from the higher water discharge of the Seine while
nutrient concentrations are similar in both rivers (not shown). However, the organic carbon inputs from the Scheldt are up to three times higher than the Seine loads during the eighties (Fig. 7.3.d).
1950 1960 1970 1980 1990 2000 0 25 50 75 100 125 150 0 10 20 30 40 50 Seine Scheldt kT N yr -1 kT N yr -1 1950 1960 1970 1980 1990 2000 0 5 10 15 20 0 1 2 3 4 5 Seine Scheldt kT P yr -1 kT P yr -1 1950 1960 1970 1980 1990 2000 0 25 50 75 100 Seine Scheldt kT Si yr -1 1950 1960 1970 1980 1990 2000 0 5 10 15 20 Seine Scheldt T C yr -1 a b c d
Figure 7.3. Evolution between 1951 and 1998 of Ntot (a), Ptot (b), DSi (c) and organic carbon (d) annual loads from the Seine and the Scheldt. Seine: left scale; Scheldt: right scale.
Although some part of the nutrient and organic carbon loads inter-annual variability can be attributed to the river discharge (not shown), the long-term trend simulated over the past 48 years results from the changing nutrient and carbon emissions to surface water in response to modification of human activities on the watershed. From 1950 to 1965, Ntot, Ptot and DSi loads stay relatively constant both for the Seine and the Scheldt rivers (Fig. 7.3). As a result of the combined effect of increasing leaching of agricultural soils and rising emissions from domestic and industrial activities (Billen et al., 2001; 2005), the annual Ntot fluxes delivered by the Seine show, after 1965, a clear
increase up to values greater than 100 kt N yr- 1 during the 1990’s (Fig. 7.3.a). A
similar increase is simulated for the Scheldt with annual Ntot loads reaching 30
kt N yr- 1 in 1990. In parallel, annual Ptot loads from the Seine and the Scheldt
increase by a factor 5 between 1965 and 1985 (Fig. 7.3.b). After 1985, P loads progressively decrease until 1998 when values corresponding to those
simulated in 1960’s are obtained. This decrease results from the removal of PO4
in washing powders as well as the improved treatment of urban effluents (Billen
et al., 2001; 2005). The simulated inter-annual variability of dissolved silicate
the river DSi concentration stays relatively constant. Organic carbon loads, as Ntot and Ptot loads, show, after 1960, a marked increase in response to human development in the watershed before decreasing in the mid-eighties due to the implementation of waste water treatment plants (Fig. 7.3.d).
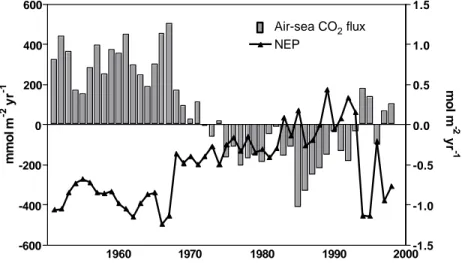
R-MIRO-CO2 simulations obtained for the BCZ (Fig. 7.4) show marked historical
changes in both NEP and air-sea CO2 fluxes. Annual NEP shows important
inter-annual fluctuations, with annual simulated values ranging between -1.24
and + 0.44 mol C m-2 yr-1 in respectively 1966 and 1992 (Fig. 7.4). From 1950 to
1967, the BCZ is shown as net heterotrophic with NEP values between -0.68
and -1.24 mol C m-2 yr-1. From 1967 to 1982, the BCZ ecosystem is still
heterotrophic but the NEP strongly decreases to value near zero (-0.2 mol C m-2
yr-1). Over the next ten years (1983-1993), the BCZ is shifted from net
heterotrophy to net autotrophy and NEP values of +0.3 mol C m-2 yr-1 are
simulated in 1989 and 1992. After 1993, the system returns to heterotrophy up to the end of the simulated period and NEP values are close to those simulated before 1967 except in 1996 (Fig. 7.4).
The simulated annual air-sea CO2 fluxes also show important inter-annual
fluctuations between 1951 and 1998 (Fig. 7.4). Air-sea CO2 flux simulated by
the model is positive when the flux is directed from the sea to the atmosphere
meaning that the BCZ acts as a source for atmospheric CO2. From 1951 to
1970, the BCZ is clearly releasing CO2 towards the atmosphere when estimated
on an annual basis. The magnitude of this source ranges between 0.03 and 0.5
mol C m-2 yr-1 without any clear trend. The simulated trend of annual air-sea
CO2 flux decrease to values close to zero between 1970 and 1974 after which it
reverses to negative values (Fig. 7.4). From 1975 to 1993, the BCZ is a net
sink for atmospheric CO2 with a maximal value of -0.4 mol C m
-2
yr-1 in 1985. After 1985, the magnitude of the sink gradually decreases and, between 1994
and 1998, the BCZ becomes again a net source of CO2 excepted in 1996.
1960 1970 1980 1990 2000 -600 -400 -200 0 200 400 600 -1.5 -1.0 -0.5 0.0 0.5 1.0 1.5 Air-sea CO2 flux NEP mmol m -2 yr -1 mol m -2 yr -1
Figure 7.4. Evolution between 1951 and 1998 of annual air-sea CO2 fluxes (left scale)
7.4.2 Factors affecting air-sea CO2 fluxes variability in the eutrophied BCZ
Seawater temperature, wind speed, atmospheric CO2 and carbon and nutrient
loads directly or/and indirectly are constraining air-sea CO2 fluxes. While wind
speed and atmospheric CO2 only directly affect carbonate chemistry, carbon,
nutrients and temperature also indirectly modulate the magnitude of this flux by controlling autotrophic and heterotrophic activities in the water column. The
importance of the variability of these forcings for the simulated air-sea CO2 flux
in the BCZ is estimated by comparison to their importance in 1951. The
contribution of each forcing to the annual air-sea CO2 flux variability is
investigated based on the comparison between model results obtained using real forcing for the 1951-1998 period and those obtained by running
R-MIRO-CO2 with the 1951 values of either temperature, wind speed, atmospheric CO2
or carbon and/or nutrient loads for each year of the considered period.
The comparison of annual air-sea CO2 fluxes simulated using real and 1951
values of temperature, wind speed and atmospheric pCO2 suggests that the
inter-annual variability of these forcings has no significant influence on the
magnitude and the direction of the simulated air-sea CO2 flux for the 1951-1998
period (not shown). Similarly, temperature variability has no major influence on long-term trend of NEP (not shown).
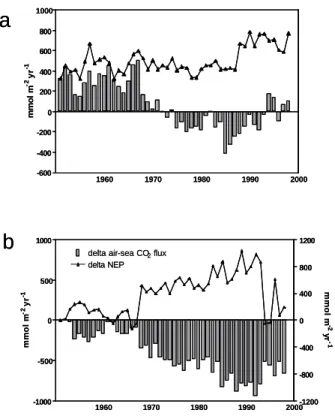
Most of the variability of air-sea CO2 fluxes computed with the R-MIRO-CO2
model between 1951 and 1998 is due to river loads (Fig. 7.5). When compared to the reference simulation, the use of 1951 nutrient and carbon loads for both the Seine and the Scheldt leads to an important modification of the magnitude
and the direction of the annual air-sea CO2 flux. When using 1951 river loads
(carbon and nutrients) for each year of the simulated period, BCZ is annually
net heterotrophic (not shown) and acts as a source for CO2 during the whole
period. Comparison of annual air-sea CO2 fluxes obtained when using real and
1951 river loads shows that river loads increase the autotrophy and the sink capacity of the BCZ from 1951 to 1998. The magnitude of this sink stays relatively constant between 1951 and 1967, after what it progressively increases up to 1992 when river loads are maximal. Increase of the sink due to river loads can be related to both N and P load increases. After 1992, the decrease of P loads, in spite of sustained elevated N ones, limits primary
production (Lancelot et al., 2007) in the BCZ and the associated air-sea CO2
sink. This imbalance in N and P delivery explains the simulated CO2 source
from 1993 to 1998.
As a general pattern, the simulated magnitude of air-sea CO2 fluxes in the BCZ
is significantly related to the variations of the nutrient and carbon loads from the Seine and the Scheldt. When comparing the respective effect of Seine and
Scheldt loads variability on the air-sea CO2 flux, the model results evidence a
similar impact of both rivers during the 1950’s after which the Seine is
suggested to have a larger influence on the simulated annual air-sea CO2 flux in
1960 1970 1980 1990 2000 -600 -400 -200 0 200 400 600 800 1000 mmol m -2 yr -1
a
1960 1970 1980 1990 2000 -600 -400 -200 0 200 400 600 800 1000 mmol m -2 yr -1a
1960 1970 1980 1990 2000 -1000 -500 0 500 1000 -1200 -800 -400 0 400 800 1200 delta air-sea CO2 fluxdelta NEP mmol m -2 yr -1 mmol m -2 yr -1
b
1960 1970 1980 1990 2000 -1000 -500 0 500 1000 -1200 -800 -400 0 400 800 1200 delta air-sea CO2 fluxdelta NEP mmol m -2 yr -1 mmol m -2 yr -1
b
Figure 7.5. Relative contribution of carbon and nutrient river loads to air-sea CO2 fluxes
computed from 1951 to 1998. Comparison of air-sea CO2 fluxes computed using real
forcing (grey bar) and 1951 (triangle) value for Seine and Scheldt river loads (a) and the delta air-sea CO2 flux (grey bar) and delta annual NEP (triangle) computed as the
difference between model results obtained using real and 1951 carbon and nutrient loads (b).
7.5 Conclusions
Using an observation-based approach and a modeling tool, we show that
air-water CO2 fluxes and NEP are subject to strong inter-annual variability in the
BCZ mainly driven by riverine inputs of nutrients. We also show that NEP is one
of the main drivers of air-water CO2 fluxes in the BCZ but there is not a perfect
match between direction of the CO2 fluxes and the ecosystem autotrophic or
heterotrophic status. Nevertheless, both approaches are converging and suggest that, for present day conditions, the BCZ is net heterotrophic and acts
as a source of CO2 to the atmosphere.
The reconstruction of NEP and air-water CO2 fluxes over the last 50 years
suggests that the BCZ shifted from a CO2 source during the 1960’s and 1970’s
to a sink during the 1980’s and 1990’s, explained by increased eutrophication.
Due to imbalanced nitrogen to phosphorus loads, the BCZ shifted back to a CO2
source in the late 1990’s. While eutrophication during the 1970’s and 1980’s leads to quantitative and qualitative phytoplankton changes with undesirable
effects (Lancelot, 1995; Lancelot et al., 2007), our model results suggest that it was accompanied by a strong carbon sink.
This points an important but so far neglected coupling between nutrient regulation and mitigation of the emission of greenhouse gases that must be evaluated jointly in management policies. We also show that the link between nutrient delivery to the coastal zone and atmospheric carbon pumping is complex. Sustained long-term monitoring along inshore-offshore gradients is then required to further unravel and constrain this link and to refine and validate model tools to improve predictions on the future evolution of biogeochemical functioning of the coastal zone and hence guide decision makers and managers.
7.6 References
Andersson A.J. and F.T. Mackenzie. 2004. Shallow-water oceans: a source or sink of atmospheric CO2? Frontiers in Ecology and the Environment 2(7): 348-353
Billen G., Garnier J. and P. Hanset. 1994. Modelling phytoplankton development in whole drainage networks: The RIVERSTRAHLER model applied to the Seine river system. Hydrobiologia 289: 119-137
Billen G., Garnier J., Ficht A. and C. Cun. 2001. Modeling the response of water quality in the Seine river estuary to human activity in its watershed over the last 50 years. Estuaries 24 (6B): 977-993
Billen G., Garnier J. and V. Rousseau. 2005. Nutrient fluxes and water quality in the drainage network the Scheldt basin over the last 50 years. Hydrobiologia 540: 47-67 Billen G., Lancelot C. and M. Meybeck. 1991. N, P and Si retention along the Aquatic
Continuum from Land to Ocean. In: Ocean Margin Processes in Global Change. R.F.C Mantoura, J-M. Martin and R. Wollast (Eds), Dahlem Worshop Reports, Wiley, pp. 19-44
Borges A.V. and M. Frankignoulle. 1999 Daily and seasonal variations of the partial pressure of CO2 in surface seawater along the Belgian and southern Dutch coastal
areas. Journal of Marine Systems 19: 251-266
Borges A.V. and M. Frankignoulle. 2002. Distribution and air-water exchange of carbon dioxide in the Scheldt plume off the Belgian coast. Biogeochemistry 59(1-): 41-67 Borges A.V. 2005. Do we have enough pieces of the jigsaw to integrate CO2 fluxes in the
Coastal Ocean ? Estuaries 28(1): 3-27
Borges A.V., Schiettecatte L.-S., Abril G., Delille B. and F. Gazeau. 2006. Carbon dioxide in European coastal waters. Estuarine, Coastal and Shelf Science 70(3): 375-387
Borges A.V., Ruddick K., Delille B. and L.-S. Schiettecatte 2008. Net ecosystem production and carbon dioxide fluxes in the Scheldt estuarine plume, BMC Ecology, in review
Breton E., Rousseau V., Parent J.-Y.,Ozer J. and C. Lancelot. 2006. Hydroclimatic modulation of diatom/Phaeocystis blooms in nutrient-enriched Belgian coastal waters (North Sea). Limnology and Oceanography 51(3): 1401-1409
Cloern, J.E.. 2001. Our evolving conceptual model of the coastal eutrophication problem. Marine Ecology Progress Series 210: 223-253
Daro N., Breton E., Antajan E., Gasparini S . and V. Rousseau. 2008. Do Phaeocystis colony blooms affect zooplankton in the Belgian coastal zone? In: Current Status of Eutrophication in the Belgian Coastal Zone. V. Rousseau, C. Lancelot and D. Cox (Eds). Presses Universitaires de Bruxelles, Bruxelles, pp. 61-72
De Haas H., Van Weering T.C.E. and H. De Stigter. 2002. Organic carbon in shelf seas: sinks or sources, processes and products. Continental Shelf Research 22: 691–717 Gattuso J.-P., Frankignoulle M. and R. Wollast. 1998. Carbon and carbonate metabolism
in coastal aquatic ecosystems. Annual Review Ecology Systematics 29: 405-433 Gazeau F., Gattuso J.-P., Middelburg J.J., Brion N., Schiettecatte L.-S., Frankignoulle
M. and A.V. Borges. 2005. Planktonic and whole system metabolism in a nutrient-rich estuary (the Scheldt estuary). Estuaries 28(6): 868-883
Gypens N., Lancelot C. and A.V. Borges. 2004. Carbon dynamics and CO2 air-sea
exchanges in the eutrophicated coastal waters of the southern bight of the North Sea: a modelling study. Biogeosciences 1(2): 147-157
Lancelot, C., 1995. The mucilage phenomenon in the continental coastal waters of the North Sea. Science Total Environment 165: 83-102
Lancelot C., Spitz Y., Gypens N., Ruddick K., Becquevort S., Rousseau V., Lacroix G. and G. Billen. 2005. Modelling diatom and Phaeocystis blooms and nutrient cycles in the Southern Bight of the North Sea: the MIRO model. Marine Ecology Progress Series 289: 63-78
Lancelot C., Gypens N., Billen G., Garnier J. and V. Roubeix. 2007. Testing an integrated river–ocean mathematical tool for linking marine eutrophication to land use: The Phaeocystis-dominated Belgian coastal zone (Southern North Sea) over the past 50 years. Journal of Marine Systems 64(14): 216-228
Mackenzie F.T., Andersson A.J., Lerman A. and Ver L.M. 2005. Boundary exchanges in the global coastal margin: Implications for the organic and inorganic carbon cycles. In: The Global Coastal Ocean- Multi-scale Interdisciplinary Processes. Robinson A.R. and K.H. Brink (Eds.), , Harvard University Press, Cambridge. Pp 193-225
Mackenzie F.T., Lerman A. and A.J. Andersson. 2004. Past and present of sediment and carbon biogeochemical cycling models. Biogeosciences 1(1): 11-32
Rousseau V., Leynaert A., Daoud N. and C. Lancelot. 2002. Diatom succession, silicification and silicic acid availability in Belgian coastal waters (Southern North Sea). Marine Ecology, Progress Series 236: 61–73
Rousseau V., Park Y., Ruddick K., Vyverman W., Jans S. and C. Lancelot. 2008. Phytoplankton blooms in response to nutrient enrichment. In: Current Status of Eutrophication in the Belgian Coastal Zone. Rousseau V., Lancelot C. and D. Cox (Eds). Presses Universitaires de Bruxelles, Bruxelles, pp. 45-59
Schiettecatte L.-S. 2006 The carbon cycle in the Southern North Sea Region. PhD Thesis, Université de Liège, Belgium. 130 pp
Schiettecatte L.-S., Gazeau F., Van der Zee C., Brion N. and A.V. Borges. 2006. Time series of the partial pressure of carbon dioxide (2001-2004) and preliminary inorganic carbon budget in the Scheldt plume (Belgian coast waters). Geochemistry, Geophysics, Geosystems G3, Vol. 7 Q06009. doi: 10.1029/2005GC001161
Schiettecatte L.-S., Thomas H., Bozec Y. and A.V. Borges. 2007. High temporal coverage of carbon dioxide measurements in the Southern Bight of the North Sea. Marine Chemistry 106(1-2): 161-173
Soetaert K. and P.M.J. Herman. 1995. Carbon flows in the Westerschelde estuary (The Netherlands) evaluated by means of an ecosystem model (MOSES). Hydrobiologia 311: 247-266
Vanaverbeke J., Franco M., van Oevelen D., Moodley L., Provoost P., Steyaert M., Soetaert K. and M. Vincx. 2008. Benthic responses to sedimentation of phytoplankton on the Belgian Continental Shelf. In: Current Status of Eutrophication in the Belgian Coastal Zone. Rousseau V., Lancelot C. and D. Cox (Eds). Presses Universitaires de Bruxelles, Bruxelles, pp. 73-90
Wollast R. 1976. Transport et accumulation de polluants dans l’estuaire de l’Escaut. In: Project Mer, Rapport Final. Nihoul J.C.J. and R. Wollast (Eds), Vol 10 :196-218. Services du premier Ministre Programmation de la politique scientifique, Belgium
Wollast R. 1983. Interactions in Estuaries and Coastal waters. In: The major Biogeochemical Cycles and their Interactions. Bolin B. and R.B. Cook (Eds), Wiley and Sons, London