HAL Id: dumas-01264251
https://dumas.ccsd.cnrs.fr/dumas-01264251
Submitted on 29 Jan 2016HAL is a multi-disciplinary open access archive for the deposit and dissemination of sci-entific research documents, whether they are pub-lished or not. The documents may come from teaching and research institutions in France or abroad, or from public or private research centers.
L’archive ouverte pluridisciplinaire HAL, est destinée au dépôt et à la diffusion de documents scientifiques de niveau recherche, publiés ou non, émanant des établissements d’enseignement et de recherche français ou étrangers, des laboratoires publics ou privés.
Does the glucagon-like peptide-1 act through the vagal
afferent neurons to modulate anxiety, food neophobia
and food reward behaviour?
Marie Rouault
To cite this version:
Marie Rouault. Does the glucagon-like peptide-1 act through the vagal afferent neurons to modulate anxiety, food neophobia and food reward behaviour?. Life Sciences [q-bio]. 2015. �dumas-01264251�
Does the glucagon-like peptide-1 act through the
vagal afferent neurons to modulate anxiety, food
neophobia and food reward behaviour?
Par : Marie ROUAULT
Soutenu à Paris le 28 septembre 2015
Devant le jury composé de : Président : Daniel Tomé
Maître de stage : Wolfgang Langhans, excusé, remplacé par Jean-Philippe Krieger
Enseignant référent : Nicolas Darcel
Les analyses et les conclusions de ce travail d'étudiant n'engagent que la responsabilité de son auteur et non celle d’AGROCAMPUS OUEST
AGROCAMPUS OUEST CFR Angers CFR Rennes Année universitaire : 2014-2015 Spécialité : Agronomie
Spécialisation (et option éventuelle) : Sciences et technologies de la biologie, l’alimentation et la nutrition humaine
Mémoire de Fin d'Études
d’Ingénieur de l’Institut Supérieur des Sciences agronomiques, agroalimentaires, horticoles et du paysage
de Master de l’Institut Supérieur des Sciences agronomiques, agroalimentaires, horticoles et du paysage
Acknowledgements
I wish to thank Professor Wolfgang Langhans for welcoming me within his Physiology and Behaviour Laboratory and his supervision. I thank Doctor Nicolas Darcel for his academic supervision within AgroParisTech.
I particularly thank Jean-Philippe Krieger, PhD student within the Physiology and Behaviour Laboratory for his kind advice, his close supervision and time devoted to the project.
I also thank Melanie Klarer, PhD student within the Physiology and Behaviour Laboratory, for her previous advice and help during the experiments. I am also grateful to Professor Urs Meyer, Doctor Abdelhak Mansouri and Marie Labouesse, PhD student within the Physiology and Behaviour Laboratory, for their unevaluable advice. I also wish to thank Doctor Shin Lee for her supervision.
I also thank all the personal, PhD and Master student of the laboratory, for the pleasant atmosphere within the laboratory.
Table of Contents
Acknowledgements ... Table of figures ... Table of appendixes ... List of abbreviations ... Introduction ... 1Materials and methods ... 5
I. Virus Production (lentivirus-mediated short hairpin RNA interference LV-shRNAi). ... 5
II. Animals and housing ... 5
I. Surgery procedure ... 5
II. Functional verification of GLP-1R kd by intraperitoneal injection of exendin-4 ... 7
I. Behaviour experiments ... 9
1) Experimental test order and condition ... 9
1) Test assessing anxiety ... 9
2) Test assessing the reward value of food ... 13
3) Food intake record ... 16
II. Statistical Analysis ... 17
Results ... 19
I. Verification of the VAN GLP-1R kd ... 19
1) VAN GLP-1R kd did not reduce their food intake after functional verification by intraperitoneal exendin-4 injection ... 19
2) VAN GLP-1 R kd did not affect body weight and daily food intake of chow food... 19
II. VAN GLP-1 R kd showed short-term changes in palatable food intake ... 21
1) Short-term changes in palatable food intake during first exposure in home cage ... 21
2) First exposure in home cage to a new non-palatable food did not induce change at short-term ... 21
III. Assessment of innate anxiety, food neophobia and reward value of food ... 23
1) VAN GLP-1R kd did not significantly affect measures of innate anxiety in the elevated plus maze and open field tests ... 23
2) VAN GLP-1R kd did not significantly affect measures of fear towards novel food in the food neophobia test ... 23
3) VAN GLP-1R kd failed to show a palatable food-induced side preference in a CPP paradigm ... 25
4) VAN GLP-1R kd showed identical behaviour in an incentive runway paradigm ... 27
5) VAN GLP-1R kd did not show clear difference enabling interpretation in the taste reactivity test ... 27
Discussion ... 28
I. Relevance of the VAN GLP-1R kd model ... 28
1) The importance of the vagus nerve as a mediator of intestinal GLP-1 ... 28
2) The choice of the lentivirus strategy for a VAN GLP-1R kd ... 28
II. Further interpretation of the results ... 30
1) Body weight and daily food intake of chow food and functional verification ... 30
2) Short-term changes in palatable food intake ... 30
3) Anxiety test: innate anxiety and food neophobia ... 31
4) Reward value of food ... 31
III. Going back to the literature to find link GLP-1R kd with a reduced hedonic appreciation of food 33 1) From gut-GLP-1 to the NTS... 33
2) From the NTS to the Ventral Tegmental Area (VTA) and the Nucleus Accumbens (NAc) ... 34
3) Overview of the neurobiological mechanisms involved in food reward ... 34
4) Central GLP-1 implication in food reward ... 35
IV. Hypothesis explaining a decrease in hedonic appreciation of palatable food at short term ... 36
1) Three plausible hypothesis ... 36
2) Two preliminary observation in favour of the hypothesis of a compensatory mechanism at the central level ... 36
V. Further research to test our hypothesis ... 37
1) Reflexion about the next step of the project ... 38
2) Clues for further research ... 39
VI. Reflexion about the relevance and scope of our project for society and scientific implications of the research ... 39
Conclusion about a six-month master thesis ... 41
Appendixes ... 43
References ... 51 French summary / Résumé français ... English summary ...
Table of figures
Figure 1: VAN GLP-1R kd model. GLP-1R: Glucagon-Like Peptide-1 Receptor. ... 2
Figure 2: Daily food intake of Ctl and GLP-1R kd rats after swith to HFD ... 4
Figure 3: Details of the surgery procedure for lentivirus injection... 6
Figure 4: The elevated plus maze apparatus ... 10
Figure 5: The open field apparatus ... 10
Figure 6: The food neophobia apparatus ... 10
Figure 7: The conditioned place preference apparatus ... 12
Figure 8: The incentive runway apparatus ... 14
Figure 9: Taste reactivity apparatus ... 14
Figure 10: Camera picture of a rat licking the sweet vanilla flavoured water ... 14
Figure 11: Apparatus for the solution measures ... 16
Figure 12: Functional verification of the VAN GLP-1R by IP Ex-4 injection ... 18
Figure 13: Body weight, daily food intake of chow food ... 18
Figure 14: 2% sucrose consumption upon 2 days and 4% sucrose consumption upon 1 day of Ctl and GLP-1R kd ... 20
Figure 15: Raspberry flavoured sweet milk consumption upon 3 days (milk is removed after 4H of exposure) of Ctl and GLP-1R kd ... 20
Figure 16: 2% dextran consumption upon 1 day of Ctl and GLP-1R kd ... 20
Figure 17: In the EPM, percent time spent in open arm and total distance moved of Ctl and GLP-1R kd ... 22
Figure 18: In the OF, time spent in CZ and total distance moved of Ctl and GLP-1R kd ... 22
Figure 19: Latency to eat on day 1 and day 2 of Ctl and GLP-1R kd rats in the food neophobia test. ... 22
Figure 20: In the CPP, percent of time spent on both side on habituation session and test day, percent of rising time on test day relative to habituation session, milk consumed, of Ctl and GLP-1R kd ... 24
Figure 21: In the incentive runway, completion speed and time to start the meal of Ctl and GLP-1R kd ... 26
Figure 22: In the taste reactivity, total number of licks, number of licking bouts, number of licks per bout and number of paw licking of Ctl and GLP-1R kd ... 26
Figure 23: Number of c-fos activated neurons in the NTS of Ctl and GLP-1R kd after GLP-1 or vehicule (PBS) injection ... 37
Table of appendixes
Appendix 1 : « GLP-1R in enteric neurons » (Fig.5 from Richards et al., 2014) ... 43 Appendix 2: Complements to the results of the functional verification of the VAN GLP-1R kd by IP Ex-4 injection ... 44 Appendix 3: In the elevated plus maze test, total time spent in the different zones in Ctl and GLP-1R kd ... 45 Appendix 4: In the open field test, total distance moved in the arena as a function of 5 min time bins in Ctl and GLP-1R kd ... 46 Appendix 5: Milk consumption during the habituation to the goal box and test days of the incentive runway test in Ctl and GLP-1R kd ... 47 Appendix 6: Further tests confirming the efficiency and tissue-specifcity of a VAN GLP-1R kd (Fig.1 from Krieger et al.,Diabetes, 2015) ... 48 Appendix 7: Baseline 24 hours water intake upon 2 days of Ctl and GLP-1R rats ... 49 Appendix 8 : Schematic overview of projection from the NTS showing dopaminergic projections (Childs et
List of abbreviations
CA: Closed Arm Ctl: Control
CCK: Cholecystokinine
CPP: Conditioned Place Preference test CZ: Central Zone
DPP-IV: Dipeptidal-petidase-IV Ex-4: Exendin-4
Ex-9: Exendin-9
EPM: Elevated Plus Maze test FI: Food intake
GFP: Green Fluorescent Protein GLP-1: Glucagon-like peptide-1
GLP-1 R: Glucagon-like peptide-1 receptor
GLP-1 R kd: Knock-down of the glucagon-like peptide-1 receptor HEK 293 cells: Human Embryonic Kidney 293 cells
HFD: High Fat Diet IP: Intraperitoneal kd: knock-down
LV-shCTL: lentiviral particles control
LV-shGLP-1R: lentiviral particles targeting GLP-1R
LV-shRNAi: lentivirus-mediated short hairpin RNA interference
min: minute
mRNA: messenger RNA NAc: Nucleus Accumbens ND: Nodose Ganglion NT: Neurotransmitter
NTS: Nucleus tractus solitarius or Nucleus of the solitary tract OA: Open Arm
OF: Open field test PYY: Peptide YY PPG: Preproglucagon
qPCR: Quantitative Polymerase Chain reaction s: seconds
SDA: Subdiaphragmatic vagal deafferentation SEM: Standard Error of the Mean
shRNA: short hairpin RNA interference
VAN: Vagal afferent neurons
VAN GLP-1 R kd: knock-down of the glucagon-like peptide-1 receptor in vagal afferent neurons Veh: Vehicle
1 | P a g e
Introduction
The development of obesity and type-2 diabetes has become a major health issue and represents an increasing burden on our societies and healthcare systems. The foremost explanation for these epidemics is the challenge exerted on the homeostatic regulation of energy balance by an obesogenic environment (Zheng and Berthoud, 2007; Zheng and Berthoud, 2008). Indeed, overeating beyond the metabolic needs is a crucial behaviour leading to obesity.
Obviously social and cultural factors also contribute to the epidemic, and it is now thought that some persons have a favourable nature and genetic predisposition to develop obesity in obesogenic environment (Berthoud and Morrison, 2008; Yeo and Heisler, 2012). A policy involving multiple strategies (health policy, lifestyle changes, physical activity, food diet habits, surgical and drug treatment) would enable to fight against these metabolic disorders. Thus understanding of physiological and neurological mechanisms related to obesity and T2D aim at finding potential target to develop new treatments.
Food intake is regulated by intermingled neuronal pathways that can be divided into those responsible for the regulation of metabolic processes and those responsible for cognitive and hedonic processes. Simplistically, the homeostatic control of food intake can be defined as the motivation to eat depending on the energy status of the body (Berthoud, 2002) while the hedonic control drives the motivation to consume rewarding food (Zheng and Berthoud, 2008).
Glucagon-like peptide-1 (GLP-1) is one of the satiety gut-derived hormones identified as a target to fight metabolic disorders. GLP-1 results from post-translational transformation of proglucagon. Peripheral GLP-1 is released by enteroendocrine L-cells from the intestinal tract in response to nutrients stimulation. GLP-1 is also secreted at the central level by a subset of neurons in the nucleus of the solitary tract (NTS).
GLP-1 was firstly described as an incretin hormone (Holst and Gromada, 2004). Indeed it is considered as the most stimulating agent enhancing the glucose-stimulated insulin secretion (Burcelin and Hosokawa, 2001), acting on the glucagon-like peptide-1 receptor (GLP-1R) of pancreatic β-cells via an endocrine mechanism (Doyle and Egan, 2007). A neuroincretin mechanism for the action of GLP-1 is also highly suspected (Nishizawa et al., 1996; see Donath and Burcelin, 2013 for review, Krieger et al., Physiol Behav, 2015). Thus pharmacological GLP-1R agonists such as exendin-4 (Ex-4) have been developed and are currently used in type 2 diabetes treatments. However GLP-1 effect on satiety and glycemia is not totally understood.
GLP-1 is rapidly degraded in the systemic circulation by the enzyme dipetidyl-peptidase-4 (DPP-IV) (1-2 minute half-life) (Deacon et al., 1995). This limits GLP-1’s potential endocrine actions onto central GLP-1R and suggests the existence of a paracrine signalling complementary to the endocrine pathway (Deacon et
2 | P a g e
Figure 1: VAN GLP-1R kd model. GLP-1R: Glucagon-Like Peptide-1 Receptor.
NTS: Nucleus Tractus Solitarius. NG: Nodose Ganglia. VAN: Vagal Afferent Neurons. DPP-IV: Dipeptidyl peptidase-4. L-cell: enteroendocrine L-cells.
NTS
NG
GLP-1 R
Bilateral nodose ganlion injection of Lentivirus-shRNAi
3 | P a g e
GLP-1R are also expressed in the brain, notably in reward areas (VTA, NAcc …). Recent studies explored the possibility that central GLP-1R activation can also modulate the reward value of food. Injection of GLP-1 in the NAcc was first shown to decrease food intake, involving for the first an area known for its role in reward processing in the control of food intake by GLP-1 (Dossat et al., 2011). Centrally-administered Ex-4 (intra-VTA and intra-NAcc) decreased the reward value of food (Dickson et al., 2012). Another study showed that blockade of GLP-1R by GLP-1R antagonist exendin-9 (Ex-9) in reward areas increased food intake (Alhadeff
et al., 2012) and palatability (Dossat et al., 2013). These studies suggest a role for mesolimbic GLP-1R in
controlling food intake by modulating the reward value of food. These studies, however, involve a pharmacological activation of central/mesolimbinc GLP-1R and do not test whether GLP-1 secreted by the projections of NTS GLP-1 neurons play a physiological role in a similar process.
The vagus nerve innervates several organs located in the thoracic and abdominal cavities (Berthoud and Neuhuber, 2000), including the gut. Vagal afferent neurons end in the NTS, in the hindbrain. Thus it enables communication between the gut and the brain. It has been shown that vagal afferent neurons mediate gut peptides stimuli such as cholecystokinin (CCK) or GLP-1 and also mechanical stimuli such as gastric distension (see for review: de Lartigue, Physiol Behav, 2014).
Vagal afferent neurons (VAN) express the GLP-1R (Nakagawa et al., 2004) and terminate in the lamina propria of the intestinal mucosa, thus being able to sense the release of GLP-1 by L-cells (Richards et al., Diabetes, 2014) (Appendix 1). This implies that the vagus nerve may mediate a signal given by GLP-1 to the brain. Yet, the role of peripheral GLP-1 through the vagus nerve and the brain, on food intake control and glycemia, as well as its signalling pathway, is not fully understood (see Krieger et al., Physiol Behav, 2015 for review). To test the role of VAN in mediating the peripheral GLP-1’s effect on food intake and glycemia, our lab achieved a specific knock-down of the GLP-1R (GLP-1R kd) in the vagal afferent neurons (VAN GLP-1R kd, the abbreviation GLP-1R kd is used afterwards to design the group of rats with this model) in rats (Fig.1). A lentivirus vector carrying the short hairpin RNA sequence targeting the GLP-1R was injected in the left and right nodose ganglia (NG) of the vagus nerve. Thus, these rats have a markedly reduced expression of GLP-1R in the vagal afferent neurons (50 to 60% lower GLP-1R mRNA expression in the nodose ganglia). Several aspects of GLP-1R on the vagus nerve have already been explored confirming the hypothesis that GLP-1 activated GLP-1R on VAN to mediate a neural component reducing post-meal glycemia, acting on satiation by decreasing food intake and slowing down gastric emptying (Krieger et al., Diabetes, 2015, accepted). Indeed, GLP-1R kd rats had bigger meals when fed ad libitum with normal chow food compared to control rats, but not higher daily food intake (FI) owing to a longer meal interval compensation. Moreover, another characteristic observed on GLP-1R kd rats was a blunted insulin peak after a meal.
4 | P a g e
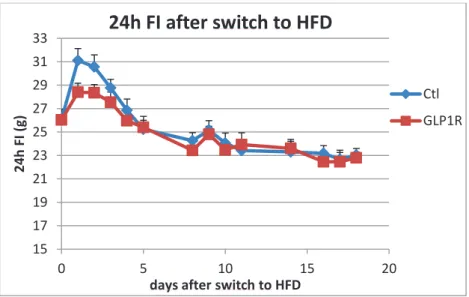
Besides, a preliminary observation of this model showed that GLP-1R kd rats had a lower food intake than control rats during the initial hyperphagic phase (0 to 5 days) when switched to a high fat diet (HFD) (60% from energy coming from fat) (Fig. 2, data from our laboratory not published yet). Then after five days, both GLP-1 R kd and control rats had the same food intake.
This observation led to the hypothesis that VAN GLP-1R differentially modulates food neophobia or the reward value of new palatable food. Moreover, based on other data from our lab showing a link between vagal afferents and innate anxiety (Klarer et al., J. Neurosci., 2014), we also tested whether innate anxiety could be also modulated in the VAN GLP-1R kd model.
Our study explores for the first time the implication of peripheral GLP-1 on hedonic control through the vagus nerve. It aims at answering the following question: "does the glucagon-like peptide-1 receptor act through the vagal afferent neurons to modulate anxiety, food neophobia and food reward behaviour?" To test this, we used the same model of Sprague-Dawley rats with a VAN GLP-1R kd as an efficient selective method to explore the role of vagal mediation of GLP-1 effects. We submitted rats to a series of behavioural tests assessing consumption of palatable food (sucrose and milk preference test) and non-palatable food (dextran preference test), innate anxiety (elevated plus maze and open field tests), food neophobia (food neophobia test) and food reward behaviour (conditioned place preference, incentive runway, taste reactivity).
Figure 2: Daily food intake of Ctl and GLP-1R kd rats after swith to HFD
While switched to HFD, GLP-1R kd rats displayed a lower food intake during the first 3 days following new exposure. After 3 days food consumption is same between control and GLP-1R kd rats.
15 17 19 21 23 25 27 29 31 33 0 5 10 15 20 2 4 h FI ( g )
days after switch to HFD
24h FI after switch to HFD
Ctl GLP1R
5 | P a g e
Materials and methods
I.
Virus Production (lentivirus-mediated short hairpin RNA interference LV-shRNAi).
Lentiviral particles were produced following a published protocol (Krieger et al., Diabetes, 2015, accepted). A plasmid pLKO.1 (Sigma-Aldrich) expressed turbo Green Fluorescent Protein (GFP) and the U6 promoter driven shRNA sequence targeting the rat GLP-1R mRNA (for the lentiviral particles targeting GLP-1R (LV-shGLP-1R)) or a non-target shRNA sequence (for the lentiviral particles control (LV-shCTL)). We used the plasmids psPAX2 and pMD2G (Didier Trono, Addgene, #12259 and 12260) for the lentiviral construct. Briefly, lentiviral particles were transfected in Human Embryonic Kidney 293 cells (HEK 293 cells) with lipofectamine 2000 (4uL/mL of media, Life technologies) during 20 hours. The media containing the lentiviral particles was harvested 3 days after transfection (cells expressing GFP) and was concentrated using polyethylene glycol (PEG) 6000 (8% PEG 6000 and 0.3M NaCl in final concentration). Following a ten-fold serial dilution of the concentrated viral solution, and then infection of HEK 293T cells, the virus titre was measured by counting the number of cells expressing GFP. Unfortunately the desire concentration of 1010 particles/mL was not reached. Our concentrated viral solution contained 106 particles/mL. Thus we used a previous production of the same lentivirus to knock down GLP-1 R in vagal afferent neurons.
II.
Animals and housing
Seventeen adult male Sprague Dawley rats from ETH Schwerzenbach animal breeding facility were used in the study. Rats were five to seven weeks old (145-275 g body weight) upon reception and were housed in groups of three animals per cage (one cage had two animals) in acrylic cages with wood shaving floor (type IV, 595 × 380 × 200 mm) with 12/12 hour (h) light/dark cycle (dark onset from 08:00 to 20:00 h) at 21°C, 55-60% humidity. Unless specified otherwise, animals had ad libitum access to water and standard chow (Kliba 3436; Provimi Kliba Nafag, metabolisable energy: 3.13kcal/g). Before surgery, animals were acclimatized for one week and handled on a daily basis to habituate them to the experimenter. All experiments were approved by the Cantonal Veterinary Office of Zurich (license number 124/2014). Body weight was regularly measured along the study.
I.
Surgery procedure
Two days before surgery, rats were fed with a special diet consisting of wet mash (unsweetened condensed milk mixed with powder chow, Kliba 3433; Provimi Kliba Nafag). The day before surgery, rats were fed with unsweetened condensed milk only. This diet was continued until three days after surgery. Then they were re-habituated to their standard chow with ad-libitum access.
6 | P a g e
Figure 3: Details of the surgery procedure for lentivirus injection
A (from Krieger et al., Diabetes, 2015, accepted, Fig.1A): detailed representation of the lentivirus injection
containing LV-shCTL or LV-shGLP-1R in the nodose ganglion. B: Summary of the lentivirus injection
A
7 | P a g e
(5mg/kg, MSD) 1 to 2 hours before anaesthesia and atropine (50 ug/kg, Sintetica, Mendrisio) 15 to 30 min before anaesthesia. Rats were anesthetized by an intraperitoneal (IP) injection of ketamine (88 mg/kg, Ketalar, Kantonsapotheke Zürich) and xylazine (5 mg/kg, Rompun 2%, Kantonsapotheke Zürich). If required, additional ketamine was injected during surgery. Nodose ganglia were exposed. A custom-made glass capillary (50 μm tip) was used to inject 1.5 μL of the lentiviral solution (LV-shCTL or LV-shGLP-1R) into the left and right NG of each rat with a Picospritzer III injector (Parker Hannifin) (Fig. 3A from Krieger et al., Diabetes, 2015, accepted, Fig.1A). Following the surgery, the incision was closed using sutures. Rats were post-treated immediately after the completion of the surgery with a subcutaneous injection of carpofen (5 mg/kg, Norocarp, Ufamed) for analgesia and with an intraperitoneal injection of 3 mL of warm Ringer's lactate solution for rehydration. To ensure expression of the lentiviral constructs and the subsequent GLP-1R knockdown, animals were allowed to recover for 18 days. The control (Ctl) group contained 8 animals and the GLP-1R kd group contained 9 animals (Fig 3B).
II.
Functional verification of GLP-1R kd by intraperitoneal injection of exendin-4
There is no fully admitted functional verification for a VAN GLP-1R kd. IP Ex-4 injection typically leads to a decrease in food intake, which depends on the dose (Mack et al, 2006). Thus this test and assessment of GLP-1R kd was based on previous results (Krieger et al., Diabetes, 2015, accepted): after IP Ex-4 injection related to vehicle (Veh), Ctl rats showed 30% food intake reduction, whereas GLP-1R kd rats showed a 10% reduction.
The GLP-1 R kd was verified by measuring food intake of rats after an intraperitoneal (IP) injection of the GLP-1 agonist Ex-4 0.3 ug/kg (Bachem, this dose already used by Krieger et al., Diabetes, 2015, accepted, was sufficient to detect a difference in food consumed between control and GLP-1R kd rats). This functional verification was performed at the end, when the behaviour experiments and other food intake measures were finished, so as not to impair our behavioural tests by the stress due to IP injection. It also enabled to check if the knock-down (kd) was still efficient at the end of the study. Animals were trained on 3 days for restraining and IP injection prior to the experiment. Habituated to be single-caged, animals were food deprived when dark onset began for 3 h. Then they were injected with Ex4 or NaCl in a crossover design, with 2 days of wash out between the two injections, and had ad libitum access to their food cup filled with their usual powder chow (Kliba 3436; Provimi Kliba Nafag). Food intake was measured after 1 h, 2 h, 4 h and 24 h.
9 | P a g e
I.
Behaviour experiments
1) Experimental test order and condition
Behavioural tests started 18 days after surgery. During this period, we continued to handle rats on a daily basis to habituate them to the experimenter. All tests were performed during the active phase of the rats (dark phase from 08:00 to 20:00 h). For each behavioural test, cage order (when animal were group caged) or order of rats (when animals were single caged) and treatment groups were newly randomized.
Behavioural experiments testing anxiety and food reward were performed first, before food intake measures and functional verification of the GLP-1R kd. The study was designed this way because we did not want to expose animals to drugs and injections and various novel foods before. Moreover, food intake measures require animals to be single-caged that can, when prolonged, be a stress for the animals and impact the outcome of our behavioural tests.
During the period of behavioural experiments testing anxiety and food reward, animals were housed in groups of three animals per cage (one cage had two animals) to avoid potent anxiogenic effects due to isolation and to keep social interaction (Zhang et al., 2012; Klarer et al., 2014). Between two behavioural tests, rats had a recovery period of 1 to 6 days. The order of the test performed was the following: (1) elevated plus maze test (EPM), (2) conditioned place preference test (CPP), (3) incentive runway test, (4) open field test (OF), (5) food neophobia test. Food intake records were performed afterwards. For each food intake record, rats were single caged. We reduced periods of single caging (maximum two weeks) and group caged the animals back whenever possible. During their single-cage period, rats had social time per initial group cage for several minutes to keep minimum social interactions. Before starting a new single cage period, rats were habituated for one day at least to the single cage. All measures were taken on a scale (PM 3000, Mettler Toledo) at the nearest 0.1 g. First exposure to the new food happened always 3 h after dark onset (11:00 h).
1) Test assessing anxiety
i. The elevated plus maze test
The elevated plus maze (EPM) test is a widely used method to assess innate anxiety-like behaviour in rodents (Walf and Frye, 2007). The test measures the animal's conflict between the natural exploratory behaviour in a new environment and their fear of unprotected and open space. Since the EPM is designed to test the innate component of anxiety, we conducted it first, when rats had not yet been exposed to any behavioural paradigm (Walf and Frye, 2007; Klarer et al., 2014). The maze used was the same as the one described by Klarer et al., 2014, and we followed her protocol. It consists in a black acryl glass, 85 cm elevated from the floor (Fig. 4). Four arms (10 cm wide, 45 cm long) equally spaced are attached to a central zone measuring 10x10 cm. The two opposing arms enclosed by a wall (40 cm high), except the part of the central zone, are the "closed arms". The two other arms, without walls but with a border of 1 mm,
10 | P a g e
Figure 4: The elevated plus maze apparatus
Figure 5: The open field apparatus
11 | P a g e
are the "open arms". Innate anxiety is assessed by calculating the ratio of time spent on the open arms to the total time spent in the arms (open and closed arms) (Walf and Frye, 2007). Thus, an animal with a high level of innate anxiety is expected to spend less time in the open arms than an animal with a low level of innate anxiety (Belzung and Griebel, 2001; Cryan and Holmes, 2005). Rats were placed in the central zone (CZ), which is at the junction of the open arms (OA) and closed arms (CA). The rat was allowed to move in the maze for 5 minutes (min), and then it was brought back to its cage. After each rat, the maze was entirely cleaned with warm water to reduce the impact of olfactory cues on the next rat’s behaviour. The experimenter was not present in the room. A camera above the maze recorded entries, durations and distance moved in each arm. Data were analysed by the video-tracking system Ethovision (Noldus IT) software. The total distance moved in the maze was also recorded to measure the locomotor activity during the test.
ii. Open field test
The open field test is also a widely used method to assess innate anxiety and locomotor activity in a novel environment (Belzung and Griebel, 2001; Cryan and Holmes, 2005). The protocol and material used are the same as the one described by Klarer et al., 2014. The apparatus consisted of two square arena in grey Plexiglas (80x80 cm) surrounded by walls (50 cm high) (Fig. 5). Two different zones were defined in each arena: a central zone (25x25 cm) in the middle of the arena under a light of 30 lux and a peripheral zone including the rest of the arena were the luminosity was around 5 to 10 lux. Animals with a high level of innate anxiety are expected to avoid the "unprotected" central zone with strong luminosity, and spent more time along the wall in the shadow (Belzung and Griebel, 2001; Cryan and Holmes, 2005). The rat was put in one corner of the arena, always the same for all the rats, and was free to explore it for 30 min. After each animal trial, the arena was entirely cleaned with warm water. A camera above the open field recorded entries, durations and distance moved in each zone and that was analysed by the video-tracking system Ethovision software. The variables were measured during 30 min and analysed in 5 min time bins.
i. Food neophobia test
The food neophobia test of innate anxiety assesses the conflict between the natural trend of rat to avoid novel food and their hunger after a long period of fasting (File, 2001). The measure of the latency to start eating the novel food is taken to assess innate anxiety-like behaviour (Klarer et al, 2014). Rats with a high level of anxiety towards food are expected to take longer to taste the novel food compared to less anxious rats (File, 2001). The apparatus consisted of a square arena in grey Plexiglas (80x80 cm) surrounded by walls (50 cm high) under a light of 30 lux in the centre (Fig. 6). To minimize stress reactions to food withdrawal, animals were trained to fast for 16 h a few days before the food neophobia test. The test was performed on three consecutive days. The first day was a habituation session where the animals were allowed to explore the arena for 30 min without food and without 16 h fasting. The actual food neophobia
12 | P a g e
13 | P a g e
test was performed on the next two days: the novel food (three chocolate pellets) was placed in a petri dish in the centre of the arena. There was one trial per animal on both days. Following 16 h of food deprivation, the rat was placed into the box and stayed for a maximum of 5 min while an experimenter recorded the latency to start eating. The experimenter was placed at 2 meters from the arena behind a door with a glass window, to minimize interactions with the animal. If the animal started eating and continued for 3 seconds, the trial was stopped and the animal was removed from the arena. This time was scored as the latency to eat. If a rat did not eat within 5 min, the trial was stopped and the latency to eat was scored as 300 seconds. The animal was then brought back to the animal room, but not with its cage mate to avoid social transmission of food preference (File, 2001) that could have altered the avoidance of the novel food for the following rats. Thus, it was put in a separate cage identical to its home cage, where it receives its usual chow immediately after the end of the trial. When its cage mate had also completed the trial, they were grouped cage again. A video camera above the runway recorded each animal trial for subsequent analysis.
2) Test assessing the reward value of food
ii. Conditioned place preference test
The conditioned place preference paradigm was primarily designed to study the rewarding and aversive effects of drugs (Prus et al., 2009). It was also adapted to study the rewarding effect of food (Prus et al., 2009, Dickson et al., 2012). The animal is expected to spend more time in an environment previously associated with a food reward. The apparatus consisted of two connected chambers with distinct visual drawing on the walls and tactile protrusions on the floor, surrounded by a wall (25 cm length × 16 cm width × 16 cm height) and closed with a transparent Plexiglas roof (Fig. 7). One chamber had dots on the walls and square protrusion on its floor. The other chamber had line on the walls and a grid floor. Rats were previously habituated to the reward in their home cage (sweetened condensed milk, Migros, half diluted in water, 165 kcal/100g) during two daily sessions of 15 min. On the habituation session to the box, animal had access to both chambers for 20 min and time spent on both side was recorded. The least preferred chamber for each rat was paired with a reward (sweetened condensed milk, Migros, half diluted in water) and the preferred side was paired with a non-rewarding solution (water) in a so-called “biased approach”. Then, 8 conditioning sessions of 20 min each (2 sessions per day) followed, where the rat had access to one of the chamber. Rats were fasted 2 h previous to each conditioning session. Reward sessions and non-reward sessions alternated. The amount of non-reward and water consumed were weighed for each animal's trial, to ensure similar consumption of the reward at the end of the conditioning sessions. On the test day, animals had access to both chambers, without reward or water. Like on the conditioning sessions, rats were also 2 h fasted. The CPP test indicates how much rewarding is the palatable food depending on the time the rats spend in each chamber on the test day compared to the habituation session. All sessions (habituation, conditioning and test) were recorded by a camera above the CPP box. On habituation session and test session, the video-tracking system Ethovision software recorded entries, durations and distance moved in
14 | P a g e
Figure 8: The incentive runway apparatus
Figure 9: Taste reactivity apparatus
Figure 10: Camera picture of a rat licking the sweet vanilla flavoured water
Goal box
Running alley
Start box
Reward (chocolate milk)
Camera
15 | P a g e
each chamber. Rats were fasted 2 h prior to each conditioning and test sessions in order to standardize previous food intake.
iii. Incentive runway
The incentive runway paradigm is a model used to evaluate the incentive salience or "wanting" (Ettenberg, 2009). During several test sessions, the speed to cross an alley and reach a positive incentive stimulus is recorded. Called “completion speed”, it assesses the motivation to obtain a reward (Ettenberg, 2009; Shin
et al., 2011). The protocol used is based on the one describe by Shin et al., 2011, and from our in-house
setup. The apparatus consisted of a start box and a goal box joined by a 180 cm running alley (Fig. 8). As in the CCP test, rats were previously habituated to the reward in their home-cage (chocolate milk ChocoDrink M-Classic, Migros, 4g per rat, 61 kcal/100mL) during two daily sessions of 15 min. Then, rats were habituated to the start box and the running alley during one daily session of 5 min. Following 6 h food deprivation, rats were habituated to the goal box with the reward (4g) during two other daily sessions of 5 min. The runway behaviour was then assessed, performing one test per day over 5 days, after 4 h fasting. The rat was introduced into the start box and had to reach the goal box where the food reward were disposed (4g). The time started once his 4 limbs passed the line delimiting the exit of the goal box/start of the running alley. The time to reach the goal box (4 limbs crossed the goal box line) was measured and expressed as completion speed, as well as the time to start eating and the time to finish eating. A video camera above the runway recorded each animal trial for subsequent analysis.
i. Taste reactivity test (orofacial expressions and licking)
We designed the taste reactivity test based on the research of Berridge (Berridge, 2000; Pecina and Berridge, 2005) and Gray and Cooper (Gray and Cooper, 1995) to assess the liking or hedonic appreciation of food of a new palatable solution of 2% sucrose with vanilla flavour. The apparatus consisted of an elevated transparent box (Fig. 9). Depending on the session, a 1mL drop of water or palatable solution was poured on the floor. Thus it was possible to observe the orofacial expression and body expression of the rat licking the solution (Fig 10). Rats were first habituated to the box during a 5 minute-session. The following day was the session with water. Expressions of the animal with a neutral stimulus were recorded. Rats were habituated during 7 min to the box, and then a 1mL drop of water was poured on the floor. The next day was the test day. Rats were habituated during 7 min to the box, and then a 1mL drop of palatable solution was put on the floor. The experimenter stayed in the room during all the session. All sessions were recorded by a camera for the subsequent analysis. Four variables were measured by the experimenter: number of bouts, number of total licks and number of licks per bout and number of paw licking. A bout was defined as an uninterrupted licking, i.e. pauses from more than 0.2 s, head up or turn, were considered sufficient to divide two bouts. Videos were analysed at 0.06 speed. For each subject’s trial, analyses started at the first lick of the solution and continued for 1 min.
16 | P a g e
3) Food intake record
ii. Baseline chow food intake, food intake after fasting and water intake
· Baseline chow food intake and after fasting
To show that our GLP-1R kd rats replicated some of the aspects that have been previously seen (Krieger et
al., Diabetes, 2015, accepted), baseline chow food intake and food intake after fasting were measured.
Daily baseline chow food intake (powder chow, Kliba 3433; Provimi Kliba Nafag) was measured every 24 h over 3 following days. Prior to start the baseline food intake, animals were given 3 days to adapt to the single cage and to be fed with the new powder chow food in a food cup. For food intake after 16 h fasting, food cup were returned back and food intake was weighed after 1 h, 2 h and 4 h.
· Baseline water intake
Following one day habituation to have access to two bottles in a single cage, baseline water intake was measure every 24 h during 2 days. We used two bottles to explain possible side preference.
iii. Palatable food intake
During all measurements of palatable food intake, rats had free access to water and chow food. When two bottles of different solutions were presented, they were switched every day to avoid possible side preferences (Fig. 11).
Figure 11: Apparatus for the solution measures
This apparatus was used for the baseline water intake, sucrose preference test, milk preference test, dextran preference test. Rats are single caged and have access to two bottles.
· Sucrose preference test
The sucrose preference test is usually used to measure anhedonia, in studies linked with depression (Harris
et al., 1997). We adapted it to use the intake of the palatable solution as an indication of liking, or at least
to estimate the pleasure after a rewarding stimulus such as sucrose. Rats had free choice between one bottle of water and one bottle containing 2% sucrose solution (8 kcal/100 mL) for 2 days (Fig. 11). After presenting the new 2% sucrose solution, the intake of both bottles was measured at 1 h, 4 h, 24 h and 48 h.
17 | P a g e
After two washout days, we repeated the experience with a 4% sucrose solution (16 kcal/100 mL), measuring the intake of bottles after 1 h, 2 h, 4 h and 24 h exposure. The indication of liking is the percent of sucrose solution consumed over the total fluid intake.
· Milk preference test
Using a similar design as the sucrose preference test (Fig. 11), rats had free choice between one water bottle and one bottle of a mixture of raspberry flavoured sweet milk matching the nutritional values of the chocolate milk used in the running alley (50% of skimmed milk Léger, 40% of UHT Valflora Drink 1.5% fat milk, 10% of raspberry syrup Migros, energy density: 65 kcal/100 mL). Rats were exposed 4 h per day during 3 days. Measurements were taken at 30 min, 1 h, 2 h and 4 h after exposure.
iv. Non-palatable food intake
Using a similar design as the sucrose preference test (Fig. 11), rats had free choice access between one water bottle and one bottle of 2% Dextran solution (8 kcal/100 mL) (Dextran from Leuconostoc mesenteroides, average molecular weight 64 000-76 000 mol/g, Sigma-Aldrich). Long glucose polymers such as Dextran have a reduced sweet taste, and this Dextran solution does not taste sweet (at least for humans) and brings calories. During one day, measures were taken after 1 h, 2 h, 4 h and 24 h after exposure. The Dextran solution was design to control for caloric density and brought similar energy as the 2% sucrose solution.
II.
Statistical Analysis
Data were checked for normality. When data were normally distributed, the presence of an outlier within our data was checked using the Graphpad outlier test. If an outlier was detected, it was excluded for the rest of the analysis. Statistical significance was analysed using Student t-test, one-way or two-way ANOVA. If data were not normally distributed, they were transformed or non-parametric tests were performed. Only food neophobia data were not normally distributed and they were log-transformed (ln) for normality. Data are presented as mean ± Standard Error of the Mean (SEM). Statistical significance was set at p-value<0.05. All statistical analysis and graphics were performed with GraphPad Prism (version 6.05 for Windows).
In graphics, all values are mean ± SEM. In graphics, the following legend is used for significant difference: *p<0.05; **p<0.01; ***p<0.001; ****p<0.0001.
18 | P a g e
Figure 12: Functional verification of the VAN GLP-1R by IP Ex-4 injection
Percent of reduction in food intake 1 h after intraperitoneal Ex-4 injection (0.3µg/kg) compared to vehicle injection of Ctl and GLP-1R kd rats. Ctl rats displayed a 50% reduction in response to Ex-4 relative to the baseline in response to vehicle significantly different from GLP-1R kd with 15% food intake reduction. Ctl: -50.97 ± 4.823, n=8; GLP-1R kd: -14.91 ± 3.892, n=8; t-test, p<0.0001. Values are means ± SEM
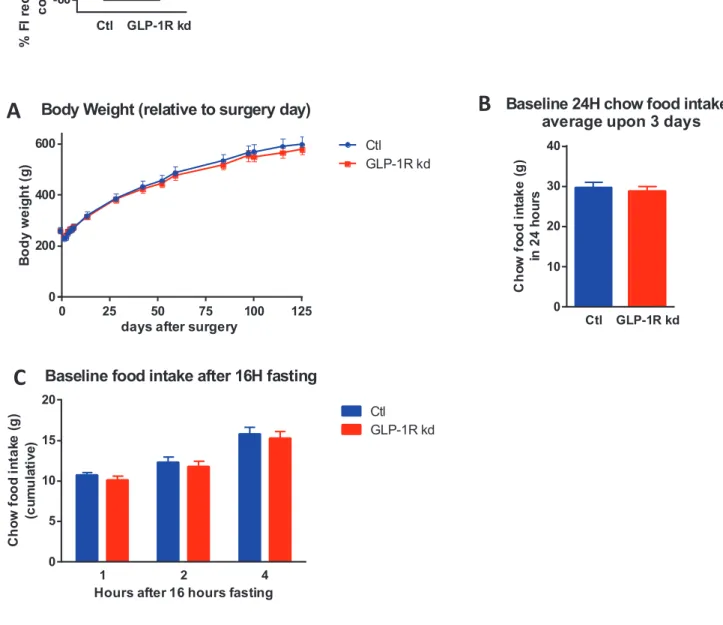
Figure 13: Body weight, daily food intake of chow food
VAN GLP-1 R kd did not affect body weight, daily food intake of chow food. A: Body weight (day 0 indicates surgery day). No significant differences were detected between Ctl and GLP-1R kd rats. n(Ctl)=8, n(GLP-1R kd)=9. B: Baseline 24h chow food intake. Ctl: 29.68 ± 1.420, n=8; GLP-1R kd: 28.80 ± 1.132, n=9; t-test; ns. C: Chow food intake following 16h fasting (2 × 3 (treatment × time) parametric ANOVA, ns). All values are means ± SEM
0 25 50 75 100 125 0
200 400 600
Body Weight (relative to surgery day)
days after surgery
B o d y w e ig h t (g ) Ctl GLP-1R kd Ctl GLP-1R kd 0 10 20 30 40
Baseline 24H chow food intake average upon 3 days
C h o w f o o d i n ta k e ( g ) in 2 4 h o u rs 1 2 4 0 5 10 15 20
Baseline food intake after 16H fasting
Hours after 16 hours fasting
C h o w f o o d i n ta k e ( g ) (c u m u la ti v e ) Ctl GLP-1R kd Ctl GLP-1R kd -60 -40 -20 0 % F I re d u c ti o n a ft e r IP E x -4 i n je c ti o n c o m p a re d t o V e h i n je c ti o n ****
A
B
C
19 | P a g e
Results
I.
Verification of the VAN GLP-1R kd
1) VAN GLP-1R kd did not reduce their food intake after functional verification by
intraperitoneal exendin-4 injection
Following an IP injection of the GLP-1R agonist Ex-4, food intake 1 h after Ex-4 injection relative to food intake after vehicle injection was significantly reduced in Ctl rats compared to GLP-1R kd rats (Ctl: -50.97 ± 4.823, n=8; GLP-1R kd: -14.91 ± 3.892, n=8; t-test, p<0.0001) (Fig. 12). The effect was still noticeable 2 h and 4 h after Ex-4 injection, and the difference between Ctl and GLP-1R kd remained significant (t-test, p<0.001). These results were consistent with the results of Krieger et al., Diabetes, 2015, accepted (Appendix 2).
The purpose of this newly-established functional test was also to decide which individual animal could be included in the study. Based on previous experiments, the inclusion criteria for the VAN GLP-1R kd rats was a maximum decrease of 30% in 1 h food intake. At 1 h time point, within our GLP-1R kd rats, individuals had maximum 28% and minimum 3% food intake reduction in response to Ex-4 injection relative to vehicle injection. Thus, all animals were included in the study.
2) VAN GLP-1 R kd did not affect body weight and daily food intake of chow food
As previously observed (Krieger et al., Diabetes, 2015, accepted), GLP-1R kd and Ctl rats showed no difference in body weight along the study (Fig 13A).
As expected (Krieger et al., Diabetes, 2015, accepted), no difference in 24 h chow food intake was noticed between GLP-1R kd and Ctl rats (Fig 13B). While baseline chow food intake was measured, both groups ate 30g/day (average upon 3 days) (Ctl: 29.68 ± 1.420, n=8; GLP-1R kd: 28.80 ± 1.132, n=9; t-test; ns). Besides, following 16 h of fasting, no significant difference in chow food intake was seen between groups at any time point (2 × 3(treatment × time) parametric ANOVA, ns) (Fig. 13C).
20 | P a g e
Figure 14: 2% sucrose consumption upon 2 days and 4% sucrose consumption upon 1 day of Ctl and GLP-1R kd
GLP-1R kd reduced their consumption of 2% sucrose solution over total fluid consumption 1 h after exposure on day 1. A: 2% sucrose solution intake over total fluid consumption (cumulative measures) on day 1 of exposure. 3 × 2 (time × treatment) ANOVA give a significant treatment difference (F(1,14)=5.085, p<0.05). B: Subsequent comparison confirmed a significant difference between Ctl and GLP-1R kd on day 1 after 1 h exposure to 2% sucrose solution over total fluid consumption (Ctl: 92.38 ± 1.165, n=7; GLP-1R kd: 61.63 ± 11.99, n=9; Unpaired t-test with Welch’s correction; p=0.03<0.05; F test to compare variances: F=136, DFn=8, Dfd=6; p<0.0001). C: Day 1 and day 2 2% sucrose solution intake over total fluid consumption. D: 24H 4% sucrose solution intake over total fluid consumption (4×2 (time × treatment) ANOVA, treatment ns).
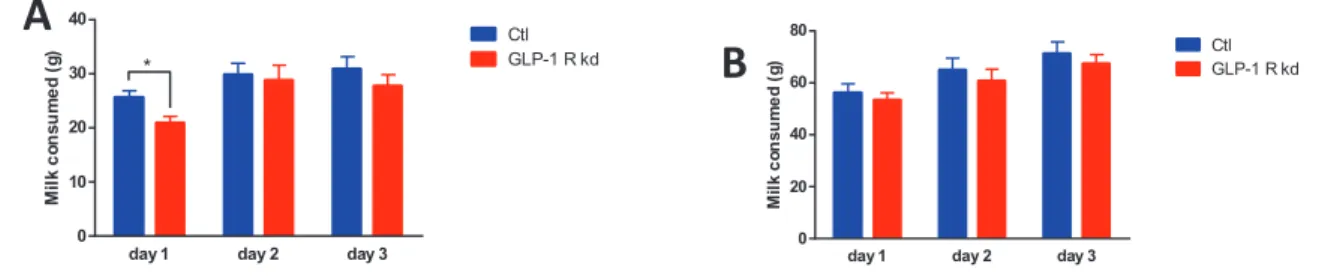
Figure 15: Raspberry flavoured sweet milk consumption upon 3 days (milk is removed after 4H of exposure) of Ctl and GLP-1R kd GLP-1R kd reduced their milk consumption 1 h after exposure on day 1. A: 1 h milk consumption upon 3 days. 1h Day1; Ctl: 25.57 ± 1.212, n=7; GLP-1R kd: 20.82 ± 1.307, n=9; t-test, p=0.02 . T-test differences between groups were not significant the other days at 1H. B: 4h milk consumption upon 3 days. T-test differences between groups were not significant.
Figure 16: 2% dextran consumption upon 1 day of Ctl and GLP-1R kd
GLP-1R kd did not affect consumption of non-palatable solution: 2% dextran solution intake over total fluid consumption during the first 24 h of exposure. 4 × 2 (time × treatment) ANOVA, treatment was not significant.
0 24 0 50 100 Hours % o f s u c ro s e i n ta k e o v e r to ta l fl u id i n ta k e Ctl GLP-1R kd 1 4 Ctl GLP-1R kd 0 20 40 60 80 100 % o f s u c ro s e i n ta k e o v e r to ta l fl u id i n ta k e * day 1 day 2 0 50 100 % o f s u c ro s e i n ta k e o v e r to ta l fl u id i n ta k e Ctl GLP-1R kd 0 0 50 100 Hours % o f s u c ro s e i n ta k e o v e r to ta l fl u id i n ta k e Ctl GLP-1R kd 1 2 4 24
day 1 day 2 day 3 0
10 20 30 40
(milk is removed daily after 4H exposure)
M il k c o n s u m e d ( g ) CtlGLP-1 R kd *
day 1 day 2 day 3 0
20 40 60 80
(milk is removed daily after 4H exposure)
M il k c o n s u m e d ( g ) CtlGLP-1 R kd
A
B
C
D
*A
B
0 0 20 40 60 80 1002% dextran solution intake over total fluid intake
Hours % o f d e x tr a n i n ta k e o v e r to ta l fl u id i n ta k e Ctl GLP-1R kd 1 2 4 24
21 | P a g e
II.
VAN GLP-1 R kd showed short-term changes in palatable food intake
1) Short-term changes in palatable food intake during first exposure in home cage
We conducted two tests, the sucrose preference test and the flavour sweet milk preference test, in home-cage. We measured the consumption when animals had access to a more rewarding food.
In the 2% sucrose preference test, 2% sucrose consumption over the total fluid intake was significantly decreased 1 h after first exposure in the GLP-1R kd group compared to the Ctl group (Ctl: 92.38 ± 1.165, n=7; GLP-1R kd 61.63 ± 11.99, n=9; t-test, p<0.05) (Fig. 14B). After 4 h of exposure, GLP-1R kd rats reached the sucrose consumption of Ctl and there were no difference between groups anymore. Upon 2 days of continuous exposure to the sucrose solution, the consumption of 2% sucrose solution over total fluid intake was similar in both groups (2 × 2 (treatment × time) ANOVA, ns) (Fig. 14C). We reproduced this design by increasing the sucrose concentration to 4%. No difference in 4% sucrose consumption was observed at any time point (2 × 4 (treatment × time) RM ANOVA, ns), (Fig. 14D).
To consolidate this observation of lower food intake at first exposure, we used a solution of raspberry flavoured sweet milk (to which rats had never been exposed) and repeated a similar design, to the exception that the solution was withdrawn after 4 h of exposure. Again, 1 h after the first exposure, GLP-1R kd rats consumed significantly less than the Ctl (Ctl: 25.57 ± 1.212, n=7; GLP-1R kd: 20.82 ± 1.307, n=9; t-test, p<0.05) (Fig. 15A). After 2 h of exposure, milk consumption was similar between the two groups. Upon the two following days, no difference was noticed in milk consumption between groups (Fig 15B).
2) First exposure in home cage to a new non-palatable food did not induce change at
short-term
The previous changes in food intake were seen with sweet and/or fatty solutions, in other words what is considered as "palatable" food or rewarding food. We aimed to see if this short-term reduced consumption of a novel food was specific to palatable food, or if the same results can be obtained with a "non-palatable solution". To investigate this, we used a design similar to the sucrose preference test, using the polysaccharide dextran that probably does not taste sweet for rats owing to its high molecular weight and that we considered as non-palatable. We measured no significant difference between groups in Dextran consumption over the total fluid consumption at any time point (2 × 4 (treatment × time) ANOVA, treatment ns) (Fig. 16), strengthening that this short term reduction of novel food consumption was specific to palatable food.
In brief, the phenotype observed in VAN GLP-1 R kd is a short-term reduction in consumption of a new palatable food, which is consistent with the first observation of a lower consumption of HFD. We hypothesized that this phenotype could be the result of any of the 3 following factors (or a combination of them): a/ an increased innate anxiety, b/ a specific food neophobia or c/ a decrease in the reward value of food. We consequently specifically tested whether VAN GLP-1R kd rats differ from control rats in any of these parameters.
22 | P a g e
Figure 17: In the EPM, percent time spent in open arm and total distance moved of Ctl and GLP-1R kd
GLP-1R kd did not significantly affect measures of innate anxiety and locomotor activity in the elevated plus maze test. A: Percent of time spent in open arms to the total time spent in the arms (open and closed arms). Ctl: 20.47 ± 3.962, n=8, GLP-1R kd: 21.55 ± 3.970, n=9; t-test, ns. B: Total distanced moved in the EPM. Ctl: 1147 ± 57.15, n=8; GLP-1R kd: 1286 ± 67.66, n=9, t-test, ns.
Figure 18: In the OF, time spent in CZ and total distance moved of Ctl and GLP-1R kd
GLP-1R kd did not significantly affect measures of innate anxiety and locomotor activity in the open field test. A: Time spent in the central zone of the open field during 30 min of test. Ctl: 20.78 ± 7.591, n=8, GLP-1R kd: 17.22 ± 8.607, n=9; t-test, ns. B: Total distance moved in the arena during 30 min of test. Ctl: 10389 ± 918.8, n=8; GLP-1R kd: 9429 ± 677.4, n=9; t-test, ns.
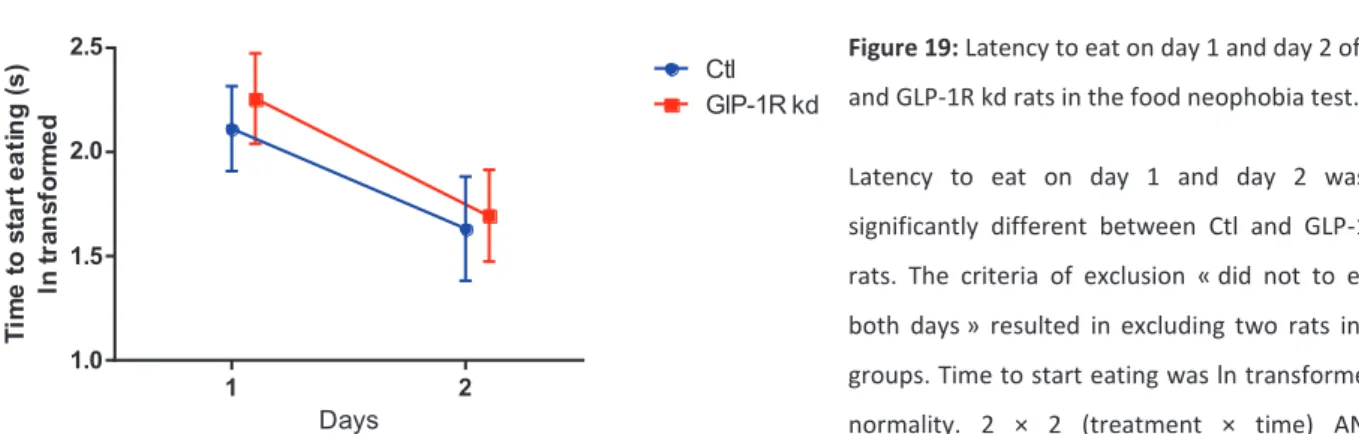
Figure 19: Latency to eat on day 1 and day 2 of Ctl and GLP-1R kd rats in the food neophobia test. Latency to eat on day 1 and day 2 was not significantly different between Ctl and GLP-1R kd rats. The criteria of exclusion « did not to eat on both days » resulted in excluding two rats in both groups. Time to start eating was ln transformed for normality. 2 × 2 (treatment × time) ANOVA, interaction and treatment ns, time p=0.01 means that latency to eat on day 2 is significantly reduced.
Ctl GLP-1R kd 0 10 20 30 P e rc e n t o p e n a rm t im e ( % ) Ctl GLP-1R kd 0 500 1000 1500
Elevated Plus Maze total distance moved
T o ta l d is ta n c e m o v e d ( c m ) Ctl GLP-1R kd 0 10 20 30
Openfield Time in CZ 30 min
T im e i n C Z ( s ) Ctl GLP-1R kd 0 5000 10000 15000
Openfield Distance moved in total 30 min
D is ta n c e ( c m )
A
B
A
B
1 2 1.0 1.5 2.0 2.5 excluding 2*300 Days T im e t o s ta rt e a ti n g ( s ) ln t ra n s fo rm e d Ctl GlP-1R kd23 | P a g e
III.
Assessment of innate anxiety, food neophobia and reward value of food
1) VAN GLP-1R kd did not significantly affect measures of innate anxiety in the elevated
plus maze and open field tests
Measures of innate anxiety were evaluated first in the elevated plus maze and later in the open field. In the EPM, the ratio of time spent in open arms to the total time spent in the arms (open and closed arms) was not affected in GLP-1R kd (Ctl: 20.47 ± 3.962, n=8, GLP-1R kd: 21.55 ± 3.970, n=9; t-test, ns) (Fig. 17A) (Appendix 3), as well as the percentage of distance moved in the open arms (Ctl: 1147 ± 57.15, n=8; GLP-1R kd: 1286 ± 67.66, n=9, t-test, ns) (Fig. 17B). These results indicated that GLP-1R kd did not affect measures of innate anxiety.
VAN GLP-1 R kd did not affect time spent in central zone (CZ), that is the anxiogenic part of the open field (Ctl: 20.78 ± 7.591, n=8, GLP-1R kd: 17.22 ± 8.607, n=9; t-test, ns) (Fig. 18A), as well as the total distance moved. Overall, locomotor activity was not changed in VAN 1R kd rats (Ctl: 10389 ± 918.8, n=8; GLP-1R kd: 9429 ± 677.4, n=9; t-test, ns) (Fig. 18B). Moreover, looking at the total distance moved by 5 min time bins, both GLP-1R kd and Ctl groups showed a similar decrease, that is the normal trend of the exploratory behaviour of rats in a new environment (Appendix 4). The results of the open field test are consistent with the results of the EPM in term of anxiety and locomotor activity.
2) VAN GLP-1R kd did not significantly affect measures of fear towards novel food in the
food neophobia test
The food neophobia test assessed the fear to eat a novel food by measuring the latency to eat upon two following days. The latency to eat the first day was similar in both group (p>0.1), and followed the same reduction the second day (2 × 2 (treatment × time) ANOVA, interaction and treatment ns) (Fig. 19), indicating that GLP-1 R kd and Ctl rats had the same level of food neophobia.
24 | P a g e
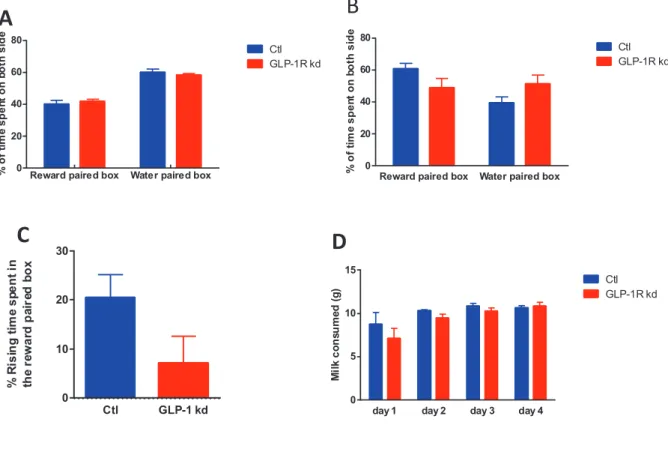
Figure 20: In the CPP, percent of time spent on both side on habituation session and test day, percent of rising time on test day relative to habituation session, milk consumed, of Ctl and GLP-1R kd
GLP-1R kd tended to show a deficit in palatable food-induced side preference (CPP paradigm) that the control group did not displayed. A: CPP habituation session, time spent on both side during the 20 min of the session. B: CPP test day, time spent on both side during the 20 min of the session. C: CPP Habituation session day vs test day: Rising time spent in the reward paired box in Ctl and GLP-1R kd rats. Ctl: 20.42 ± 4.723, n=8; GLP-1R kd: 7.034 ± 5.583, n=9, t-test, p=0.09, ns. D: CPP Milk consumed on the 4 days of conditioning sessions
Reward paired box Water paired box 0 20 40 60 80 20 min % o f ti m e s p e n t o n b o th s id e Ctl GLP-1R kd
Reward paired box Water paired box 0 20 40 60 80 20 min % o f ti m e s p e n t o n b o th s id e Ctl GLP-1R kd Ctl GLP-1 kd 0 10 20 30
Habituation day vs test day
% R is in g t im e s p e n t in th e r e w a rd p a ir e d b o x
day 1 day 2 day 3 day 4
0 5 10 15
CPP Milk consumed on the 4 days of conditioning sessions
M il k c o n s u m e d ( g ) Ctl GLP-1R kd
A
C
B
D
25 | P a g e
3) VAN GLP-1R kd failed to show a palatable food-induced side preference in a CPP
paradigm
To test whether VAN GLP-1 R kd modulated the reward value of palatable food, we compared GLP-1R kd rats and Ctl rats in the conditioned place preference paradigm. The time spent in the chamber previously paired with a food reward (here sweet condensed milk, whereas the other chamber was paired with water), after several conditioning sessions, was taken as a measure of how rewarding the rat finds the food. On habituation session, time spent in both chamber was recorded and the time spent in the dot and in the stripe chambers were similar in both groups (Fig 20A). However, some rats showed a clear preference for one of the side. Thus, we went for a biased approach: the side the less preferred was paired with a reward and the side the most preferred was paired with water.
On the test day, Ctl rats increased of more than 20% (20.42 ± 4.723, one sample t-test difference from 0, p=0.003<0.01) their time spent in the reward paired chamber whereas GLP-1R kd rats time spent in the reward paired chamber was not significantly increased from 0 (7.034% ± 5.583, one sample t-test difference from 0, p=0.24 ns). The difference between both groups only tended to be significant (Ctl: 20.42 ± 4.723, n=8; GLP-1R kd: 7.034 ± 5.583, n=9; t-test, p=0.9) (Fig. 20C). The milk consumption in the two last conditioning sessions indicated that there was no difference in hunger (Fig. 20D). Furthermore the latency to eat during the last reward session was less than 10 seconds and similar in both group. These two points indicated that both groups were conditioned the same way. The general locomotor activity was not changed in both groups, consistent with the results of the EPM and the open field tests. Following the results of the CPP, we performed experiments testing specific components of food reward, the “wanting” and the “liking”.
26 | P a g e
Figure 21: In the incentive runway, completion speed and time to start the meal of Ctl and GLP-1R kd
GLP-1R kd showed identical behaviour in an incentive runway paradigm. A: Completion speed to reach the goal box. 2 × 5 (treatment × time) ANOVA, interaction and treatment ns, time F(4,60) = 4.505, p=0.003). Subsequent t-test analysis comparing groups per day did not give any significance difference. B: Time to start the meal in the incentive runway paradigm. 2 × 5 (treatment × time) ANOVA, interaction and treatment ns, time F (4, 60) = 12.07 p<0.0001. Subsequent t-test analysis between groups per day did not give any significance difference.
Figure 22: In the taste reactivity, total number of licks, number of licking bouts, number of licks per bout and number of paw licking of Ctl and GLP-1R kd
Taste reactivity test did not give interpretable results in term of liking. Number of licking bouts was significant between Ctl and GLP-1R kd rats: Ctl: 1.667 ± 0.2108, n=6; GLP-GLP-1R kd: 2.800 ± 0.3742, n=5; t-test, p=0.02. The t-test analysis of the other variables (total number of licks, number of licks per bout, number of paw licking) were not significantly different.
1 2 3 4 5 0.0 0.2 0.4 0.6 0.8 1.0
Completion speed to reach the goal box
Days C o m p le ti o n s p e e d ( m /s ) Ctl GLP-1 r kd 1 2 3 4 5 0 20 40 60 Days T im e t o s ta rt t h e m e a l (s ) Control GLP-1R kd Ctl GLP-1R kd 0 50 100 150
Total number of licks
N u m b e r o f li c k s Ctl GLP-1R kd 0 10 20 30 40 50
Number of licks per bout
N u m b e r o f li c k s p e r b o u t Ctl GLP1-R kd 0.0 0.5 1.0 1.5 2.0
Number of paw licking
N u m b e r o f p a w l ic k in g Ctl GLP1-R kd 0 1 2 3 4
Number of licking bouts
N u m b er o f li c k in g b o u ts * p = 0.02