Influence des conditions climatiques sur la croissance
du sapin baumier et de l'épinette noire
Mémoire
Christophe Zilliox
Maîtrise en sciences forestières
Maître ès sciences (M.Sc.)
Québec, Canada
Influence des conditions climatiques sur la croissance
du sapin baumier et de l'épinette noire
Mémoire
Christophe Zilliox
Sous la direction de :
Pr. David Pothier, directeur recherche
Pr. Frédéric Raulier, codirecteur de recherche
iii
Résumé
L’effet du climat sur la croissance de la végétation est depuis longtemps un fait acquis. Les changements climatiques globaux ont entrainé une augmentation des efforts de recherche sur l’impact de ces changements en milieux naturels, à la fois en termes de distribution et d’abondance des espèces, mais également à travers l’étude des rendements des espèces commerciales.
La présente étude vise à déterminer, à travers l'utilisation de relevés dendrochronologiques, les effets de variables climatiques sur la croissance de l'épinette noire et du sapin baumier à l'échelle de la forêt boréale du Québec. Le but est d’identifier les principaux modificateurs climatiques responsables de la croissance des peuplements boréaux en fonction de leur âge et de leur localisation. Se focalisant sur un modèle non-linéaire des moindres carrés incorporant les modificateurs climatiques et un modificateur d’âge, la modélisation de la croissance en surface terrière en fonction de ces critères a permis de détecter des différences entre le sapin baumier et l’épinette noire.
Les résultats montrent que les deux espèces réagissent surtout à la longueur de la saison de croissance et aux températures estivales maximales. L’épinette noire semble également plus sensible aux conditions de sécheresse. Les modèles basés sur l’âge ainsi que sur la localisation le long d’un gradient nord-sud révèlent quelques différences, notamment concernant la réaction plus prononcée des jeunes peuplements au climat, en particulier aux températures, tandis que les vieux peuplements sont sensibles au rayonnement solaire. L’étude démontre tout de même une relative indépendance de l’épinette vis-à-vis du gradient latitudinal, à l’inverse du sapin. Les résultats permettent de discuter des modifications de productivité de ces espèces liées à l’allongement de la saison de croissance (gain pour les deux essences) et aux températures croissantes en conjonction avec les précipitations (perte due à la sécheresse pour l’épinette), dans un contexte de changements climatiques.
iv
Abstract
Climate influence on plant growth is a long-known fact. Global changes have driven research efforts forward to assess their impact on natural ecosystems, both in terms of species distribution and abundance, but also through commercial species yield studies.
This study aims at determining the effect of climatic variables on the growth of black spruce and balsam fir in the Eastern Canadian boreal forest, through the use of dendrochronological data. It will then be possible to identify the main climatic modifiers involved in the growth of boreal stands, depending on their age and location. Focusing on a nonlinear least squares model including climatic and age modifiers, basal area growth modelling detected differences between balsam fir and black spruce.
The results indicate that both species respond primarily to the length of the growing season and to maximum summer temperatures. Black spruce also seems to be more sensitive to drought. Models based on age and location along a north-south gradient highlighted a few differences, particularly regarding the greater response of young stands to climate, specifically to temperatures, as well as the old stands response to solar radiations. Contrary to balsam fir, the results revealed a relative independence of black spruce to the latitudinal gradient. These results are discussed in a context of climate change, particularly in regards of the productivity of both species through the lengthening of the growing season (higher yield for both species) and the increasing temperatures in conjunction with changes in the rainfall patterns (lower yield due to possible droughts for spruce).
v
Table of contents………..v
Résumé ... iii
Abstract ... iv
List of figures ... vi
List of tables ... vii
List of abbreviations ... viii
REMERCIEMENTS ... ix
INTRODUCTION ... 1
MATERIALS AND METHOD ... 3
Study area ... 3
Plot selection ... 3
Dendrochronological data ... 5
Climatic and site variables ... 6
Modelling approach ... 8
Submodels for hypothesis testing ... 10
Model validation ... 11
RESULTS ... 12
Principal component analysis ... 12
Selected variables ... 14
Species response to climate ... 16
Magnitude of climatic growth response depending on stand age ... 18
Changes in growth response within two zones ... 20
DISCUSSION ... 23 Variable selection ... 23 Species responsiveness ... 24 Stand age ... 25 Bioclimatic domain ... 27 CONCLUSION ... 30 BIBLIOGRAPHY ... 31 SUPPLEMENTARY MATERIALS ... 38
vi
List of figures
FIGURE 1 : PLOT LOCATIONS FOR THE PIM (A) AND ABB (B) DATABASES .... 5 FIGURE 2 : CDD0.YEAR (A), TMAX.SUMMER (B), RADIA.YEAR (C) AND NOPPT.SUMMER (D) ADJUSTED MODIFIERS FOR PIM AND ABB MODELS. ... 17 FIGURE 3: ANNUAL BASAL AREA INCREMENT PLOTTED AGAINST MEAN BASAL AREA FOR PIM AND ABB. ... 18 FIGURE 4: CDD0.YEAR (A), MAXTMAX.SUMMER (B), RADIA.YEAR (C) AND NOPPT.SUMMER (D) ADJUSTED MODIFIERS FOR PIM ON AGE SUB-DATABASES. ... 19 FIGURE 5: CDD0.YEAR (A), MAXTMAX.SUMMER (B), RADIA.YEAR (C) AND NOPPT.SUMMER (D) ADJUSTED MODIFIERS FOR ABB ON AGE SUB-DATABASES. ... 20 FIGURE 6 : CDD0.YEAR (A), MAXTMAX.SUMMER (B), RADIA.YEAR (C) AND NOPPT.FALL (D) ADJUSTED MODIFIERS FOR PIM ON BIOCLIMATIC DOMAINS SUB-DATABASES. ... 21 FIGURE 7: CDD0.YEAR (A), MAXTMAX.SUMMER (B), RADIA.YEAR (C) AND NOPPT.SUMMER (D) ADJUSTED MODIFIERS FOR ABB ON BIOCLIMATIC DOMAINS SUB-DATABASES. ... 22 FIGURE 8: ADJUSTED AGE MODIFIER FOR PIM AND ABB MODELS. ... 38 FIGURE 9: RATIO OF 10-YEAR AVERAGE BAI FOR PIM/ABB BETWEEN 1 AND 171 YEARS (INTERVALS 1:10, 11:20, ETC.). ... 39 FIGURE 10: CONTOUR PLOT OF THE PRODUCT OF CDD0.YEAR AND NOPPT.SUMMER ADJUSTED MODIFIERS ON A CDD0.YEAR × NOPPT.SUMMER GRID. ... 40
vii
List of tables
TABLE 1: BREAKDOWN OF PURE AND MIXED STANDS IN EACH DATABASE 4 TABLE 2: MAIN VARIABLES TESTED IN MODELS. ... 7 TABLE 3: PCA COORDINATES OF THE MOST CONTRIBUTING VARIABLES FOR PIM (A) AND ABB (B) ON EACH PRINCIPAL COMPONENT (PC) AND PROPORTION OF EXPLAINED VARIANCE OF THE PCA FOR PIM (C) AND ABB (D) ... 13 TABLE 4: MODELS COEFFICIENTS FOR PIM (A) AND ABB (B) GLOBAL MODELS (L = LINEAR COMPONENT, Q = QUADRATIC COMPONENT) ... 15 TABLE 5: MEAN VALUES OF CLIMATIC VARIABLES FOR THE PIM AND ABB DATABASES ... 16
viii
List of abbreviations
ABB = Abies balsamea (sapin baumier, SAB) BA = basal area (surface terrière)
BAI = basal area increment (accroissement en surface terrière) BIC = Bayesian Information Criterion (critère d'information bayésien) CDD = cooling degree-days (degrés-jours de gel)
DBH = diameter at breast height (diameter à hauteur de poitrine) EPE = estimated predicted error (erreur prédite estimée)
GDD = growing degree-days (degrés-jours de croissance) Hdom = dominant height (hauteur dominante)
max = maximum (maximale)
MDC = monthly drought code (code de sécheresse mensuel) min = minimum (minimale)
MRN = Ministère des Ressources Naturelles du Québec
PCA = principal components analysis (analyse en composantes principales) PIM = Picea mariana (épinette noire, EPN)
PET = potentiel evapotranspiration (évapotranspiration potentielle) PPT = precipitation (précipitations)
Radia = total radiation (radiation totale)
VIF = variance inflation factor (facteur d’inflation de la variance) VPD = vapour pressure deficit (déficit de pression de vapeur) T = temperature (température)
ix
REMERCIEMENTS
Ce mémoire fut l’objet d’un travail de longue haleine, comme c’est le cas pour la plupart des travaux académiques. Sa rédaction, dans des conditions parfois difficiles, du fait de mon changement de statut et d’une période de maladie dans les dernières semaines, fut achevée grâce au soutien de mes amis, de ma famille et de l’équipe de l’Université Laval et des centres de recherche en foresterie, que je remercie chaleureusement d’un bloc. J’ai hautement apprécié mon séjour au Québec, et l’Université Laval ainsi que les chercheurs et étudiants avec qui j’ai eu la chance de travailler et qui m’ont aiguillé dans ce projet ont participé à cette expérience formatrice et mémorable.
Je tiens donc à remercier l’équipe du laboratoire de Sylviculture, ces étudiants avec qui j’ai pu partager le quotidien parfois routinier des élèves de maîtrise et de doctorat, et qui ont toujours été là pour me donner des conseils sur le travail comme sur ma vie au Québec. Merci bien sûr à David Pothier, qui fut un encadrant attentif et compréhensif, et qui a permis que mon travail se passe dans les meilleures conditions possibles. Son soutien lors de mon changement de statut et durant les dernières étapes de mon analyse et de ma rédaction a été un moteur pour la continuité et la qualité du travail que j’ai voulu fournir. Je remercie également Frédéric Raulier, qui dans son rôle de co-directeur m’a aidé à franchir les multiples embûches que tout projet de recherche digne de ce nom sème sur le cheminement du chercheur en herbe, et dont la bonne humeur et la disponibilité ont été des atouts certains. J’adresse mes remerciements à Martin Girardin, Marc Mazerolle et Fabien Buissart, que j’ai pu consulter pour des questions de statistiques, de programmation et de dendrochronologie, et dont les conseils m’ont permis d’y voir bien plus clair dans les méthodes que je voulais employer pour ce projet. Un grand merci également à Ann Delwaide, qui m’a aidé à naviguer dans le domaine de la dendrochronologie, entièrement nouveau pour moi. Merci aussi à Philippe Goulet, qui fut mon assistant sur la seule campagne de terrain que j’eus à entreprendre : je fus plus son assistant que l’inverse, et j’ai grâce à lui découvert la forêt boréale dans le sérieux et la bonne humeur, malgré des conditions parfois difficiles, et j’ai abattu avec lui un travail considérable pour les volets suivants du projet de recherche. Je remercie également mes assistants pour le travail de laboratoire : Michael Cliché, Claude Durocher, Anthony Fournier et Gabrielle Grenier, qui tous ont fourni un travail sérieux et qui ont fait montre d’un enthousiasme certain pour des travaux dendrochronologiques parfois laborieux. Enfin, je remercie Lou Monteil pour son soutien inébranlable lors des dernières semaines de travail, où la fatigue et la maladie ont joué contre moi.
1
INTRODUCTION
The boreal forest is one of the largest forest biome in the world and a major part of the Canadian natural ecosystems (Bergeron and Fenton, 2012). Its great contribution to the global carbon cycle can explain the widespread interest for studies aiming at understanding its dynamics (Bradshaw et al., 2009; Kasischke, 2000). Boreal ecosystems are historically shaped by both anthropogenic and natural disturbances, among which forest fire is the main determining factor for species composition, vertical structure, stand productivity and stand age distribution (Bergeron et al., 2004a, 2004b; Dale et al., 2001; Flannigan et al., 2000; Weber and Flannigan, 1997). Stand productivity has also been studied under different angles, such as biodiversity, forest management, and nutrients cycle (Fries et al., 1997; Kljun et al., 2006; Nilsson and Wardle, 2005; Nordin et al., 2001).
Aside from historical determinants of forest structure, several other factors are likely to influence growth dynamics, among which climate plays a significant role (Bunn et al., 2005; Girardin et al., 2008; Zhang et al., 1999). The influence of climate on tree growth has been extensively studied, focusing on the impact of global changes in terms of species distribution and abundance (i.e. biodiversity) or in wood volume productivity (Araújo et al., 2005; Boisvenue and Running, 2006; Hamann and Wang, 2006; Lindner et al., 2010; Millar et al., 2007; Pearson and Dawson, 2003). Stand and tree growth have already been correlated to various climatic variables such as incident radiation (Wright et al., 1998), rainfall and temperature (Andalo et al., 2005; Brooks et al., 1998; Subedi and Sharma, 2013). In the boreal forest, the climatic variables mostly related to tree growth were found to be temperature, rainfall and length of the growing season (Girardin et al., 2008; Girardin and Tardif, 2005; Hofgaard et al., 1999; Huang et al., 2010). These variables directly affect the mechanisms associated with photosynthesis which, in turn, largely determines biomass accumulation (Landsberg and Sands, 2010) and allocation between the different tree parts (Gower et al., 1992). It is thus important to consider
2
the latitudinal and longitudinal climatic gradients of this large forest biome to ascertain local climate-growth relationships.
Multiple aspects of growing conditions must be investigated to identify the key factors involved in tree growth. By using a wide range of climatic conditions, it would be possible to develop a versatile and flexible growth model. Such models of growth prediction may have applications for examining the impact of silvicultural treatments across an extended territory. The inclusion of climatic components together with the use of basic growth equations should result in an effective modelling tool. In addition, the growth model needs to deal with possible changes in growth response due to age-related effects, generally explained by physiological differences (Carrer and Urbinati, 2004; Ryan et al., 1997; Szeicz and MacDonald, 1994).
To make the model applicable to all the boreal forests of eastern Canada, it must also take into account the principal species as well as other local factors such as site conditions (Carrer and Urbinati, 2004; Graumlich, 1993; Kahle and Spiecker, 1996). In the present study, we focused on the two major tree species composing most of the eastern Canadian boreal forests: balsam fir (Abies balsamea (L.) Mill., abbreviated to ABB) and black spruce (Picea mariana (Mill.) B.S.P., abbreviated to PIM) (Ung et al., 2001).
The main goal of this study is to investigate the variation in the relationships between climatic variables and tree growth among stands differing in composition and location along a latitudinal gradient. Specifically, we hypothesized that: 1) balsam fir is more responsive to climate than black spruce, 2) the magnitude of tree growth changes to climatic variables is stronger in younger than in older stands, and 3) the relative importance of rainfall and temperature on tree growth changes according to species and stand location along a latitudinal gradient. We explored these hypotheses by fitting an individual tree growth model to a large dataset covering a variety of locations among the eastern Canadian boreal forests.
3
MATERIALS AND METHOD
Study area
The study area is located in the eastern Canadian boreal forest of the province of Quebec and encompasses its two southernmost bioclimatic domains: the balsam fir-white birch domain in the south and the spruce-feathermoss domain in the north (139 000 km2 and 412 000 km2, respectively). The altitude ranges from 50 to 1050
m, while the mean annual temperature varies from -5 °C to 4 °C. Mean annual precipitation is comprised between 600 and 1400 mm, and the length of the growing season ranges from 100 to 160 days (Gagnon, 2004). The surficial deposits vary from lacustrine deposits, which form clay soils in the western part of the study area, to glacial tills, which form sandy loams in the eastern part, with the occasional presence of sandy soils originating from fluvio-glacial deposits.
The main forest types are dominated by black spruce and balsam fir, with minor components of jack pine (Pinus banksiana, Lamb.), white spruce (Picea
glauca (Moench) Voss), trembling aspen (Populus tremuloides Michx.), white birch
(Betula papyrifera Marshall) and yellow birch (Betula alleghaniensis Britt.). The understory of most stands was dominated by the feathermoss Pleurozium schreberi (Brid.) Mitt. together with Sphagnum sp., Rhododendron groenlandicum Oeder,
Kalmia angustifolia L. and Hylocomium splendens (Hedw.) B.S.G, in the case of low-
to medium-quality sites with mesic to subhydric drainage properties (Morneau et al., 2007).
Plot selection
In this study, we used a sample plot network established by the Ministère des Ressources naturelles du Québec (MRN), within which stem analysis data were collected in each plot. Plot location was determined by the MRN following a stratified random sampling scheme applied to both bioclimatic domains. Selected sampling
4
plots were located at least 50 m of a road within stands between 50 and 120 years old. From this large dataset, we selected plots dominated by balsam fir and black spruce, either in pure or mixed stands. A stand was considered as pure when one of the two species represented at least 75% of the plot total basal area whereas a stand was considered as mixed when the basal area of both species was between 25 and 75%. Using these criteria, the selected plots covered a large longitudinal gradient of the Quebec province (Figure 1). Overall, the plots were within the latitudes 47.1 °N and 51.6 °N and the longitudes -79.2 °W and -60.4 °W. The databases for ABB and PIM contained 142 and 294 plots, respectively. Table 1 indicates the number of plots used in each database whether they were considered as established in pure or mixed stands. ABB-dominated plots within the PIM database correspond to stem analyses performed on black spruce within a plot whose basal area was dominated by balsam fir. Conversely, PIM-dominated plots within the ABB database correspond to stem analyses performed on balsam fir within a plot whose basal area was dominated by black spruce.
5
Figure 1 : Plot locations for the PIM (A) and ABB (B) databases
Dendrochronological data
Within each selected plot, 5 to 20 dominant or co-dominant trees were selected for stem analysis. After felling these trees, cross-sectional wood disks were sampled at 1 m and were then air-dried for three weeks in a well-ventilated room. Wood disks were sanded with increasingly fine sandpaper, from 120 to 400 grit size. Ring count was performed on each disk using a binocular microscope along four radii. These disks were then digitized to measure ring widths using the WinDendro software (Regent Instruments, Québec, Canada) (Guay, 1995). Crossdating at both tree and plot levels was then performed with the COFECHA software to ensure the validity of the assembled data (Holmes, 1983).
6
Climatic and site variables
All climatic variables were estimated with BioSIM, a software using weather station data to generate climatic variables at any given geographical point based on an interpolation procedure (Régnière et al., 1995). Combining weighted data from the closest weather stations as a function of their distance to each plot, BioSIM can approximate a series of climatic variables taking into account the latitude, the longitude and the elevation of the plot. The software also allowed us to calculate a monthly drought code (MDC) designed as an index of the water stored in the soil, which was dependent on daily temperatures and precipitations (Girardin and Wotton, 2009). All climatic variables were computed using two different temporal scales, the season and the year (Table 2). Seasons were delimited according to their meteorological definitions for the northern hemisphere: spring from March to May, summer from June to August, fall from September to November, winter from December to February.
7
8
Modelling approach
All statistical analyses were performed using the R software (version 3.1.1) (R Core Team, 2013). Non-linear least squares models were fitted using the stats package of R (Pinheiro et al., 2014). Non-linear models were chosen because they generally allow better interpretability, parsimony, and validity beyond the observed data range compared to linear models (Pinheiro and Bates, 2000). The 142 and 294 chronologies at the plot level collected for ABB and PIM, respectively, corresponded to 13185 and 25950 annual ring observations.
Two growth equations, one for each species, were fitted to the chronology data using the Chapman-Richards model (Equation 1). The general form of the differential equation is as follow (Pienaar and Turnbull, 1973), with growth modifiers added as products:
𝐵𝐴𝐼𝑖,𝑗= [𝑎 ⋅ 𝐵𝐴𝑖,𝑗𝑏 − 𝑐 ⋅ 𝐵𝐴
𝑖,𝑗] ∙ ∏ 𝑓𝑘 𝑘 [1]
where BAIi,j is the mean basal area increment at year i for the plot chronology j (or
increment at year i for chronology j), BAi,j is the mean tree basal area of the
chronology j at year i, a, b and c are parameters, and fk are multiplicative growth
modifiers. Growth modifiers were formulated to include both linear and quadratic effects of the variable of interest (Girardin et al., 2008):
𝑓𝑥 = 1 + 𝑏𝑙⋅ (𝑥−𝑥̅𝑥̅ ) + 𝑏𝑞⋅ (𝑥−𝑥̅𝑥̅ )2 [2]
where 𝑥 and 𝑥̅ are the variable and the variable mean values, respectively, and 𝑏𝑙
and 𝑏𝑞 are linear and quadratic coefficients, respectively. 𝑥 is taken for the year
(observation), and 𝑥̅ for the whole database.
We used a segmented curve for the age modifier to better represent the effect of age on tree growth. The segmented function uses an age limit to determine a plateau of the lowest value for the age modifier:
9 𝑓𝑎𝑔𝑒 𝑙𝑖𝑚= 1 + 𝑏𝑙⋅ (𝑥𝑙𝑖𝑚𝑥̅−𝑥̅) + 𝑏𝑞⋅ (𝑥𝑙𝑖𝑚𝑥̅−𝑥̅) 2 [3a] 𝑓𝑎𝑔𝑒 = { 𝑓𝑎𝑔𝑒 𝑙𝑖𝑚 𝑖𝑓 𝑥 > 𝑥𝑙𝑖𝑚 𝑜𝑟 [𝑓𝑥 > 𝑓𝑎𝑔𝑒 𝑙𝑖𝑚 𝑎𝑛𝑑 𝑥 > 𝑥𝑙𝑖𝑚] 𝑓𝑎𝑔𝑒 [3b]
where xlim is the age limit for which fage is minimum (determined in the model for each
species).
Growth modifiers were obtained from climatic and other continuous variables. The climatic variables were selected based on the results of a principal component analysis (PCA) to deal with the great number of explanatory variables available for the models. The PCA allowed us to replace the numerous explanatory variables by uncorrelated linear combinations of the original variables. This was done through a projection of the variables on principal components ranked through their explained variance. Within these components, or eigenvectors, each variable of the whole original set was ranked through their contribution to the component (by way of their eigenvalue), which allowed us to select a restricted number of variables for each eigenvector we kept. We then selected the highest modulus eigenvalues (i.e. the coordinates or loadings of each climatic variable within the eigenvectors) for each component in order to fit the models for both species.
Collinearity between the explanatory variables was explored through the variance inflation factor (VIF) applied to the fixed effects of the models. Variables with VIF values higher than 3.0 were removed from the models so that the remaining variables did not alter the functioning of the models (Theil, 1971). If the coefficient of the quadratic effect was found non-significant (p > 0.05), the corresponding term in the equation was removed from the modifier equation. However, if the linear effect was not significant while the quadratic effect was significant, both were kept in the model to accurately account for the quadratic effect of the variable.
We used a simple version of the nonlinear least squares models, implying that there were no random effects, autocorrelation or weight parameters added to the
10
models. This was necessary to accurately capture the climatic effects on tree growth. Indeed, these effects were found to be very weak with more parameterized models, such as nonlinear mixed models which included random effects. For example, our first analyses revealed that the autocorrelation parameter masked some of the variance our models tried to explain. Removing both the mixed effects and the autocorrelation gave a more prediction-oriented model rather than a perfect statistically calibrated model. We also worked on raw basal area increment instead of deriving a tree-ring growth index: this corresponds to a light standardization of the data, and allowed us to visualize and model the full range of the climatic effects. We also tried to estimate the mean response for the effect of modifiers on tree growth, for which estimation of random-effect coefficients can be put aside or the parameters set to zero, and where the modelling relies on fixed effects (Fonweban et al., 2011).
Submodels for hypothesis testing
We tested our hypotheses with subsets of data, one for each hypothesis, by subdividing the whole database using the following categorical variables: bioclimatic domain (balsam fir-white birch and spruce-feathermoss domains) and mean chronology age (younger and older than 80 years). We tested the first hypothesis regarding the compared reactivity of both species using the full datasets. For each species, the modifier values were then extracted for the sub-database corresponding to each hypothesis, and we compared the effects of the categorization on each ‘adjusted’ growth modifier using the overlap of their respective 95% confidence intervals. The adjusted modifier is defined as opposed to the predicted modifier, which corresponds to its raw value in the models as defined by equation 2, after model calibration for the parameters. We computed the adjusted values of each growth modifier with the observed basal area increment divided by the fitted values of the model and multiplied by the corresponding growth modifier:
11
where BAIobserved is the recorded BAI for each year in a given plot, BAIpredicted is the
fitted values for the model, fmod X the predicted growth modifier for variable X (Raulier
et al., 2000).
To illustrate the effect of the modifiers, we used a conditional mean function based on a generalized additive model, as well as a smoother to calculate and plot the confidence interval. This was done using the ggplot2 package in R. We evaluated the strength and dissimilarity of compared responses as follow: strength as departure from the value 1 (which corresponds to an absence of response) and dissimilarity by non-overlapping confidence intervals.
Model validation
The models were evaluated using a 10-fold cross-validation procedure, which consists of randomly partitioning the data set into 10 roughly equal-sized groups and calibrating the models 10 times, each time omitting a different group. Predicted values were calculated for the omitted group with the estimated models obtained with the nine other groups (Vanclay and Skovsgaard, 1997). Single R2 values for the
models were calculated by using the residual sum of squares of the model (SSres)
and the sum of squares of the deviations of the observed responses around their means, or total sum of squares (SStot) (Green, 2005):
𝑅2 = 1 −𝑆𝑆𝑟𝑒𝑠
12
RESULTS
Principal component analysis
When performed on the whole set of climatic variables, the PCA identified four gradients for each species, corresponding to the first four eigenvectors or principal components. The two first components represented gradients of temperature while the third and the fourth components corresponded to radiation and precipitation gradients, respectively. Table 3 gives an overview of the PCA results. The first four components of the analysis explained 48% and 51% of the total climatic variability for PIM and ABB, respectively. We sequentially introduced the different variables for each component in the model and performed comparisons using Bayesian Information Criterion (BIC) in order to select the best model at each step. This means that we kept the model within which BIC was minimal for every variable of every component, after performing adjustments for the final models to be optimal between the two species (see next section).
13
Table 3: PCA coordinates of the most contributing variables for PIM (A) and ABB (B) on each principal component (PC) and proportion of explained variance of the PCA for PIM (C) and ABB (D)
14
Selected variables
According to equation [1], the growth models for ABB and PIM took the form of equations 5a and 5b. The variables and associated parameters included in the final models are presented in Table 4.
𝐵𝐴𝐼𝑃𝐼𝑀𝑖,𝑗= [𝑎 ⋅ 𝐵𝐴𝑏𝑖,𝑗− 𝑐 ∙ 𝐵𝐴𝑖,𝑗] ∙ 𝑓𝐶𝐷𝐷0.𝑦𝑒𝑎𝑟 ∙ 𝑓𝑚𝑎𝑥𝑇𝑚𝑎𝑥.𝑠𝑢𝑚𝑚𝑒𝑟∙ 𝑓𝑅𝑎𝑑𝑖𝑎.𝑦𝑒𝑎𝑟∙
𝑓𝑛𝑜𝑃𝑃𝑇.𝑠𝑢𝑚𝑚𝑒𝑟∙ 𝑓𝐴𝑔𝑒 [5a]
𝐵𝐴𝐼𝐴𝐵𝐵 𝑖,𝑗= 𝑎′ ⋅𝐵𝐴𝑖,𝑗𝑏′∙ 𝑓𝐶𝐷𝐷0.𝑦𝑒𝑎𝑟 ∙ 𝑓𝑚𝑎𝑥𝑇𝑚𝑎𝑥.𝑠𝑢𝑚𝑚𝑒𝑟∙ 𝑓𝑅𝑎𝑑𝑖𝑎.𝑦𝑒𝑎𝑟∙ 𝑓𝑛𝑜𝑃𝑃𝑇.𝑠𝑢𝑚𝑚𝑒𝑟∙ 𝑓𝐴𝑔𝑒 [5b]
where f is given in equation [2].
Except for age, the independent variables selected by the model were all climatic variables (Table 4). The growth equation for ABB does not include the term
‘−𝑐 ∙ 𝐵𝐴𝑖,𝑗’ since its inclusion prevented the convergence of the model. In the models,
we took maxTmaxsummer in the ABB model to match the variable selection of the PIM
model, and we changed the noPPTfall initially selected to noPPTsummer in both models
because of a lack of significance in the ABB model.
15
Table 4: Models coefficients for PIM (A) and ABB (B) global models (L = linear component, Q = quadratic component)
Mean estimated prediction errors (EPE) for the cross-validation for the ABB and PIM models were 0.013 and 0.007 cm2/year, respectively. If we take into
consideration the mean BAI value for both species, which are respectively 2.81 and 2.83 cm2/year, these EPE values represent 0.47 and 0.25% of the mean observed
basal area increment for ABB and PIM, respectively. R2 values for ABB and PIM
global models are 0.66 and 0.68, respectively. Mean values for the climatic variables are given in Table 5:
16
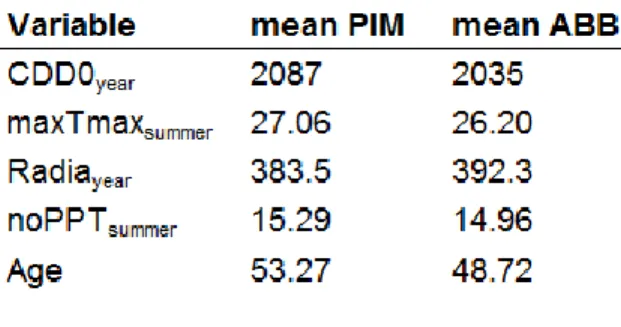
Table 5: Mean values of climatic variables for the PIM and ABB databases
Species response to climate
Figure 2 indicates that BAI (or its variation due to the modifier) is negatively correlated with the CDD0year modifier and positively with the maxTmaxsummer modifier
and Radiayear modifier for both species. Surprisingly, the BAI of both species seems
to be positively correlated to the noPPTsummer modifier, although the PIM curve shows
an abrupt decline for the higher values of the variable, suggesting a higher sensitivity to xeric conditions for this species. Finally, we observed a negative relationship between BAI and the age modifier (Figure 8 in the Supplementary Materials).
The relative importance of the modifiers was assessed through a simple comparison of the t-values from Table 4. Accordingly, the age modifier and the Chapman-Richards differential growth equation (BA terms in the growth model) were found to account for most of the explained variability. CDD0year contributes most
among the climate variables to the modulation of the growth response for both species.
Contrary to our hypothesis, black spruce was more responsive to climate than balsam fir (Figure 2). Although their reaction was somehow similar along the various climatic modifiers we tested, PIM exhibits a greater negative response to high values of the CDD0year modifier, a greater negative response to low values of the
maxTmaxsummer modifier and globally greater reactions to both the Radiayear and
noPPTsummer modifiers. However, tree growth rate of ABB is higher than that of PIM
17
Figure 2 : CDD0.year (A), Tmax.summer (B), Radia.year (C) and noPPT.summer (D) adjusted modifiers for PIM and ABB models.
18
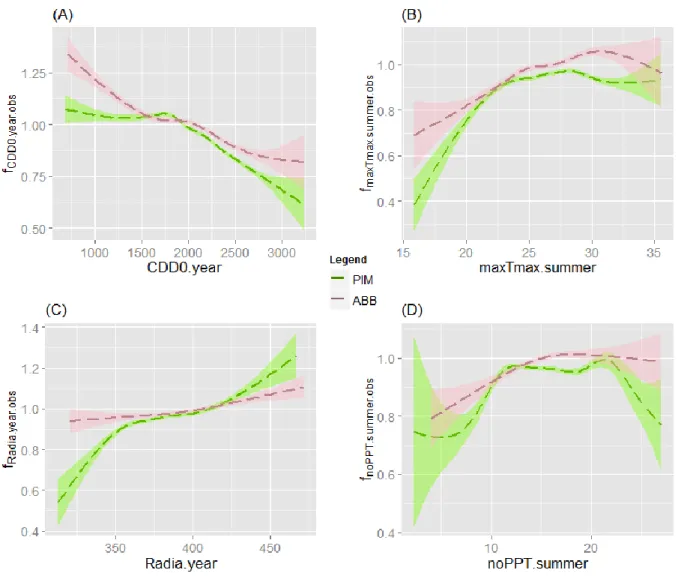
Figure 3: Annual basal area increment plotted against mean basal area for PIM and ABB.
Magnitude of climatic growth response depending on stand age
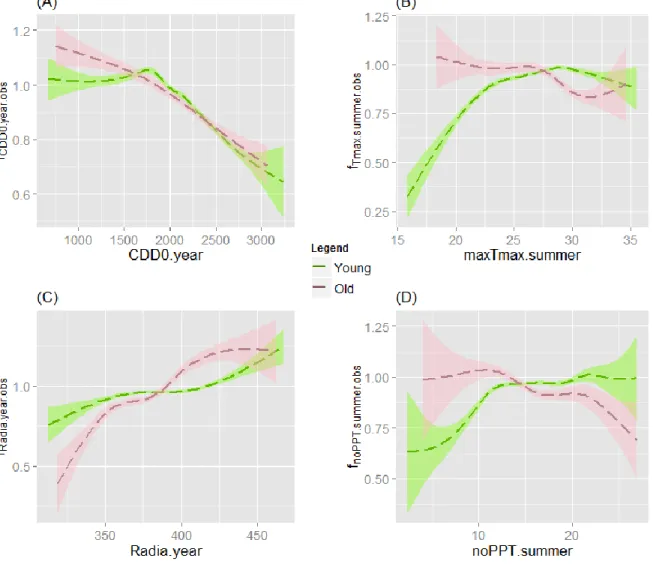
In the case of black spruce, the hypothesized greater response of younger stands to climatic variables was not verified for all variables (Figure 4). Young stands showed a greater response to low values of the maxTmaxsummer modifier (Figure 4B),
with old stands exhibiting a stronger negative response for higher values. They also seemed to respond more strongly than old stands to low values of the noPPTsummer
modifier (Figure 4D), but again, for higher values, the impact became stronger on old stands.
19
Figure 4: CDD0.year (A), maxTmax.summer (B), Radia.year (C) and noPPT.summer (D) adjusted modifiers for PIM on age sub-databases.
Differences between young and old stands of balsam fir were not obvious either (Figure 5). Young stands of balsam fir seemed to respond more strongly to
maxTmaxsummer and noPPTsummer, which was similar to the observed reaction of black
spruce (Figure 5B and 5D). Interestingly, Figure 5B and Figure 5D show that the
maxTmaxsummer and noPPTsummer modifiers have a small impact on the growth
response of old stands, since their values were always close to 1. Old stands of ABB seem to also be more sensitive to radiation than young stands (Figure 5C).
20
Figure 5: CDD0.year (A), maxTmax.summer (B), Radia.year (C) and noPPT.summer (D) adjusted modifiers for ABB on age sub-databases.
Changes in growth response within two zones
To test the hypothesis related to the relative importance of temperature and rainfall variables, we separated the database in two: one for the balsam fir-white birch domain and another one for the spruce-feathermoss bioclimatic domain. In the case of black spruce, the hypothesis was not validated (Figure 6). Indeed, contrary to our hypothesis, the growth response to climate was generally similar between the bioclimatic domains when confidence intervals were taken into account, except for few small differences.
21
Figure 6 : CDD0.year (A), maxTmax.summer (B), Radia.year (C) and noPPT.fall (D) adjusted modifiers for PIM on bioclimatic domains sub-databases.
In the case of balsam fir, the growth response to the CDD0year modifier was
greater in the southern than in the northern bioclimatic domain (Figure 7A). Southern stands also showed a greater reaction to the noPPTsummer modifier for the median
values of the variable, but otherwise, the magnitude of effects is similar between both zones, with both negative and positive effects in the North and South respectively, or overlapping curves in some cases. While the noPPTsummer modifier
22
values of the variable, the modifier hits a plateau in the case of northern ABB stands, and follows the same parabolic shape than PIM stands for the southern stand.
Figure 7: CDD0.year (A), maxTmax.summer (B), Radia.year (C) and noPPT.summer (D) adjusted modifiers for ABB on bioclimatic domains sub-databases.
23
DISCUSSION
The results highlighted several key points regarding the relation between growth and climate for both species. Contrary to our first hypothesis, we found a greater responsiveness of black spruce to climate compared to balsam fir. In the context of climate change, a stronger response of black spruce, whether positive or negative, can trigger changes in boreal forest productivity (Girardin et al., 2015). Moreover, stand age has been shown to generate different reactions to climate: results showed that young stands can be more sensitive to climatic variations, particularly during the summer. On the other hand, the response of old stands of PIM to summer temperature and precipitation, as well as the response to radiation of both species, is worth exploring to identify the underlying mechanisms. The reaction to climate was also dependent upon stand location, especially for balsam fir. Northern and southern stands of ABB exhibit different growth patterns, owing to different growth limiting and enhancing factors, with a generally greater response in southern stands.
Variable selection
The inclusion of cooling degree days is not common in ecological studies, although the variable has been used to estimate temperature profiles and their impact on urban vegetation (Easterling et al., 2000; Sailor, 1998). Through this variable, we ascertain the dominant effect of the growing season length on tree growth. Summer temperatures are much more common in climate studies, and have been used to describe tree-growth response to climate (Rossi et al., 2006; Szeicz and MacDonald, 1994; Zhang et al., 1999). Incoming radiation is a rather commonly used climatic variable (e.g. Landsberg and Waring, 1997); it can be implemented as a growth modifier, but it is also routinely included in hybrid or mechanistic growth models as a key variable, either in its raw form (total radiation or light availability) or as photosynthetically active radiation (Brooks et al., 1998; Girardin et al., 2008; Mäkelä et al., 2008). As for the noPPTsummer variable, the consecutive number of
24
days without rainfall is most often used to infer ecological mechanisms in environments where water is either a limiting factor (such as Mediterranean ecosystems) or, on the contrary, a readily available resource (such as tropical forests) (Bräuning et al., 2009; Llorens et al., 2010). It can also be used to assess fire risks (Holden et al., 2007). In the case of boreal forests, water is generally not considered a limiting resource (Boisvenue and Running, 2006). But it has nevertheless been pointed out in productivity studies as an emerging limiting factor to tree growth in the context of climate change (Aber and Federer, 1992; Girardin et al., 2015; Zhang et al., 2008). In our study, it likely represents water stress events that can occur in these ecosystems under new climatic conditions, which is directly linked to the rainfall and temperature regime in the study area.
Species responsiveness
The results highlighted a greater reactivity to climate of PIM compared to ABB, with almost all climatic variables displaying a significantly greater impact. This is contrary to our first hypothesis, even though differences between ABB and PIM were only observed for some parts of the variable ranges. However, the BAI of ABB was generally higher than that of PIM. Hence, the greater response of PIM to climate does not correspond to a higher productivity, especially between 60 and 150 years old, where ABB growth is greater than PIM growth (Figure 9 in Supplementary Materials). Mean values for the four climatic modifiers are around 0.98 for ABB and 0.95 for PIM, highlighting the difference in response to climate, PIM being more responsive (which is also evidenced by the ratio between PIM and ABB modifiers being greater than 1 in all cases). Overall, while PIM response to climate is stronger than that of ABB, the basal area growth of the latter is clearly higher.
Both ABB and PIM showed strong responses to the length of the growing season (through CDD0year). Based on the response of PIM to this variable, with a
trend of increasing temperatures and a lengthening of the growing season (Girardin et al., 2008), tree growth could be effectively enhanced. These positive effects of increasing temperature could be balanced by the negative impact of water stress,
25
particularly in stands located in the southern part of our study area. It is especially true for PIM, as demonstrated by the effect of the number of days without rain during the summer (noPPTsummer) (Figure 2D and Figure 6D). Based on those
considerations, the productivity of PIM-dominated stands could be negatively affected by future climate change, especially if droughts were to overcome the beneficial effects of climate warming. This negative response has been previously hypothesized (Girardin et al., 2008; Girardin et al., 2015). However, precipitation levels are supposed to rise in Canada with climate change, but the higher temperatures would still lead to increased moisture deficits in many regions due to greater evapotranspiration (Barrow et al., 2004). The negative response of PIM to the number of days without rain in summer would therefore be difficult to precisely assess, but increased water stress would still mean a reduced productivity in this context.
ABB-dominated stands could however benefit more from warmer conditions because of their lesser sensitivity to drier conditions (Figure 2D). While the relationship of both species to growing season length (through CDD0year) is similar,
their relation to xeric conditions changes drastically, with PIM more sensitive to the number of summer days without rain (noPPTsummer) (Fig. 10 in the Supplementary
Materials). In addition, ABB can also benefit from maximum summer temperature (maxTmaxsummer) while PIM is potentially negatively affected by increases in dry and
warm conditions. If climate change shortens the fire cycle in boreal forests, as suggested by Weber and Flannigan (1997), it could trigger a change in landscape demographics by increasing the area dominated by black spruce, thus decreasing the overall productivity of boreal forests. However, stand composition alone cannot be the sole determinant of the stand productivity issue since the effects of age and location are likely to influence the climate-growth relationship, as detailed below.
Stand age
As seen previously, the local response of tree growth to climate is related to stand age. As evidenced by dendrochronological studies, the age effect on the
26
climate-growth relationship can be light (Liñán et al., 2011) and the response of young stands to climate can be observed only for specific variables, or even for specific intervals of a given variable. This means that our hypothesis of greater sensitivity to climate for young stands was only partially verified, despite the growth rate of young stands being globally greater for PIM, but not for ABB. Indeed, comparisons of mean BAI on the whole database for young and old stands, and of mean BAI for small intervals of each climatic variable revealed a greater growth rate for old ABB stands (results not shown).
Old black spruce stands showed a slight positive reaction to longer growing seasons (low values of CDD0year, Figure 4A) and a stronger response to the amount
of total yearly radiation (Radiayear) than young stands (Figure 4C). More importantly,
we observed a greater reaction of young PIM stands to low maximum temperatures and lack of precipitation during the summer (maxTmaxsummer and noPPTsummer).
Indeed, the shape of the response curves to these modifier suggests that young PIM growth is limited by the xeric conditions in the study area. The negative response of old PIM to high values of lack of summer rain (noPPTsummer) could hint at a
physiological reaction of aging trees to more drastic summer conditions, which can be explained through complex mechanisms involving decline of leaf area and lower photosynthetic capacity and diurnal assimilation of old trees (Ryan et al., 1997; Szeicz and MacDonald, 1994).
The same results were found in young stands of ABB. However, old ABB stands exhibited lesser reactivity to summer conditions such as maximum temperatures and lack of precipitation (maxTmaxsummer and noPPTsummer, Figure 5B
and 5D). This is consistent with our previous inference regarding the lesser sensitivity of ABB to xeric conditions, compared to PIM (Figure 2D and Figure 10). The age-dependent response to climate has been previously studied (Carrer and Urbinati, 2004; Linderholm and Linderholm, 2004; Szeicz and MacDonald, 1994); the greater response of young stands can be attributed to a greater physiological plasticity, whereas the cases of old trees being more reactive can be related to a
27
greater sensitivity to adverse conditions such as low nutrients availability or increased water stress (Linderholm and Linderholm, 2004).
These results could clarify future changes in forest productivity. It seems that both young and old stands of PIM and ABB would react in practically the same way to the length of the growing season (CDD0year), which was shown to be the primary
climatic growth driver in our models. This could mean a standardized response to warm conditions for both young and old trees. However, the results regarding maximum temperature and lack of precipitation during the summer (maxTmaxsummer
and noPPTsummer) could mean that a difference between old and young stands would
originate from a negative response of old trees to increasingly xeric conditions, especially for PIM stands. In the meantime, young trees of both species would benefit from warmer conditions while not being overly impeded by xeric conditions (with an upper limit for the summer modifiers equal to 1 for PIM and moderately higher for ABB). Moreover, if a change in the disturbance regime were to modify stand demographics and increase the proportion of young stands in the boreal landscape (through a reduction in fire cycle length for example), then the boreal forest would undergo an even stronger reaction under new climatic conditions. This could negatively impact forest productivity, since we have shown that PIM has a slower growth rate than ABB and could become more abundant in the boreal landscape. But it also raises the point that, in the context of global change, modified fire dynamics are likely to also negatively impact productivity. Indeed, changes in the frequency of wildfires could lead to a reduction of forest volume and increase in area burned (Li et al., 2000; Price et al., 2013).
Bioclimatic domain
Our results are not in agreement with the hypothesis related to differences in climatic response between the two bioclimatic domains. We postulated that growth response will be more affected by temperature in the North and by rainfall in the South. However, few differences were found between northern and southern stands. This was particularly the case for PIM, for which the climatic modifiers had very
28
similar effects between the two bioclimatic domains. The difference between North and South is more pronounced for ABB growth than for PIM growth, suggesting a greater sensitivity of balsam fir to the latitudinal gradient. Although the PIM response to climate remains globally greater than that of ABB (Figure 2), this response is steadier across the northern and southern plots for this species alone. This could stem from a wider adaptation of PIM to the ecological range in the study area.
The positive effect of high values of total radiation (Radiayear) was apparent
for both species in the South. Interannual variations of total radiation can be explained by cloudiness and rainfall patterns; methods of calculating total radiation rely on temperature, relative humidity and precipitation, but also on cloudiness and various atmospheric and topographic parameters (latitude, elevation, aspect, etc.) (Nikolov and Zeller, 1992). In our case, it is likely that latitude explained part of the differences for the two domains in terms of radiation, through different temperature averages and rainfall patterns as well as vapour pressure deficit. The effect of high values of Radiayear in the South is probably linked to warmer conditions and a positive
effect on growth. The same level of total radiation in the North corresponds to lower temperatures, with the effect on growth being lesser than that observed for southern plots.
PIM responded similarly between bioclimatic domains to climatic variables, except for low values of the growing season length (CDD0year) and for total radiation
(Radiayear) (Figure 6A and 6C). In the case of ABB, differences were larger between
bioclimatic domains. In the North, we observed a relatively constant response to
CDD0year, as well as to Radiayear. In the South, the most important response seems
to rely on Radiayear, as well as a strong negative reaction to CDD0year, suggesting a
temperature- and radiation-based response. This goes against our hypothesis of the expected importance of precipitation in the South and temperature in the North. It is however consistent with the general fact that temperature and sunlight are considered limiting factors in boreal forests for the region under study (Boisvenue and Running, 2006).
29
In the context of global warming, increases in rainfall and temperature are expected in the study area (Andalo et al., 2005; Brooks et al., 1998). However, our results show a greater difference in the response to temperature than to rainfall within the two bioclimatic domains. The increase in rainfall could overcome the negative effect of increasingly warmer temperatures and their subsequent impact on water stress for boreal stands, a scenario that has been previously predicted, along with the potential beneficial effect of a longer growing season (Girardin et al., 2008; Hofgaard et al., 1999; Subedi and Sharma, 2013). In the context of our study, interestingly, it would seem that low values of noPPTsummer (i.e. few dry episodes)
are associated with low values of the modifier. This could mean that the rainfall is likely not impacting tree growth as much as temperature is, which is consistent with the fact that water is rarely considered a limiting factor in boreal ecosystems. It could also be linked to cloud cover, noPPTsummer being a possible proxy for nebulosity,
which is in turn linked to light availability for the stands. Cloud cover has been shown to impact evapotranspiration, and thus respiration and biomass production (Bonan et al., 1990).
Differences between the two bioclimatic domains are expressed in terms of cooling degree-days, precipitation and average temperature, but there are other parameters to consider. Namely, soil types distribution varies between the two domains and along an East-West transect as well, with relative abundance of mesic, dry and humid soils depending on the sector within each domain (Gagnon, 2004). These climatic and edaphic differences also translate into different levels of biodiversity, with the spruce-feathermoss totalling less tree species but more herbaceous species than the balsam fir-white birch domain (Gagnon, 2004). This is mainly due to the important difference in size of the two domains. Those differences could not be included in our models, but were probably involved in some of the differences in the climatic growth response for both species within the study area, for example through modulation of soil water availability (Girardin et al., 2015).
30
CONCLUSION
We found that balsam fir and black spruce tended to respond differently to climate. The models evidenced that temperature is important for the growth of both species, while other variables played a less significant role. Paradoxically, the greater response of black spruce compared to balsam fir could lead to a decrease in future productivity in the context of climate change because balsam fir is associated with higher annual growth rates. Indeed, warmer and potentially drier summers, in terms of soil water balance, would impact PIM negatively, while ABB would benefit from the warmer conditions and longer growing season. This response is likely to be modulated by stand age, while the latitudinal gradient does not seem to affect PIM, only ABB. In the end, climate is only one of many factors influencing the productivity of boreal forests, and it is possible that it is not the most prevalent in the context of our study. For example, competition for resources could be superseding the effect of climate.
The anticipated potential changes in productivity for both species would then require further analysis. Our study did not include competition variables at a significant level and it is likely that some of the climatic variables, especially rainfall-related, are proxies for other sources of variance regarding the response to climate, namely the soil water balance. Other factors, such as wildfires, spruce budworm outbreaks and changes in forest composition could either mitigate or amplify the expected effects of climate change in boreal forests. The input of all scientific studies is needed to correctly assess forest productivity as a function of climate change.
31
BIBLIOGRAPHY
Aber, J.D., Federer, C.A., 1992. A generalized, lumped-parameter model of photosynthesis, evapotranspiration and net primary production in temperate and boreal forest ecosystems. Oecologia 92, 463–474. doi:10.1007/BF00317837
Andalo, C., Beaulieu, J., Bousquet, J., 2005. The impact of climate change on growth of local white spruce populations in Québec, Canada. For. Ecol. Manag. 205, 169–182. doi:10.1016/j.foreco.2004.10.045
Araújo, M.B., Pearson, R.G., Thuiller, W., Erhard, M., 2005. Validation of species– climate impact models under climate change. Glob. Change Biol. 11, 1504– 1513. doi:10.1111/j.1365-2486.2005.01000.x
Barrow, E., Maxwell, B., Gachon, P., Canada, Environment Canada, 2004. Climate variability and change in Canada: past, present and future. Environment Canada, Toronto, Ont.
Bergeron, Y., Fenton, N.J., 2012. Boreal forests of eastern Canada revisited: old growth, nonfire disturbances, forest succession, and biodiversity. Botany 90, 509–523. doi:10.1139/b2012-034
Bergeron, Y., Flannigan, M., Gauthier, S., Leduc, A., Lefort, P., 2004a. Past, Current and Future Fire Frequency in the Canadian Boreal Forest: Implications for Sustainable Forest Management. AMBIO J. Hum. Environ. 33, 356–360. doi:10.1579/0044-7447-33.6.356
Bergeron, Y., Gauthier, S., Flannigan, M., Kafka, V., 2004b. Fire regimes at the transition between mixedwood and coniferous boreal forest in northwestern quebec. Ecology 85, 1916–1932. doi:10.1890/02-0716
Boisvenue, C., Running, S.W., 2006. Impacts of climate change on natural forest productivity – evidence since the middle of the 20th century. Glob. Change Biol. 12, 862–882. doi:10.1111/j.1365-2486.2006.01134.x
Bonan, G.B., Shugart, H.H., Urban, D.L., 1990. The sensitivity of some high-latitude boreal forests to climatic parameters. Clim. Change 16, 9–29. doi:10.1007/BF00137344
Bradshaw, C.J.A., Warkentin, I.G., Sodhi, N.S., 2009. Urgent preservation of boreal carbon stocks and biodiversity. Trends Ecol. Evol. 24, 541–548. doi:10.1016/j.tree.2009.03.019
Bräuning, A., Volland-Voigt, F., Burchardt, I., Ganzhi, O., Nauss, T., Peters, T., 2009. Climatic Control of Radial Growth of Cedrela Montana in a Humid Mountain Rainforest in Southern Ecuador. Erdkunde 63, 337–345.
32
Brooks, J.R., Flanagan, L.B., Ehleringer, J.R., 1998. Responses of boreal conifers to climate fluctuations: indications from tree-ring widths and carbon isotope analyses. Can. J. For. Res. 28, 524–533. doi:10.1139/x98-018
Bunn, A.G., Goetz, S.J., Fiske, G.J., 2005. Observed and predicted responses of plant growth to climate across Canada. Geophys. Res. Lett. 32, L16710. doi:10.1029/2005GL023646
Carrer, M., Urbinati, C., 2004. Age-dependent tree-ring growth responses to climate in larix decidua and pinus cembra. Ecology 85, 730–740. doi:10.1890/02-0478
Dale, V.H., Joyce, L.A., Mcnulty, S., Neilson, R.P., Ayres, M.P., Flannigan, M.D., Hanson, P.J., Irland, L.C., Lugo, A.E., Peterson, C.J., Simberloff, D., Swanson, F.J., Stocks, B.J., Michael Wotton, B., 2001. Climate Change and Forest Disturbances. BioScience 51, 723. doi:10.1641/0006-3568(2001)051[0723:CCAFD]2.0.CO;2
Easterling, D.R., Meehl, G.A., Parmesan, C., Changnon, S.A., Karl, T.R., Mearns, L.O., 2000. Climate Extremes: Observations, Modeling, and Impacts. Science 289, 2068–2074. doi:10.1126/science.289.5487.2068
Flannigan, M.D., Stocks, B.J., Wotton, B.M., 2000. Climate change and forest fires. Sci. Total Environ., The Science of the Total Environment 262, 221–229. doi:10.1016/S0048-9697(00)00524-6
Fonweban, J., Gardiner, B., Macdonald, E., Auty, D., 2011. Taper functions for Scots pine (Pinus sylvestris L.) and Sitka spruce (Picea sitchensis (Bong.) Carr.) in Northern Britain. Forestry 84, 49–60. doi:10.1093/forestry/cpq043
Fries, C., Johansson, O., Pettersson, B., Simonsson, P., 1997. Silvicultural models to maintain and restore natural stand structures in Swedish boreal forests. For. Ecol. Manag. 94, 89–103. doi:10.1016/S0378-1127(97)00003-0
Gagnon, D., 2004. La forêt naturelle du Québec, un survol. Rapp. Préparé Pour Comm. D’étude Sur Gest. For. Publique Québécoise Groupe Rech. En Écologie For. Interuniv. Univ. Qué. À Montr.
Girardin, M.P., Hogg, E.H., Bernier, P.Y., Kurz, W.A., Guo, X.J., Cyr, G., 2015. Negative impacts of high temperatures on growth of black spruce forests intensify with the anticipated climate warming. Glob. Change Biol. n/a–n/a. doi:10.1111/gcb.13072
Girardin, M.P., Raulier, F., Bernier, P.Y., Tardif, J.C., 2008. Response of tree growth to a changing climate in boreal central Canada: A comparison of empirical, process-based, and hybrid modelling approaches. Ecol. Model. 213, 209– 228. doi:10.1016/j.ecolmodel.2007.12.010
33
Girardin, M.-P., Tardif, J., 2005. Sensitivity of tree growth to the atmospheric vertical profile in the Boreal Plains of Manitoba, Canada. Can. J. For. Res. 35, 48– 64.
Girardin, M.P., Wotton, B.M., 2009. Summer moisture and wildfire risks across Canada. J. Appl. Meteorol. Climatol. 48, 517–533.
Gower, S.T., Vogt, K.A., Grier, C.C., 1992. Carbon Dynamics of Rocky Mountain Douglas-Fir: Influence of Water and Nutrient Availability. Ecol. Monogr. 62, 43–65. doi:10.2307/2937170
Graumlich, L.J., 1993. Response of tree growth to climatic variation in the mixed conifer and deciduous forests of the upper Great Lakes region. Can. J. For. Res. 23, 133–143. doi:10.1139/x93-020
Green, W., 2005. Econométrie. Upper Saddle River, New Jersey, Pearson Education.
Guay, R., 1995. WinDENDRO V. 6.0 User‘s Guide. Regent Instruments, Inc., Quebec, Canada.
Hamann, A., Wang, T., 2006. Potential effects of climate change on ecosystem and tree species distribution in british columbia. Ecology 87, 2773–2786. doi:10.1890/0012-9658(2006)87[2773:PEOCCO]2.0.CO;2
Hofgaard, A., Tardif, J., Bergeron, Y., 1999. Dendroclimatic response of Picea mariana and Pinus banksiana along a latitudinal gradient in the eastern Canadian boreal forest. Can. J. For. Res. 29, 1333–1346. doi:10.1139/x99-073
Holden, Z.A., Morgan, P., Crimmins, M.A., Steinhorst, R.K., Smith, A.M.S., 2007. Fire season precipitation variability influences fire extent and severity in a large southwestern wilderness area, United States. Geophys. Res. Lett. 34, L16708. doi:10.1029/2007GL030804
Holmes, R.L., 1983. Computer-assisted quality control in tree-ring dating and measurement. Tree-Ring Bull. 43, 69–78.
Huang, J., Tardif, J.C., Bergeron, Y., Denneler, B., Berninger, F., Girardin, M.P., 2010. Radial growth response of four dominant boreal tree species to climate along a latitudinal gradient in the eastern Canadian boreal forest. Glob. Change Biol. 16, 711–731. doi:10.1111/j.1365-2486.2009.01990.x
Kahle, H.-P., Spiecker, H., 1996. Adaptability of radial growth of Norway spruce to climate variations: results of a site specific dendroecological study in high elevations of the Black Forest (Germany). Radiocarbon 38, 785–801.
34
Kasischke, E.S., 2000. Boreal Ecosystems in the Global Carbon Cycle, in: Kasischke, E.S., Stocks, B.J. (Eds.), Fire, Climate Change, and Carbon Cycling in the Boreal Forest, Ecological Studies. Springer New York, pp. 19– 30.
Kljun, N., Black, T.A., Griffis, T.J., Barr, A.G., Gaumont-Guay, D., Morgenstern, K., McCaughey, J.H., Nesic, Z., 2006. Response of Net Ecosystem Productivity of Three Boreal Forest Stands to Drought. Ecosystems 9, 1128–1144. doi:10.1007/s10021-005-0082-x
Landsberg, J.J., Sands, P., 2010. Physiological Ecology of Forest Production: Principles, Processes and Models. Academic Press.
Landsberg, J.J., Waring, R.H., 1997. A generalised model of forest productivity using simplified concepts of radiation-use efficiency, carbon balance and partitioning. For. Ecol. Manag. 95, 209–228.
Li, C., Flannigan, M.D., Corns, I.G., 2000. Influence of potential climate change on forest landscape dynamics of west-central Alberta. Can. J. For. Res. 30, 1905–1912. doi:10.1139/x00-118
Liñán, I.D., Gutiérrez, E., Heinrich, I., Andreu-Hayles, L., Muntán, E., Campelo, F., Helle, G., 2011. Age effects and climate response in trees: a multi-proxy tree-ring test in old-growth life stages. Eur. J. For. Res. 131, 933–944. doi:10.1007/s10342-011-0566-5
Linderholm, H.W., Linderholm, K., 2004. Age-dependent climate sensitivity of Pinus sylvestris L. in the central Scandinavian Mountains. Boreal Environ. Res. 9, 307–318.
Lindner, M., Maroschek, M., Netherer, S., Kremer, A., Barbati, A., Garcia-Gonzalo, J., Seidl, R., Delzon, S., Corona, P., Kolström, M., Lexer, M.J., Marchetti, M., 2010. Climate change impacts, adaptive capacity, and vulnerability of European forest ecosystems. For. Ecol. Manag., Selected papers from the conference on “Adaptation of Forests and Forest Management to Changing Climate with Emphasis on Forest Health: A Review of Science, Policies and Practices”, Umeå, Sweden, August 25-28, 2008. 259, 698–709. doi:10.1016/j.foreco.2009.09.023
Llorens, P., Poyatos, R., Latron, J., Delgado, J., Oliveras, I., Gallart, F., 2010. A multi-year study of rainfall and soil water controls on Scots pine transpiration under Mediterranean mountain conditions. Hydrol. Process. 24, 3053–3064. doi:10.1002/hyp.7720
Mäkelä, A., Pulkkinen, M., Kolari, P., Lagergren, F., Berbigier, P., Lindroth, A., Loustau, D., Nikinmaa, E., Vesala, T., Hari, P., 2008. Developing an empirical model of stand GPP with the LUE approach: analysis of eddy covariance data
35
at five contrasting conifer sites in Europe. Glob. Change Biol. 14, 92–108. doi:10.1111/j.1365-2486.2007.01463.x
Millar, C.I., Stephenson, N.L., Stephens, S.L., 2007. Climate change and forests of the future: managing in the face of uncertainty. Ecol. Appl. 17, 2145–2151. doi:10.1890/06-1715.1
Morneau, C., Landry, Y., Berger, J.-P., Forêt Québec, Direction des inventaires forestiers, 2007. Guide de reconnaissance des types écologiques : région écologique 6h : collines du lac Péribonka, région écologique 6i : hautes collines du réservoir aux Outardes. Ministère des ressources naturelles et de la faune, Forêt Québec, Direction des inventaires forestiers : Direction des communications, Québec.
Nikolov, N.T., Zeller, K.F., 1992. A solar radiation algorithm for ecosystem dynamic models. Ecol. Model. 61, 149–168. doi:10.1016/0304-3800(92)90015-7 Nilsson, M.-C., Wardle, D.A., 2005. Understory vegetation as a forest ecosystem
driver: evidence from the northern Swedish boreal forest. Front. Ecol. Environ. 3, 421–428. doi:10.1890/1540-9295(2005)003[0421:UVAAFE]2.0.CO;2 Nordin, A., Högberg, P., Näsholm, T., 2001. Soil nitrogen form and plant nitrogen
uptake along a boreal forest productivity gradient. Oecologia 129, 125–132. doi:10.1007/s004420100698
Pearson, R.G., Dawson, T.P., 2003. Predicting the impacts of climate change on the distribution of species: are bioclimate envelope models useful? Glob. Ecol. Biogeogr. 12, 361–371. doi:10.1046/j.1466-822X.2003.00042.x
Pienaar, L.V., Turnbull, K.J., 1973. The Chapman-Richards generalization of Von Bertalanffy’s growth model for basal area growth and yield in even-aged stands. For. Sci. 19, 2–22.
Pinheiro, J., Bates, D., DebRoy, S., Sarkar, D., 2014. R Core Team (2014). nlme: linear and nonlinear mixed effects models. R package version 3.1–117. Pinheiro, J.C., Bates, D.M., 2000. Mixed-effects models in S and S-PLUS. Springer
Science & Business Media.
Price, D.T., Alfaro, R.I., Brown, K.J., Flannigan, M.D., Fleming, R.A., Hogg, E.H., Girardin, M.P., Lakusta, T., Johnston, M., McKenney, D.W., Pedlar, J.H., Stratton, T., Sturrock, R.N., Thompson, I.D., Trofymow, J.A., Venier, L.A., 2013. Anticipating the consequences of climate change for Canada’s boreal forest ecosystems. Environ. Rev. 21, 322–365. doi:10.1139/er-2013-0042 Raulier, F., Bernier, P., Ung, C.-H., 2000. Modeling the influence of temperature on
monthly gross primary productivity of sugar maple stands. Tree Physiol. 20, 333–345. doi:10.1093/treephys/20.5-6.333
36
R Core Team, 2013. R: A Language and Environment for Statistical Computing. Vienna, Austria, 2011.
Régnière, J., Cooke, B.J., Bergeron, V., 1995. BioSIM: a computer-based decision support tool for seasonal planning of pest management activities. User's manual. Natural Resources Canada, Canadian Forest Service, Laurentian Forestry Centre, Sainte-Foy, Quebec. Information Report LAU-X-116. 67 p.
Rossi, S., Deslauriers, A., Anfodillo, T., Morin, H., Saracino, A., Motta, R., Borghetti, M., 2006. Conifers in cold environments synchronize maximum growth rate of tree-ring formation with day length. New Phytol. 170, 301–310. doi:10.1111/j.1469-8137.2006.01660.x
Ryan, M.G., Binkley, D., Fownes, J.H., 1997. Age-related decline in forest productivity: pattern and process. Adv. Ecol. Res. 27, 213–262.
Sailor, D.J., 1998. Simulations of annual degree day impacts of urban vegetative augmentation. Atmos. Environ., Conference on the Benefits of the Urban Forest 32, 43–52. doi:10.1016/S1352-2310(97)00178-7
Subedi, N., Sharma, M., 2013. Climate-diameter growth relationships of black spruce and jack pine trees in boreal Ontario, Canada. Glob. Change Biol. 19, 505– 516. doi:10.1111/gcb.12033
Szeicz, J.M., MacDonald, G.M., 1994. Age-dependent tree-ring growth responses of subarctic white spruce to climate. Can. J. For. Res. 24, 120–132. doi:10.1139/x94-017
Theil, H., 1971. Principles of econometrics. Wiley, New York.
Ung, C.-H., Bernier, P.Y., Raulier, F., Fournier, R.A., Lambert, M.-C., Régnière, J., 2001. Biophysical Site Indices for Shade Tolerant and Intolerant Boreal Species. For. Sci. 47, 83–95.
Vanclay, J.K., Skovsgaard, J.P., 1997. Evaluating forest growth models. Ecol. Model. 98, 1–12.
Weber, M.G., Flannigan, M.D., 1997. Canadian boreal forest ecosystem structure and function in a changing climate: impact on fire regimes. Environ. Rev. 5, 145–166. doi:10.1139/a97-008
Zhang, K., Kimball, J.S., Hogg, E.H., Zhao, M., Oechel, W.C., Cassano, J.J., Running, S.W., 2008. Satellite-based model detection of recent climate-driven changes in northern high-latitude vegetation productivity. J. Geophys. Res. Biogeosciences 113, G03033. doi:10.1029/2007JG000621
37
Zhang Q., Alfaro, R.I., Hebda, R.J., 1999. Dendroecological studies of tree growth, climate and spruce beetle outbreaks in Central British Columbia, Canada. For. Ecol. Manag. 121, 215–225. doi:10.1016/S0378-1127(98)00552-0
38
SUPPLEMENTARY MATERIALS
39
Figure 9: Ratio of 10-year average BAI for PIM/ABB between 1 and 171 years (intervals 1:10, 11:20, etc.).
40
Figure 10: Contour plot of the product of CDD0.year and noPPT.summer adjusted modifiers on a CDD0.year × noPPT.summer grid.