Publisher’s version / Version de l'éditeur:
Vous avez des questions? Nous pouvons vous aider. Pour communiquer directement avec un auteur, consultez la première page de la revue dans laquelle son article a été publié afin de trouver ses coordonnées. Si vous Questions? Contact the NRC Publications Archive team at
[email protected]. If you wish to email the authors directly, please see the first page of the publication for their contact information.
https://publications-cnrc.canada.ca/fra/droits
L’accès à ce site Web et l’utilisation de son contenu sont assujettis aux conditions présentées dans le site
LISEZ CES CONDITIONS ATTENTIVEMENT AVANT D’UTILISER CE SITE WEB.
18th International Symposium on Ice [Proceedings], 2006
READ THESE TERMS AND CONDITIONS CAREFULLY BEFORE USING THIS WEBSITE.
https://nrc-publications.canada.ca/eng/copyright
NRC Publications Archive Record / Notice des Archives des publications du CNRC :
https://nrc-publications.canada.ca/eng/view/object/?id=8fb04f4e-96f0-4e13-8da9-c9c1d9f11ee0 https://publications-cnrc.canada.ca/fra/voir/objet/?id=8fb04f4e-96f0-4e13-8da9-c9c1d9f11ee0
Archives des publications du CNRC
This publication could be one of several versions: author’s original, accepted manuscript or the publisher’s version. / La version de cette publication peut être l’une des suivantes : la version prépublication de l’auteur, la version acceptée du manuscrit ou la version de l’éditeur.
Access and use of this website and the material on it are subject to the Terms and Conditions set forth at Apparatus design evolution and supporting experiments for a novel technique to study ice crushing
APPARATUS DESIGN EVOLUTION AND SUPPORTING EXPERIMENTS
FOR A NOVEL TECHNIQUE TO STUDY ICE CRUSHING
R.E. Gagnon1 and C. Daley2
1
Institute for Ocean Technology National Research Council of Canada St. John's, NL, Canada, A1B 3T5
2
Faculty of Engineering and Applied Science Memorial University of Newfoundland St. John's, NF, A1B 3X5
ABSTRACT
Ice crushing experiments similar to Gagnon and Daley (2005) have been repeated at twice the former high-speed video rate (1000 images/s) and with the intention of eliminating in-plane fractures that occurred in all previous tests. Rectangular thick sections (1 cm thickness) of lab-grown monocrystalline ice were confined between two thick Plexiglas plates and crushed at –10oC from one edge face at a rate of 1 cm/s using a transparent Plexiglas platen (1 cm thickness) inserted between the plates. Visual data were recorded from the side using the high-speed video and vertically through the platen using regular video. It was concluded that the system was too compliant to prevent the in-plane fractures, however, one test did show near full-thickness intact ice. From this test unambiguous pressure measurements were obtained for the intact and pulverized ice at the ice/platen interface utilizing the system’s novel pressure sensor. As in the previous report, the production and flow of liquid in a thin layer at the intact ice/platen interface was evident. The apparatus was then modified significantly to reduce its compliance and more tests were conducted with the eventual desired result that in-plane fractures in the ice were eliminated. This confirmed that the apparatus is capable of yielding visual data of a 2-D slice of ice during crushing as though it was part of a larger piece of ice.
Gagnon, R.E. and Daley, C. 2005. Dual-axis video observations of ice crushing utilizing high-speed video for one perspective. POAC 2005, Potsdam, New York, Vol. 1, 271-282.
INTRODUCTION
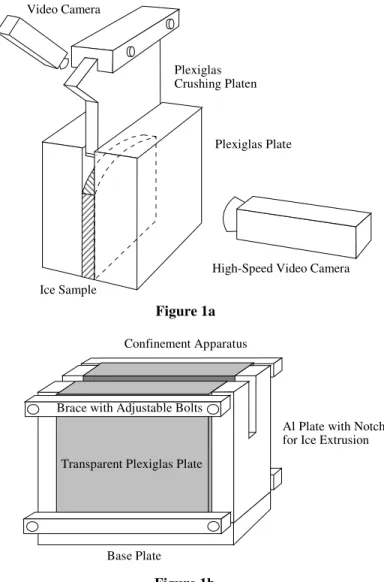
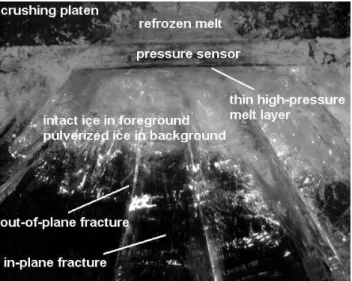
While much progress has been made in the last 2 decades concerning the processes involved in ice crushing, considerable study remains in order to resolve divergent views that have developed. The importance of observing the ice behavior is, no doubt, a key factor. Here we report on-going development and results from a novel apparatus (Figure 1) designed to permit direct viewing of ice behavior during crushing. The goal for the design was to essentially take a slice of ice and observe its behavior during edge-on crushing as though it were part of a larger piece being crushed. The success of the apparatus until now has been limited because of in-plane fractures that persistently occurred in the ice specimens (Figure 2), with pulverized ice forming on one side of the fracture tending to obscure observations and likely influence the ice behavior (Gagnon and Daley, 2005).
Here we initially present some experimental results that are perhaps the best that could be obtained with the original apparatus. We term these results as ‘best’ because the ice sample at least partially behaved as was intended by the apparatus design. While using the
original ice-holder the ice always developed in-plane fractures, however, in this particular test a portion of the ice remained largely intact throughout almost all the thickness of the sample. Hence, the pressure measurements were unambiguous and basic calculations of energy dissipation could reliably be made. We then describe attempts to remedy the problem of the in-plane fractures and eventually identifying the compliance of the ice-holder as the source of the trouble. Finally we discuss the design modifications that eventually facilitated the desired ice behavior, that is, no in-plane cracking or dissimilar behavior through the lateral thickness of the ice specimen during crushing. We view the technique as an important new development for studying ice behavior during impact and indentation, both at the lab scale and up to full scale, and therefore worthy of the efforts to refine the apparatus.
High-Speed Video Camera Plexiglas Crushing Platen Plexiglas Plate Ice Sample 12 cm Acrylic Transparent Plexiglas Plate
Al Plate with Notch for Ice Extrusion
Base Plate
Confinement Apparatus
Brace with Adjustable Bolts Figure 1a
Figure 1b Video Camera
Figure 1. (a) Conceptual schematic of the ice crushing test method. (b) Details of the ice-holder as originally designed (Gagnon and Daley, 2005).
DESCRIPTION OF TEST USING ORIGINAL APPARATUS
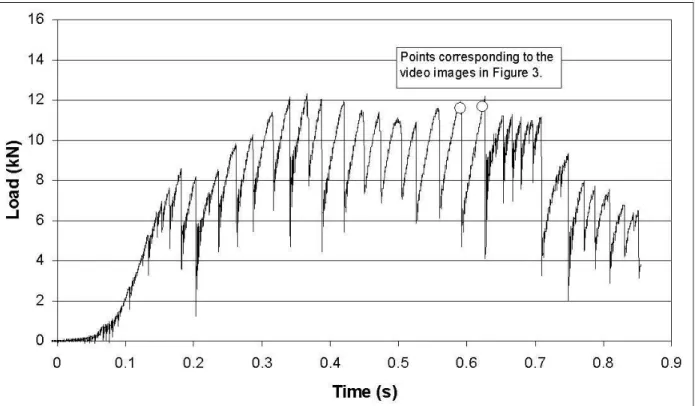
The test was conducted at –10oC with the crushing platen moving at a nominal speed of 10 mm/s. Figure 3 shows two images from the high-speed video record. Figure 4 shows the corresponding portion of the load data with the points at which the images were acquired. Hence the load shows a load drop event had occurred between the two images due to a spall in the region of contact. Figure 3 shows inset images (correctly positioned and to scale) from the downward viewing regular video camera of the contact region between the ice and the platen. While the ice has some cracks in it, it remains largely intact in the region of contact. This is evident from the transparency of the ice in the high-speed video images and also from the downward looking images, where intact ice shows up dark (between the base and the white line)
Figure 2. Image from a high-speed video record indicating various aspects of the apparatus and ice behavior (Gagnon and Daley, 2005).
Figure 3. Two high-speed digital images from the test with the original apparatus. The ice slab is in the plane of the image and the view is through a Plexiglas plate as shown in Figure 1. Images of the platen/ice contact from the top camera are inset (to scale) on the high-speed images. Fairly intact ice is visible in the area subscribed from the base of the inset images up to the white line. Similarly the pressure sensor contact is the area subscribed from the bottom of the inset images up to the black line. The test was conducted at –10oC, where the crushing platen moved at a rate of 10 mm/s.
and pulverized ice is usually lighter. Overlain on the inset images are the contact areas for the pressure sensor (the area between the base of the image and dark line). We see that the intact ice spans close to the full width of the ice, and that the pressure on the ice where the span is thickest spans the full width, i.e. at least 30 MPa (Gagnon and Daley, 2005). If we take the area of the intact ice and the pressure we find that about half of the load is supported on that ice and the rest on the pulverized material, where the pressure is lower, mostly out of view. Gagnon (2004) has described the method whereby ice is removed from the intact zones, i.e. through melting as a result of heat generation in the flow of a thin layer of liquid under high pressure. Spalling occurs both at the sides of the intact zone, and also at the lateral edges of the intact ice. Each spall leads to a load drop, large or small, depending on the size of the spall. The production of liquid and wetting of surrounding pulverized ice was observed here as in previous experiments.
The vertical compliance of the ice/apparatus system has been determined (Gagnon and Daley, 2005) so that the actual movement of the platen towards the ice during a load drop can be calculated. On the sharp descending side of the sawtooth between the image markers in Figure 4 the load dropped by about 5.8 kN in about 0.35 ms. Hence, using the compliance (1.07x10⁻⁷ m/N), we see that the platen moved against the ice 6.20x10⁻⁴ m in 0.35 ms, that is, at a rate at ~ 1.77 m/s during the load drop, 177 times the nominal penetration rate! Alternatively the penetration at the load drop can be measured off the images to yield a similar penetration rate.
Figure 4. Load record for the test shown in Figure 3 with markers (open circles) corresponding to the two images. The images and makers are in sequence from left to right.
ELIMINATION OF IN-PLANE FRACTURES
Various means were employed in this test series to eliminate the in-plane fractures. Different shapes for the top of the ice were employed, a semi-cylindrical platen head was tried, a test was run at a higher temperature of –6oC, and a test run at a slower nominal indentor speed, 5 mm/s. No scenario worked to effect, however close scrutiny of the ice-holder apparatus showed evidence of considerable lateral compliance in the space filled by the ice. Consequently some compliance tests were conducted with the apparatus where the space between the Plexiglas plates was filled with several sheets of rubber instead of ice and load was applied with the platen inserted between the plates to create a fairly uniform pressure between the plates. The lateral compliance of the apparatus was measured and it was evident that the aluminum bars and Plexiglas were
bending and bulging outward to a considerable degree that could not be accommodated by the ice without causing fractures. A finite element model of the situation was generated which yielded similar degrees of deformation (Figure 5). This explained why there were times during some crushing tests where the ice slab would lose contact with the Plexiglas in places, that is, a small gap appeared between the ice slab and the deformed Plexiglas.
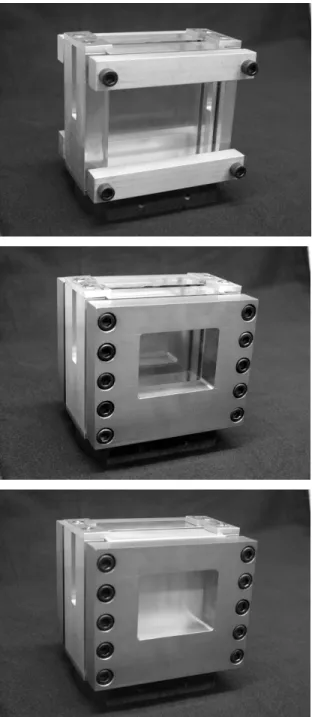
To eliminate the bending of the bars, and minimize bulging of the Plexiglas, a much more rigid design was used incorporating thick steel plates, with relatively small viewing portals and more securing bolts, to constrain to Plexiglas, as shown in Figure 6, center. This practically eliminated bending and bulging of the outer faces of the Plexiglas plates, relative to what it had been before. When subsequent ice crushing experiments were conducted, however, the ice behavior had improved somewhat but the in-plane fractures still occurred. Analysis of the finite element results showed that even though the steel plates eliminated the former bending and bulging of the outer Plexiglas surfaces, the Plexiglas itself would still deform by compression as a result of the applied inner pressure. This was an inherent characteristic of the Plexiglas which could only be resolved by using a material with a substantially higher modulus of elasticity.
To test the hypothesis the Plexiglas plates were replaced by solid aluminum plates of the same dimensions (Figure 6, bottom) and two more ice crushing tests were conducted. Of course the aluminum does not provide a view of the ice from the side, however, the downward looking view
Figure 5. Finite element model of the original ice-holder apparatus showing deformation of the aluminum bracing bars and the Plexiglas plates in response to a uniformly applied pressure to the inner surface of the Plexiglas plates. The numbers on the color scheme are millimeters.
through the crushing platen could still show the ice behavior. The high-speed camera was now used for the downward view and it clearly revealed that the ice was behaving as desired in the original intent of the apparatus. No in-plane fractures could be discerned and virtually all spalling activity, and subsequent movement of material, was along the axis of the slot between the plates, rather than laterally as was the case prior to using the aluminum plates.
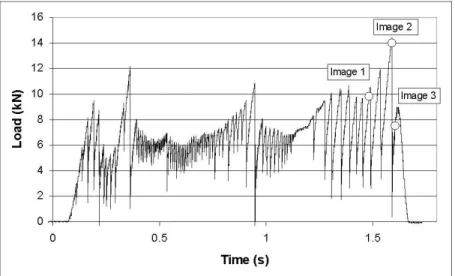
Figure 7 shows the load record for the first test using the stiffened apparatus. Figure 8 shows images from the high-speed video as viewed looking down through the crushing platen that are associated with the points indicated on the load record. The images are somewhat grainy because they required enhancement since the lighting was inadequate during the test. The first image shows an example of a hard zone spanning the full width of the slot. The area of the zone, assuming a pressure of 30 MPa, indicates it supported about 50% of the load. The second and third images show another hard zone spanning the slot prior to and after a spall event that considerably reduces the size of the intact hard zone. The zone before the load drop supports about 10 kN, ~75% of the load. After the load drop the reduced zone supports around 2 kN, ~25% of the load. The load distribution between hard zones and pulverized ice clearly varies considerably throughout these tests. The load drop associated with this spall event is seen on the load record and corresponds to about 9 kN, that is, between the peak and the bottom of the load drop. Hence in this case the change in the size of the hard zone due to the spall accounts for most of the change in load at the load drop. The hard zone in the third image was the last hard zone appearing at the end of the test. A photo was taken after the test with the ice still inside the ice-holder to confirm the integrity of the ice, and to verify that it spanned the width of the slot (Figure 9).
Figure 10 shows the load record for the second test
with the rigid apparatus. Figure 11 shows five images from the high-speed video associated with Figure 6. Evolution of the ice-holder apparatus from the original version (top), to the stiffened version with Plexiglas plates (center), to the present version where the Plexiglas plates have been replaced by aluminum plates (bottom).
the test, where the images are indicated on the load record. The lighting was better for this test so the images required less enhancing than the first test. The first image shows a fairly large zone, where the load supported is around 2.6 kN (~33% of the total load), again assuming a pressure of 30 MPa over its area. The rest of the load would have been supported by the remaining intact ice in view and likely more pulverized and intact ice out of view. The second and third images, and fourth and fifth images show two other hard zones each before and
after a spall breaks away from it. These images show hard zone areas that are relatively small. Hence they support relatively small loads compared to the total load, thus indicating that the greater majority of load is supported by the pulverized ice, and possible intact and pulverized ice that is out of view. The images nevertheless show spalling from the hard zones at the load drops. The load drops associated with the spalling events are indicated on the load record, i.e. the drop between Images 2 and 3, and between Images 4 and 5. Following similar calculations as in the first test above we can determine that about 25% of the first load drop is associated with the change in area of the hard zone, assuming the pressure of 30 MPa as before. Hardly any of the second load drop can be associated with the change in area of the hard zone since in this case the spall caused a shape change to the hard zone but not much of a change in area because the right side of the hard zone increased in size as the platen moved against the ice during the load drop. All of the discussion above should be taken for the most part
as qualitative since there was not a full view of the complete contact area between the platen and ice in these tests, hence
Figure 7. Load record for the test shown in Figure 8 with markers (open circles) corresponding to the three images. The images and makers are in sequence from left to right.
Figure 8. Three high-speed video images as viewed through the crushing platen showing ice contact during the first test. The images are ordered according to the points indicated on the load record in Figure 7. The intact hard zones (dark areas) are outlined and lighter areas are generally pulverized ice. The width of each image is 1 cm. The images are grainy due to enhancement required because of inadequate light levels during the test.
there was pulverized ice out of the view, and quite likely even hard zones areas. The exercise was intended more to demonstrate that intact hard zones of ice did span the space between the platens as evidence that no in-plane fractures had occurred in the ice. The images of the ice crushing presented above require a fair amount of explanation due to the somewhat complex nature of the ice behavior during crushing and limitations of printed media. The images are much easier to interpret when one views the actual video records and can see the spalling behavior and flow of material away from higher pressure zones as the crushing experiment progresses. We note that spalling in the former apparatus, as shown in the test in Figure 3, occurred routinely at the lateral edge of the intact zone, rather than at the sides of the hard zones in the slot as in the latter tests. This also confirms that the stiffened apparatus achieves the desired goal.
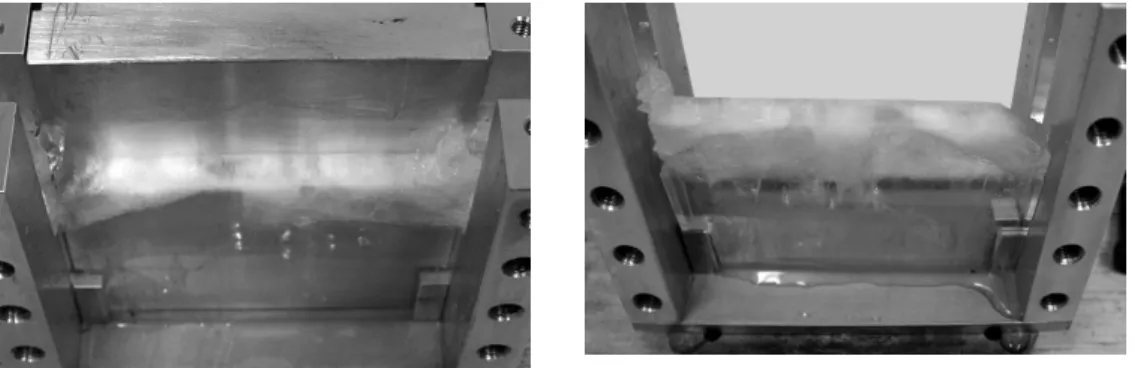
Furthermore, following the last experiment the apparatus was dismantled to reveal the ice that remained. As expected the ice was intact in the hard zone region and no in-plane fractures were visible (Figures 12). These outcomes constitute a significant advancement for the apparatus. In the next incarnation the apparatus will have solid glass plates instead of the aluminum plates. The glass has a stiffness of about 50% of the aluminum whereas the Plexiglas was around 20 times more compliant. Hence the solid glass will have the necessary stiffness to prevent the in-plane fractures and provide the transparency to enable the all-important visual observations.
Figure 9. View of an intact hard zone in the ice-holder following the test shown in Figure 8. The hard zone corresponds to the last image in Figure 8.
Figure 10. Load record for the test shown in Figure 11 with markers (open circles) corresponding to the five images. The images and makers are in sequence from left to right.
CONCLUSIONS
The design of a unique apparatus for studying ice crushing processes was modified to eliminate in-plane fractures that previously occurred in the ice during crushing experiments. The problem was shown to be associated with the compliance of the apparatus. By stiffening the ice-holder and replacing the ‘soft’ Plexiglas plates with aluminum plates the problem was solved. Hence, the next version of the apparatus will have hard glass plates in place of the aluminum plates, with a much higher elastic modulus than the former Plexiglas plates, to provide visual access to the ice behavior.
The goal of this on-going research is to provide an unobstructed detailed view of the mechanisms at play in the region of contact during ice crushing. We recognize that fractures at various orientations will occur naturally in ice when it is being crushed, however, the intent of confining a thick section of ice in one direction is to preferentially prevent in-plane cracks, including any that may arise purely from the apparatus design, without adversely affecting out-of-plane cracking and other behaviour such as the flow of melt and pulverized material in the unconfined direction. The efficacy of the technique is evident in that the behaviors already observed are similar to those seen in traditional 3-D ice crushing tests (Gagnon, 1999), and are much more visually accessible.
ACKNOWLEDGEMENTS
The authors would like to thank the Program of Energy Research and Development (PERD) and IOT for their financial support of this research.
REFERENCES
Gagnon, R. (2004), “Side-Viewing High-Speed Video Observations of Ice Crushing”, Proceedings of IAHR 2004, St. Petersburg, Russia, Vol. 2, 289-298.
Gagnon, R. E. (1999), “Consistent Observations of Ice Crushing in Laboratory Tests and Field Figure 11. Five high-speed video images as viewed
through the crushing platen showing ice contact during the second test. The images are ordered from left to right according to the points indicated on the load record in Figure 10. The intact hard zones (dark areas) are outlined and lighter areas are generally pulverized ice. The bright areas are light reflections from the lighting system. The dark band in the middle of the bright zone near the top of the images is the pressure sensor contact width. The width of each image is 1 cm.
Experiments Covering Three Orders of Magnitude in Scale”, Proceedings of the 15th International Conference on Port and Ocean Engineering under Arctic Conditions, POAC-99, Helsinki, Finland, Vol. 2, 858-869.
Gagnon, R.E. and Daley, C. (2005), “Dual-axis video observations of ice crushing utilizing high-speed video for one perspective”, Proceedings of POAC 2005, Potsdam, New York, Vol. 1, 271-282.
Figure 12. Photos of ice inside the partially dismantled ice-holder following the second test. The dark area at the top of the ice in the left image is an intact hard zone, with intact ice below it, free of in-plane fractures. Pulverized ice appears white. The right image shows the other side of the same ice, rotated 180o.