arXiv:1512.04342v2 [astro-ph.GA] 7 Jan 2016
Astronomy & Astrophysicsmanuscript no. Koulouridis˙supeclusters˙final c ESO 2016
January 8, 2016
The XXL Survey
⋆
XII. Optical spectroscopy of X-ray-selected clusters and the frequency of AGN in
superclusters
E. Koulouridis
1,2, B. Poggianti
3, B. Altieri
4, I. Valtchanov
4, Y. Jaff´e
5, C. Adami
6, A. Elyiv
7,8, O. Melnyk
9,10, S.
Fotopoulou
11, F. Gastaldello
12, C. Horellou
13, M. Pierre
1, F. Pacaud
14, M. Plionis
15,2,16, T. Sadibekova
1, and J. Surdej
171 Service d’Astrophysique AIM, DSM/IRFU/SAp, CEA Saclay, F-91191 Gif sur Yvette, France
2 Institute for Astronomy & Astrophysics, Space Applications & Remote Sensing, National Observatory of Athens, Palaia Penteli 15236, Athens, Greece
3 INAF - Astronomical Observatory of Padova, Vicolo Osservatorio 5 - 35122 - Padova, Italy
4 European Space Astronomy Centre (ESA/ESAC), Operations Department, Villanueva de la Can˜ada (Madrid), Spain 5 Department of Astronomy, Universidad de Concepci´on, Casilla 160-C, Concepci´on, Chile
6 LAM, OAMP, Universit´e Aix-Marseille, CNRS, Pˆole de l’ ´Etoile, Site de Ch˜ateau Gombert, 38 rue Fr´ed´eric Joliot-Curie, 13388, Marseille 13 Cedex, France
7 Dipartimento di Fisica e Astronomia, Universit`a di Bologna, Viale Berti Pichat 6/2, I-40127 Bologna, Italy
8 Main Astronomical Observatory, Academy of Sciences of Ukraine, 27 Akademika Zabolotnoho St., 03680 Kyiv, Ukraine 9 Department of Physics, University of Zagreb, Bijenicka cesta 32, HR-10000 Zagreb, Croatia
10 Astronomical Observatory, Taras Shevchenko National University of Kyiv, 3 Observatorna St., 04053 Kyiv, Ukraine 11 Department of Astronomy, University of Geneva, ch. d’Ecogia 16, CH-1290 Versoix, Switzerland
12 INAF - IASF - Milano, Via Bassini 15, I-20133 Milano, Italy
13 Dept. of Earth and Space Sciences, Chalmers University of Technology, Onsala Space Observatory, SE-439 92 Onsala, Sweden 14 Argelander-Institut f¨ur Astronomie, University of Bonn, Auf dem H¨ugel 71, 53121 Bonn, Germany
15 Physics Department of Aristotle University of Thessaloniki, University Campus, 54124, Thessaloniki, Greece 16 Instituto Nacional de Astrof´ısica Optica y Electr´onica, Puebla, C.P. 72840, M´exico
17 Institut d’Astrophysique et de G´eophysique, Universit´e de Li`ege, 4000 Li`ege, Belgium Received/Accepted
ABSTRACT
Context.This article belongs to the first series of XXL publications. It presents multifibre spectroscopic observations of three 0.55 deg2 fields in the XXL Survey, which were selected on the basis of their high density of X-ray-detected clusters. The observations were obtained with the AutoFib2+WYFFOS (AF2) wide-field fibre spectrograph mounted on the 4.2m William Herschel Telescope.
Aims.The paper first describes the scientific rationale, the preparation, the data reduction, and the results of the observations, and then presents a study of active galactic nuclei (AGN) within three superclusters.
Methods.To determine the redshift of galaxy clusters and AGN, we assign high priority to a) the brightest cluster galaxies (BCGs), b) the most probable cluster galaxy candidates, and c) the optical counterparts of X-ray point-like sources. We use the outcome of the observations to study the projected (2D) and the spatial (3D) overdensity of AGN in three superclusters.
Results.We obtained redshifts for 455 galaxies in total, 56 of which are counterparts of X-ray point-like sources. We were able to determine the redshift of the merging supercluster XLSSC-e, which consists of six individual clusters at z ∼ 0.43, and we confirmed the redshift of supercluster XLSSC-d at z ∼ 0.3. More importantly, we discovered a new supercluster, XLSSC-f, that comprises three galaxy clusters also at z ∼ 0.3. We find a significant 2D overdensity of X-ray point-like sources only around the supercluster XLSSC-f. This result is also supported by the spatial (3D) analysis of XLSSC-f, where we find four AGN with compatible spectroscopic redshifts and possibly one more with compatible photometric redshift. In addition, we find two AGN (3D analysis) at the redshift of XLSSC-e, but no AGN in XLSSC-d. Comparing these findings with the optical galaxy overdensity we conclude that the total number of AGN in the area of the three superclusters significantly exceeds the field expectations. All of the AGN found have luminosities below 7 × 1042erg s−1.
Conclusions.The difference in the AGN frequency between the three superclusters cannot be explained by the present study because of small number statistics. Further analysis of a larger number of superclusters within the 50 deg2 of the XXL is needed before any conclusions on the effect of the supercluster environment on AGN can be reached.
Key words.galaxies: active – galaxies: Clusters: general – X-rays: galaxies: clusters – galaxies: interactions – galaxies: evolution – cosmology: large scale structure of Universe
⋆ Based on observations obtained with XMM-Newton, an ESA
sci-ence mission with instruments and contributions directly funded by ESA Member States and NASA. Based on observations obtained with the William Herschel telescope during semester 13B.
1. Introduction
As structures grow hierarchically, galaxies are accreted by pro-gressively more massive dark matter halos, and the majority of galaxies end up in clusters (Eke et al. 2004; Calvi et al. 2011).
Clusters are therefore the predominant environment of galaxies and can play a very important role in establishing galaxy prop-erties.
Although there is no explicit classification, galaxy concen-trations with more than 50 members and more massive than 1014M⊙ are defined as galaxy clusters. Less massive aggrega-tions with less than 50 galaxies are called galaxy groups. We note that according to the above classification most of the ex-tended X-ray sources in the current study are clusters.
Clusters and groups are usually identified by optical and in-frared surveys as concentrations of red-sequence galaxies (e.g. Gladders & Yee 2000; Koester et al. 2007a; Hao et al. 2010; Rykoff et al. 2014; Bleem et al. 2015) or galaxy overdensi-ties in photometric redshift space (e.g. Wen, Han & Liu 2009, 2012; Szabo et al. 2011) and they are confirmed by follow-up spectroscopy. They can also be identified by X-ray observations as extended sources, unambiguously testifying the presence of hot gas trapped in the potential well of a virialised system (e.g. Pierre et al. 2004; Pacaud et al. 2007; Pierre et al. submitted, hereafter XXL paper I). X-ray selected cluster samples are rarer and smaller than optically selected ones, and deep X-ray obser-vations are required to probe a significant range of halo masses. The properties of galaxy populations in groups and clusters vary enormously. At low redshift, it is well known that some galaxy groups are dominated by early-type, passively evolving galaxies, similarly to clusters, while others have a galaxy popu-lation resembling that of the field, mostly composed of late-type, star-forming galaxies (Zabludoff & Mulchaey 1998). Recent studies of optically selected clusters at intermediate redshifts have found a similar variety. Surveys like EDisCS (Poggianti et al. 2006, 2009), zCOSMOS (Iovino et al. 2010), and CNOC2 (Wilman et al. 2005, 2008) find that cluster galaxies differ sig-nificantly from galaxies that reside in lower mass halos in the field, but with a wide range of properties at a given cluster ve-locity dispersion. Whether this variety originates from the dif-ference between virialised clusters and clusters in formation or from unbound galaxy associations is still an open question, es-pecially given the broad spread in galaxy properties observed in the currently small X-ray selected samples (Jeltema et al. 2007; Urquhart et al. 2010).
The effect of the group and cluster environment on the activ-ity of the central supermassive black hole (SMBH) of galaxies and vice versa is still fairly undetermined, but nevertheless cru-cial. Galaxy clusters represent one end of the density spectrum in our universe, and as such they are an ideal place to inves-tigate the effect of the dense environment in the triggering of active galactic nuclei (AGN), especially since an excessive num-ber of X-ray point-like sources are undoubtedly found there (e.g. Cappi et al. 2001; Molnar et al. 2002; Johnson et al. 2003; D’Elia et al. 2004; Cappelluti 2005; Gilmour et al. 2009). Specifically, for the XMM-LSS field, 60% of X-ray-selected AGN reside in the overdense regions of group-like environment (Melnyk et al. 2013). We note that AGN can be used as cosmological probes to trace the large-scale structure at high redshifts (e.g. Einasto et al. 2014), and thus the study of the AGN frequency-to-density relation is essential.
Theoretically, the feeding of the black hole can only be achieved by means of a non-axisymmetric perturbation that duces mass inflow. This kind of perturbation can occur in in-teractions and merging between two galaxies, which results in the feeding of the black hole and the activation of the AGN phase (e.g. Umemura 1998; Kawakatu et al. 2006; Koulouridis et al. 2006a, 2006b, 2013; Koulouridis 2014; Ellison et al. 2011; Silverman et al. 2011; Villforth et al. 2012; Hopkins & Quataert
2011). Thus, the cluster environment, where the concentration of galaxies is very high relative to the field, would also seem favourable to AGN. However, the rather extreme conditions within the gravitational potential of a galaxy cluster can work in the opposite direction as well. The ram pressure from the in-tracluster medium (ICM) is probably able to strip or evaporate the cold gas reservoir of galaxies (Gunn & Gott 1972; Cowie & Songaila 1977; Giovanelli & Haynes 1985; Chung et al. 2009; Jaff´e et al. 2015) and can strongly affect the fueling of the AGN. Other studies, however, have argued that ram pressure stripping cannot be as effective in transforming blue-sequence galaxies to red (e.g. Larson et al. 1980; Balogh et al. 2000, 2002; Bekki et al. 2002; van den Bosch et al. 2008; Wetzel et al. 2012), especially in galaxy groups where other processes are taking place as well. In addition, possible prevention of accretion of gas from the halo into cluster or group galaxies (“strangulation”; e.g. Larson et al. 1980; Bekki et al. 2002; Tanaka et al. 2004) may, in fact, sup-press AGN activity.
When using only optically selected AGN, the results on the AGN frequency within galaxy clusters remain inconclusive. Early studies reported that AGN are less frequent in galaxy clus-ters than in the field (Osterbrock 1960; Gisler 1978; Dressler, Thompson & Schectman 1985) and more recent studies sup-port this suggestion (Kauffmann et al. 2004; Popesso & Biviano 2006; von der Linden et al. 2010; Pimbblet et al. 2013). Other studies, however, have found no differences between cluster and field galaxies (e.g. Miller et al. 2003).
In contrast to optically selected AGN, radio-loud AGN seem to be more clustered than any other type of galaxy (Hart, Stocke & Hallman 2009) and are often associated with BCGs (brightest cluster galaxies) (e.g. Best 2004; Best et al. 2007). Nevertheless, Best et al. (2005) showed that radio-loud AGN with the strongest optical emission lines avoid the densest regions, a fact that im-plies a certain connection between the environment and the ac-cretion rate onto the SMBH.
Undoubtedly, the best way to detect active galaxies is through X-ray observations (e.g. Brandt & Alexander 2010). During the previous decade, spectroscopic studies of X-ray point-like sources in rich galaxy clusters have concluded that low-X-ray-luminosity AGN (< 3 × 1042erg s−1) are equally present in cluster and field environments (e.g. Martini et al. 2007; Haggard et al. 2010), although most of them presented no optical AGN spectrum (e.g. Martini et al. 2002, 2006; Davis et al. 2003). Nevertheless, luminous AGN were rarely found in clusters (Kauffmann et al. 2004; Popesso & Biviano 2006). More recent studies also reported a significant lack of AGN in rich galaxy clusters by comparing X-ray to optical data. Koulouridis & Plionis (2010) demonstrated the suppression of X-ray-selected AGN in 16 rich Abell clusters (Abell 1958) by comparing the X-ray point source overdensity to the optical galaxy overdensity. Ehlert et al. (2013; 2014) found that the X-ray AGN fraction in the central regions of 42 of the most massive clusters known is about three times lower than the field value us-ing the same technique, while in their most recent study (Ehlert et al. 2015) they argue that galaxy mergers may be an important contributor to the cluster AGN population. More importantly, from the complete spectroscopy of their X-ray point-like source sample, Haines et al. (2012) concluded that X-ray AGN found in massive clusters are an in-falling population and confirm the suppression in the inner regions of rich clusters. On the other hand, Martini et al. (2013) argue that this trend is not confirmed for a sample of high-redshift clusters (1.0 < z < 1.5). Finally, an indirect way to address the issue is by clustering analyses, but
these results also remain inconclusive (see relevant discussion in Haines et al. 2012 §5.2).
The majority of the above studies deal with AGN within massive clusters, while the presence of AGN in less massive or even more massive formations has been very poorly studied. In a scenario in which AGN are suppressed by the strong gravita-tional potential of massive clusters (through gas stripping, stran-gulation, tidal stripping, evaporation, high velocity-dispersion, etc.), one would expect the AGN presence to rise in shallower gravitational potentials (see Arnold et al. 2009; Gavazzi et al. 2011; Bitsakis et al. 2015) and be completely nullified within the deepest ones. In Koulouridis et al. (2014), we investigated the AGN presence in two samples of poor and moderate clusters and found evidence of this anti-correlation. Interestingly, in merging or actively growing clusters the high incidence of galaxy mergers can potentially enhance the number of AGN, while at the same time, shock waves may also enhance the ram pressure stripping intensity (Vijayaraghavan & Ricker 2013; Jaff´e et al. in prep.).
In the current study we investigate the most extreme massive formations in the Universe, superclusters. They typically consist of three to ten clusters spanning as many as 150 h−1Mpc and are without sharply defined boundaries (e.g. Chon et al. 2014, Pearson 2015). The superclusters can vary widely in size, con-taining from a few small groups of the order of 1013−1014
M⊙ (e.g. Einasto et al. 2011; Chon et al. 2014) up to many massive clusters. We note, however, that the mass density, averaged on the supercluster scale, is smaller than in clusters. They are al-ready decoupled from the Hubble flow, but not yet virialised; the time it takes a randomly moving galaxy to traverse the long axis of a supercluster is typically comparable to the age of the universe. They also appear to be interconnected, but the bound-aries between them are poorly defined. At these large scales the dynamical evolution proceeds at a slow rate and superclusters reflect the initial conditions of their formation. Therefore, they are important sites where we can directly witness the evolution of structure formation and mass assembly.
With its depth, uniform coverage, and well-defined selection function, the XXL Survey (The Ultimate XMM-Newton Survey, XXL paper I) is making a unique contribution to the study of distant clusters. In addition, its two 5x5 deg2fields are essential to the study of AGN in the cluster environment. Clusters can be very extended, of the order of a few Mpc, and AGN may prefer-entially reside even further out in their outskirts (e.g. Fassbender et al. 2012; Haines et al. 2012; Koulouridis et al. 2014). More than half of the detected extended sources are 1-3 keV clusters in the 0.2 < z < 0.5 range (Fig. 1), they cover an estimated mass range 1012.8−1014.5
M⊙, and are the subject of our spectroscopic follow-up campaign.
In the first part of the current paper (§2 and §3), we present the preparation, the data reduction, and the results of the William Herschel Telescope (WHT) observations. In the second part (§4) we investigate the AGN frequency within the three superclus-ters. The results for cluster galaxies and the related spectroscopic catalogues will be presented in a subsequent paper. Throughout this paper we use H0 = 70 km s−1 Mpc−1, Ωm = 0.28, and ΩΛ= 0.72.
2. Data description
2.1. The XXL Survey
The XXL Survey is the largest XMM project approved to date (>6 Msec), surveying two ∼ 5x5 deg2fields at a depth of ∼ 5 ×
10−15erg sec−1cm−2in the [0.5-2] keV soft X-ray band1
(com-pleteness limit for the point-like sources). The XXL observa-tions have been completed and processed. To date some 450 new galaxy clusters have been detected out to redshift z ∼ 2 as well as more than 10000 AGN out to z ∼ 4. The main goal of the project is to constrain the Dark Energy equation of state using clusters of galaxies. This survey will also have lasting legacy value for cluster scaling laws and studies of galaxy clusters, AGN, and X-ray background. The northern field (XXL-N), which we use in the current study, is also covered in other wavelengths, e.g. the Canada-France-Hawaii Telescope Legacy Survey (CFHTLS-optical), Spitzer Space Telescope (SST-infrared), the UKIRT Infrared Deep Sky Survey (UKIDSS) and the Galaxy Evolution Explorer (GALEX-Ultraviolet).
2.2. Spectroscopic target and supercluster selection
The three fields observed in this work (see Table 1) were chosen on the basis of the high number of X-ray clusters, containing a total of 25 X-ray groups/clusters in the redshift range that we are targeting, i.e. 0.2 < z < 0.5. In order of priority, we targeted a) all the BCGs, b) cluster galaxy candidates selected on the basis of projected distance to the cluster X-ray position (< 500h−1kpc
and 19 < rS DS S < 21), c) optical counterparts of X-ray
point-like sources (mostly AGN), and finally d) any other galaxy in the targeted redshift range according to their photometric redshift.
Superclusters are defined as concentrations of clusters that trace a second-order clustering hierarchy of galaxies, and they are the largest structures observed. In the current study we iden-tify superclusters as concentrations of at least three clusters at a close redshift separation within 25′radius, given the limited field of view (FoV) of the WHT. Our three observed fields include a total of three superclusters (see Table 2).
Pacaud et al. (submitted, hereafter XXL paper II) base their selection on a different methodology because of the different sample (the 100 brightest clusters, hereafter XXL-100-GC2) and
the different area (the full XXL Survey). According to XXL paper II a supercluster must include a close pair of clusters (D < 8h−1Mpc) and at least a third cluster within 20 h−1Mpc of the pair. The above selection requires all three clusters of the starting triplet to be members of the XXL-100-GC. Then all clusters within 35 h−1 Mpc, independent of brightness, are
considered supercluster members. They finally report five super-clusters, XLSSC-a to -e.
Two of them are in common with the current paper, i.e. Field-1 includes XLSSC-e and Field-2 a part of XLSSC-d. The latter comprises seven X-ray detected clusters in XXL paper II, but the WHT FoV includes only a close bright pair and one more fainter
1 The XXM-Newton observation IDs used in the current study: Field-1: 0677670135, 0677670136, 0677680101, 0677680131, 0677681101 Field-2: 0651170501, 0651170601, 0655343860, 0677650132, 0677650133, 0677650134, 0677660101, 0677660201, 0677660231, 0677660232, 0677660233, 0677670133, 0677670134, 0677670135, 0742430101 Field-3: 0109520201, 0109520301, 0111110101, 0111110201, 0111110701, 0112680101, 0112680401, 0112681001, 0112681301, 0677580131, 0677580132, 0677590131, 0677590132, 0677590133
2 XXL-100-GC data are available in computer read-able form via the XXL Master Catalogue browser http://cosmosdb.iasf-milano.inaf.it/XXL, and via the XMM XXL DataBase http://xmm-lss.in2p3.fr
cluster3. In Field-3 we discover a supercluster that satisfies the
first criterion of XXL paper II of having a close pair of clusters that belong to the XXL-100-GC sample, but the third member is fainter. We name this supercluster XLSSC-f.
In addition to the discovery of the XLSSC-f supercluster, we also publish a new XXL cluster, namely XLSSC 117. We list some basic properties of the new cluster in Table 2.
3. Multifibre optical spectroscopy
3.1. Target preparation
For the preparation of the observations we executed the soft-ware af2-configure, available in the Isaac Newton Group of Telescopes (ING) website4. It is designed to create the mapping
between the objects and the fibres during a particular spectro-graph exposure. It uses an input file with the coordinates (α, δ) of the objects, creates a fibre-to-object mapping using one of two currently available placement algorithms, and then allows the user to edit the fibre locations interactively. In the input file the user should also assign priority to all objects. High prior-ity should be assigned to fiducial stars, since it is essential to allocate approximately eight fiducial fibres, scattered homoge-neously in the field, to accurately align the science fibres. The placement algorithms search for the best combination of posi-tion angle of the spectrograph on the sky and targets in the fibres that maximise the sum of object priorities.
The fibres are positioned by af2-configure within a FoV of 1 degree in diameter, but we manually limited our targets within the central 25 arcmin radius to avoid the effects of vi-gnetting. We tried to maximise the number of fibres allocated on galaxies, but typically also placed 20-30 fibres on the sky for sky subtraction purposes. Within each field our targets were divided into bright (19 < rS DS S <20.5) and faint (20.5 < rS DS S <21)
and we prepared two fibre configurations for the bright sources and one for the faint. We allocated an average of ∼100 sources per configuration, plus sky fibres and fiducial stars.
3.2. Observations
We observed the three fields with the 4.2m WHT during six nights in 2013. More details about the observations are listed in Table 1. We conducted multifibre medium resolution spec-troscopy with the AutoFib2+WYFFOS (AF2) wide-field multi-fibre spectrograph. The AF2 contains 150 science multi-fibres of 1.6 arcsec diameter and 10 fiducial bundles for acquisition and guid-ing. At the prime focus, the fibres are placed onto a field plate by a robot positioner at user-defined sky coordinates (see §3.1). We used the R600B grating with the new default detec-tor Red+4. It is an e2v 231-84 4k×4k, red-sensitive, fringe-suppression CCD with a mosaic of 4096×4112 pixels, 15µm each. We used a 2×2 binning of the CCD pixels and we ob-tained a spectral resolution of ∼4.4 Å. The spectra were centred at wavelength ∼5400 Å, and covered the range 3800 to 7000 Å. The spectra of He and Ne lamps were used for the wavelength calibration.
The bright configurations were observed for 2 or 2.5 hours each (depending on the seeing), and the faint for 3-4 hours each.
3 Because of the slightly higher average redshift of the three clusters of XLSSC-d in the current paper (z=0.298) than of the seven clusters in XXL paper II (z=0.294), the two papers report slightly different redshift (0.30 and 0.29, respectively).
4 http://www.ing.iac.es
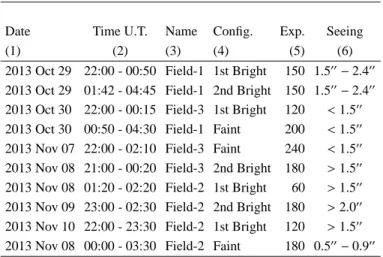
Table 1. WHT observations
Date Time U.T. Name Config. Exp. Seeing
(1) (2) (3) (4) (5) (6)
2013 Oct 29 22:00 - 00:50 Field-1 1st Bright 150 1.5′′−2.4′′
2013 Oct 29 01:42 - 04:45 Field-1 2nd Bright 150 1.5′′−2.4′′
2013 Oct 30 22:00 - 00:15 Field-3 1st Bright 120 <1.5′′
2013 Oct 30 00:50 - 04:30 Field-1 Faint 200 <1.5′′
2013 Nov 07 22:00 - 02:10 Field-3 Faint 240 <1.5′′
2013 Nov 08 21:00 - 00:20 Field-3 2nd Bright 180 >1.5′′
2013 Nov 08 01:20 - 02:20 Field-2 1st Bright 60 >1.5′′
2013 Nov 09 23:00 - 02:30 Field-2 2nd Bright 180 >2.0′′
2013 Nov 10 22:00 - 23:30 Field-2 1st Bright 120 >1.5′′
2013 Nov 08 00:00 - 03:30 Field-2 Faint 180 0.5′′−0.9′′
Notes. (1) Date of observation, (2) starting and ending U.T., (3) name
of the observed WHT field, (4) target selection: “Bright” for targets 19 < mr <20.5 and “Faint” for 20.5 < mr <21, (5) exposure time in
minutes, (6) seeing during the observation.
We were able to observe nine fibre configurations. In total the run yielded ∼900 spectra.
3.3. Data reduction
Data were reduced using the AF2 data reduction pipeline v1.025.
The pipeline is written in IDL and is able to perform data reduc-tion, including fibre-to-fibre sensitivity corrections and optimal extraction of the individual spectra. Below we describe briefly the calibration and extraction modules of the pipeline, but more details can be found in the pipeline manual distributed online by the ING.
The first steps of the pipeline include master bias correction, tracing of the fibres, flat-field correction, masking of bad pixel in the science data, and wavelength calibration. In more detail:
1. BIAS module: At least ten bias files are used each night to debias all raw data images. The average signal level in the overscan regions is used to correct for any change in the bias level over time.
2. MASK module: The module produces a mask file of the CCD pixels where the dark current exceeds a user-specified level. It also displays a plot of the fraction of masked pixels versus the cut-off level and an image of the produced file.
3. FLAT module: At least ten twilight sky or internal flats were used to perform the flat-field correction each night. Individual flats are scaled according to their mean value be-fore calculating their total median value.
4. CIRC module: This module uses a flat file to trace the x-pixel position of the centre of the spectral line of each active fibre as a function of y-pixel. In the pipeline version used for the reduction in the current paper, the module crashed if the low-signal area of the CCD (the blue part of the spectrum) was not trimmed. The new version of the pipeline, however, does not present this problem and the user can analyse the CCD in its full length.
5. ARC & ATLAS module: The module extracts the lamp spec-trum as a function of y-pixel position and uses this
intermedi-5 a newer version of the pipeline (v3.0) can be downloaded from http://www.ing.iac.es/astronomy/instruments/af2/reduction.html
ate spectrum to determine the wavelength calibration. In our case two arc files are used to reference lines simultaneously, one from the helium lamp for the blue part of the spectrum, and one from the neon lamp for the red part of the spectrum. The ARC module identifies the approximate y-pixel location and exact wavelengths for a set of well-separated unsaturated lines in the arc spectra and finds the precise position of the peaks by fitting Gaussian profiles to each one. It uses a pre-defined table of emission line data, but in combination with the ATLAS module the selection and confirmation of the lamp lines is performed interactively.
The extraction of the spectrum by the pipeline is done in two additional steps:
1. STAR module: The module first extracts the science spec-tra of designated targets and sky-allocated fibres and then processes the intermediate spectra to produce sky subtracted output spectra on a common wavelength base. The median sky spectrum is calculated within the STAR module. There are four different options for the calculation, but in our case we selected the one where the median sky is scaled and the output spectrum is masked over sky lines.
2. MEDAN module: This module evaluates the median spectra for each fibre by combining all available science exposures. Spectra are normalised to their mean value before the median is calculated.
Finally, the flux calibration, which is not included in the pipeline, is performed with IRAF using STANDARD, SENSFUNC, and CALIBRATE tasks. Given the wide magnitude range covered, the spectra have a wide range of S/N.
3.3.1. Galaxy redshifts
Redshifts were obtained from visual inspection of all spectra by two of the authors (BP and CA), using the IRAF package RVSAO independently and iterating on doubtful cases.
The overall success rate (number of redshifts/number of spectra) was 60%, ranging from 84% for the best seeing con-figurations to the lowest 30% for the worst ones.
The probability that each redshift was correct was estimated on the basis of the number and quality of spectral features (lines in emission or absorption, D4000) identified in the spectrum. If a large number of lines were identified without wavelength off-sets the probability was set to 99%. As the number of identified spectral features decreased, the assigned probability decreased; 75% percent redshifts had at least two or three secure lines.
In total we obtained 455 good-quality redshifts (of which 172/147/110 have a 75%/95%/99% chance of being correct, and 26 are based on a single emission line but with very reliable iden-tification). Ninety other redshifts were more uncertain and were not used for any of our purposes, but were recorded for future reference. We note that our target sample was not contaminated by stars.
In more detail we obtained:
1. 9 BCG (brightest cluster galaxy) redshifts. These provide us with nine new cluster redshifts around z=0.3-0.5. More importantly these redshifts are too high to be obtained by GAMA spectroscopy (Driver et al. 2011; Liske et al. 2015), which covers the XXL Survey, but is much shallower. 2. 82 and 160 cluster galaxy candidates that lie within 0.5 and
1 h−1 Mpc of the cluster centres, respectively. We will use
0.2 0.3 0.4 0.5
0.2 0.3 0.4 0.5
Fig. 1. Comparison of the galaxy spectroscopic redshifts ob-tained during the two runs with the William Herschel Telescope with the CFHTLS photometric redshifts.
these galaxies for a more precise determination of the cluster redshifts and for the study of the cluster properties.
In addition, we obtained the redshifts of another 148 galaxies that lie more than 1 h−1Mpc from the closest extended X-ray
source.
3. 56 AGN redshifts that are used in the second part of the cur-rent paper, in combination with spectroscopic results from other surveys.
In Fig.1 we compare our spectroscopic redshifts with the CFHTLS photometric redshifts (Ilbert et al. 2006 and Coupon et al. 2009). WHT spectroscopy is clearly useful in the redshift range of interest (0.2 < z < 0.5).
4. AGN in superclusters
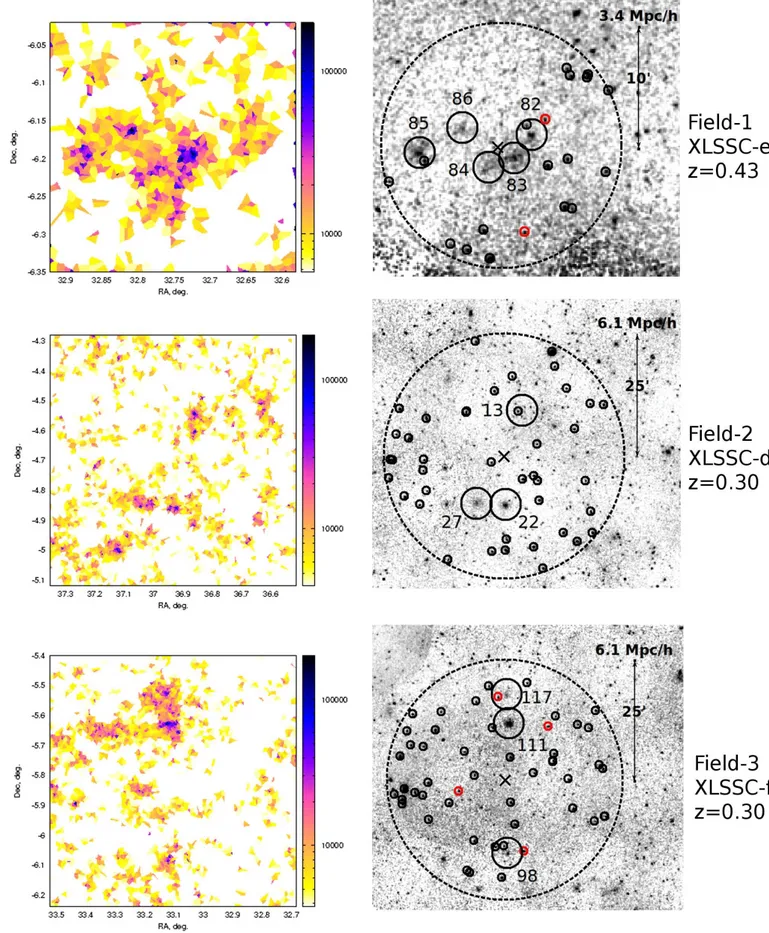
In the following sections we present a study of the AGN fre-quency in the three observed supercusters. The supercluster in Field-1 (XLSSC-e) is very different from the ones found in the other two fields, i.e. all five clusters found at z∼0.43 are located within a circle of 4′ radius (1.3 h−1 Mpc) and a sixth but
un-certain member within 10′. A more detailed analysis of the su-percluster and its BCGs is presented in Pompei et al. (submit-ted, hereafter XXL paper VII). Baran et al. (submit(submit-ted, hereafter XXL paper IX) identified several overdensities via a Voronoi Tessellation analysis of optically detected galaxies and presented new radio observations. Therefore, we consider the supercluster in Field-1 to be a merging supercluster in a tight configuration.
On the contrary, in the FoV of the WHT (6.5 h−1Mpc ra-dius at z = 0.3), the other two structures include only three members each in a much looser configuration, although both in-clude a very close cluster pair (< 1 h−1Mpc). Therefore, the
su-perclusters in Field-2 (XLSSC-d) and Field-3 (XLSSC-f) seem very similar (see Fig. 2). However, further investigation outside the WHT FoV reveals that these two superclusters are intrin-sically different, i.e. the structure found in Field-2 is only part of a larger formation comprising seven X-ray detected clusters within 35 h−1Mpc (XXL paper II), while the three clusters found
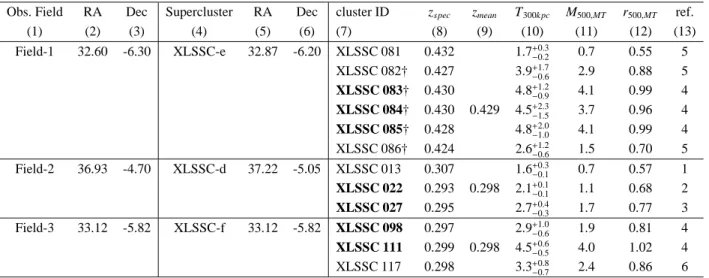
Table 2. Superclusters
Obs. Field RA Dec Supercluster RA Dec cluster ID zspec zmean T300k pc M500,MT r500,MT ref.
(1) (2) (3) (4) (5) (6) (7) (8) (9) (10) (11) (12) (13) Field-1 32.60 -6.30 XLSSC-e 32.87 -6.20 XLSSC 081 0.432 1.7+0.3 −0.2 0.7 0.55 5 XLSSC 082† 0.427 3.9+1.7 −0.6 2.9 0.88 5 XLSSC 083† 0.430 4.8+1.2 −0.9 4.1 0.99 4 XLSSC 084† 0.430 0.429 4.5+2.3 −1.5 3.7 0.96 4 XLSSC 085† 0.428 4.8+2.0 −1.0 4.1 0.99 4 XLSSC 086† 0.424 2.6+1.2 −0.6 1.5 0.70 5 Field-2 36.93 -4.70 XLSSC-d 37.22 -5.05 XLSSC 013 0.307 1.6+0.3 −0.1 0.7 0.57 1 XLSSC 022 0.293 0.298 2.1+0.1 −0.1 1.1 0.68 2 XLSSC 027 0.295 2.7+0.4 −0.3 1.7 0.77 3 Field-3 33.12 -5.82 XLSSC-f 33.12 -5.82 XLSSC 098 0.297 2.9+1.0 −0.6 1.9 0.81 4 XLSSC 111 0.299 0.298 4.5+0.6 −0.5 4.0 1.02 4 XLSSC 117 0.298 3.3+0.8 −0.7 2.4 0.86 6
Notes. (1) Observed field name, (2)-(3) field coordinates in the J2000 system, (4) supercluster name, (5)-(6), supercluster coordinates in the J2000
system, as published in XXL paper II for XLSSC-d and -e, (7) original cluster name in the XXL database, members of the XXL-100-GC sample in bold, (8) spectroscopic redshift, (9) mean supercluster redshift, (10) X-ray temperature in keV within an aperture of 300 kpc measured in Giles at al. (submitted, XXL paper III) for the members of the XXL-100-GC sample, (11) cluster mass in 1014M⊙, calculated from the M
500,MT−T300k pc scaling relation of Lieu et al. (submitted, hereafter XXL paper IV), (12) overdensity radius with respect to the critical density in Mpc, calculated from the M500,MT−T300k pcscaling relation of XXL paper IV, (13) reference to the first X-ray detection as a cluster.
References. (1) Willis et al. (2005); (2) Pierre et al. (2006); (3) Pacaud et al. (2007); (4) XXL paper II; (5) XXL paper VII; (6) this work.
†The spectroscopic redshift of the cluster was initially determined by the observations presented in the current paper.
in Field-3 are not related to any significant overdensity in the re-gion. Nevertheless, the total mass of the latter is larger by a factor of 2.5.
Because of the above differences and its higher redshift, we studied AGN in XLSSC-e within a 10′ radius around its five confirmed clusters, while for the other two superclusters we used the full 25′FoV of the WHT. In general, superclusters are not virialised and there is no explicit definition of their centre. For XLSSC-e we chose a position approximately in the middle of the formation to be the centre, while for XLSSC-d and -f we used the centre of the WHT FoV. From the X-ray images in Fig. 2 (right panels) it is apparent that the above choices are reasonable.
4.1. Methodology
We assessed the enhancement or the suppression of AGN pres-ence within the three superclusters by analysing both the 3D (spatial) and the 2D (projected) overdensity of X-ray point sources. We chose to analyse the 2D case as well since we lacked complete spectroscopy for all the X-ray point sources. However, we had to take into account that the 2D case is hampered by a va-riety of systematic effects, related for example to flux-boosting due to lensing (see discussion in Koulouridis et al. 2014). For the statistical evaluation of our results we used the confidence limits for small numbers of events in astrophysical data, based on Poisson statistics (Gehrels 1986).
To assess the 2D and 3D overdensity of AGN in the three su-perclusters we adopted a common lower luminosity limit for the X-ray point-like sources. We find that for the two superclusters at z = 0.3 a luminosity limit of L(0.5−2 keV) = 2.7 × 1042erg s−1,
which corresponds to f(0.5−2 keV)∼1.0×10⁻¹⁴erg s−1cm−2,
com-bines both the inclusion of low-luminosity AGN and a relatively high completeness of spectroscopic redshifts. For the superclus-ter XLSSC-e at z = 0.43, this luminosity limit corresponds to a flux limit of f(0.5−2 keV) = 4.5 × 10⁻¹⁵erg s−1cm−2. We will show
the importance of having a common luminosity rather than a flux limit for fields at different redshifts.
4.1.1. Projected overdensity of X-ray point-like sources
In a given area, the projected overdensity of X-ray AGN is esti-mated according to
δx=
Nx
Nexp
−1, (1)
where Nx is the number of X-ray point-like sources detected
in the area and Nexp is the expected number according to the
log N − log S of the XXL northern field (Elyiv et al. in prep) within the same area. We note that the soft-band log N − log S used in the current study is lower than those of the 2XMM (Ebrero et al. 2009) and COSMOS (Cappelluti et al. 2009) sur-veys (with deviations not exceeding the 2−3σ Poisson level), but in excellent agreement with those of the XMM Medium Deep Survey (XMDS, Chiappetti et al. 2005).
To calculate the value of Nx, we identified all point-like
sources located within five radial annuli between n and (n + 1)r around the centre of each field, where n =0,1,2,..5, r = 2′for XLSSC-e (higher redshift and more compact) and r = 5′ for XLSSC-d and XLSSC-f. The large contiguous area of the XXL Survey allowed us to expand our search for X-ray AGN at large radii.
To calculate the expected number Nexp of X-ray sources in
the field, we followed the procedure described below, consider-ing each time the same area of the detector and the same charac-teristics of the actual observation:
1. From the log N − log S we derived the total number (Nf) of
expected sources in the area per flux bin.
2. We considered 1000 × Nfsources with random fluxes within
the flux range of each bin and random positions within the area of interest.
3. We derived the probability Pithat the source Nf iis actually
detected in the specific area of the detector. The probability is a function of the off-axis position (vignetting), background, and exposure time (Elyiv et al. 2012).
4. We calculated the sum Pnbinj=n P1000Nf
i=1 Nf i×Pi/1000, which
gives the total number, Nexp, of expected X-ray sources that
have fluxes above the respective value of the nth bin of the
log N − log S , where the total number of bins, nbin, is 160.
4.1.2. Spatial overdensity of X-ray point-like sources
Most optical counterparts of relatively bright X-ray sources
( f(0.5−2 keV)>1.0 × 10⁻¹⁴erg s−1cm−2) in our three superclusters
have spectroscopic redshifts. In more detail, in XLSSC-e five out of six sources have spectroscopy within a 10′radius of the cen-tre of the supercluster. Similarly, within the 25′of XLSSC-d and -f we find 38 out of 41, and 38 out of 51, respectively. On the contrary, only 4 out of the 13 sources below this flux have spec-troscopy in XLSSC-e (we note that in XLSSC-e the flux limit is
f(0.5−2 keV) = 4.5 × 10⁻¹⁵erg s−1cm−2, see §4.1).
The results of the current analysis are based mainly on spec-troscopic data, although the photometric redshifts of all sources were available. The optical counterparts of the sources with no available spectra are either too faint or totally absent and are therefore improbable supercluster members. In fact, studying their redshift probability distributions (PDZ), only one source in Field-3 is possibly at the redshift of the supercluster. Photometric redshifts were calculated for all our sources with suitable AGN and quasar templates (Fotopoulou et al. in prep).
In the case of the non-virialised superclusters the boundaries and the geometry cannot be easily defined and the clusters that form the superclusters have a spread in redshift space. Therefore, we initially based our selection of supercluster members on the condition δz = |zspec−zmean|<2000(1 + zcl) km/s, where zspec
is the galaxy redshift and zmean is the mean redshift of the
su-percluster members, which is a good approximation of more so-phisticated cluster membership selection algorithms (e.g. Old et al. 2014 and references therein). Then, we extended the search for AGN to 1.5 × δz and 2 × δz.
The expected spatial X-ray point-like density is calculated from the luminosity function of Hasinger, Miyaji & Schmidt (2005). To this end we first calculated the volume that is de-fined by the limits described in the previous paragraph. This is actually a cylinder of volume V given by V = πR2×h, where R
is the projected radius and h is the height of the cylinder that cor-responds to the distance between the lower and upper redshift6.
Then, we integrated the luminosity function within the luminos-ity range of interest to calculate the expected number of sources per Mpc3. Finally, by multiplying the two values we found the
expected number of sources in the area of the superclusters. In all cases the expected number of X-ray point-like sources was less than one.
The results of the projected and the spatial X-ray overdensity analysis are summarised in Table 3.
4.1.3. Optical galaxy spatial overdensity
Any excess of X-ray point-like sources in the area of galaxy clus-ters can be due to the obvious abundance of galaxies with respect to the field (see Koulouridis & Plionis 2010). Therefore, to reach
6 The height h used in the above calculations is based on the selected
δz and is larger than R so that the effect of galaxy peculiar velocities on
the observed redshift distance between two sources is included.
Table 3. 2D and 3D analysis
2D 3D Name R N ±δz ±1.5 × δz ±2 × δz (1) (2) (3) (4) (5) (6) XLSSC-e 10 19 (22) 2 (< 1) 2 (< 1) 2 (< 1) XLSSC-d 25 41 (41) 0 (< 1) 0 (< 1) 0 (< 1) XLSSC-f 25 51 (42) 2 (< 1) 3 (< 1) 4 (< 1)
Notes. (1) Supercluster name; (2) projected search radius in arcmin;
(3) number of detected X-ray point-like sources (in parentheses the
ex-pected number of sources calculated by the logN-logS); (4)-(6) number of AGN found within 1×,1.5×, and 2 × δz of the supercluster redshift
zs, where δz = ±2000(1+zs) km/s (in parentheses the expected number
of sources in the respective area calculated by the luminosity function).
a meaningful interpretation of the X-ray point source overden-sity analysis, and to reach a conclusion on the enhancement or suppression of AGN, we needed first to study the optical galaxy overdensity profile in the three fields. To this end, we used the photometric redshifts of the CFHTLS-T0007 W1 field (Ilbert et al. 2006 and Coupon et al. 2009) computed from three to five optical bands. The accuracy is 0.031 at i < 21.5 and reaches σδz/(1+zsp) ∼ 0.066 at 22.5 < i < 23.5. The fraction of outliers
increases from ∼ 2% at i < 21.5 to ∼10 - 16% at 22.5 < i < 23.5. The relevant expression of the optical galaxy overdensity is similar to that of the X-ray overdensity in Eq. (1), i.e.
δo=
No
No,exp
−1 , (2)
where Nois the number of optical sources found in the area and
No,exp the expected background number within the same area.
For the calculation of the galaxy density, we considered the re-gions previously defined for the X-ray analysis. The expected galaxy density was calculated from a 2 deg2 field within the
XMM-LSS area, free from clusters in the redshift range of the superclusters.
4.2. Results
From the 2D analysis of the 10′ of XLSSC-e we expect ∼22 point-like sources above the lower flux limit, f(0.5−2 keV) = 4.5 ×
10−15 erg s−1 cm−2, and we actually find 19. These numbers
are consistent within the 1σ confidence level (Gehrels 1986). In XLSSC-d and -e, ∼41 and ∼42 X-ray point-like sources are expected above f(0.5−2 keV) = 1 × 10⁻¹⁴ erg s−1 cm−2,
respec-tively. Indeed, 41 X-ray point-like sources are found in XLSSC-d. Nevertheless, in XLSSC-f we discover 51 and therefore a sig-nificant X-ray overdensity is found in the area, not consistent with the expected value at the 1σ confidence level.
Considering the available photometric and spectroscopic data (3D analysis within ±2 × δz, see Table 3) we find in total six AGN with compatible spectroscopic redshifts in the area of the three superclusters (for the individual analysis see the next three paragraphs). The corresponding expected number of AGN calcu-lated from the luminosity function (Hasinger, Miyaji & Schmidt 2005) is ∼1.5 (∼0.5 AGN per field) and therefore we calculate a total spatial AGN overdensity, δx = 3. As we have already
pointed out, before reaching any definite conclusion we also had to consider the high density of optical galaxies in the area of superclusters. Therefore, we also assessed the total spatial over-density of optical galaxies in the three fields, δo = 0.42. We
Fig. 2. Voronoi tessellations (VT) and X-ray images of the three superclusters (XLSSC-e: top, XLSSC-d: middle, XLSSC-f: bottom). Left panels: Voronoi tessellation using CFHTLS photometric redshift data. All galaxies within δz = ±0.05 of the supercluster redshift are included. The side bar illustrates the colour-coding of the galaxy density. Only areas above the average number-density are coloured in the plots. Right panels: the corresponding X-ray maps overplotted with the positions of the studied areas (dashed circles) and of the X-ray detected clusters (large black circles with XLSSC ID numbers). The small black circles denote X-ray point-like sources above the luminosity limit (L(0.5−2 keV) > 2.7 × 1042 erg s−1), while the red circles denote the ones with
spectroscopic redshift consistent with the supercluster (within 2 × δz, see §4.1.2). The supercluster centres are marked with an X. The scale of the VT plots and their corresponding X-ray images is the same. The X-ray clusters can be easily identified in the high-density areas of the Voronoi plots. In the VT plots of XLSSC-d and XLSSC-f at least one more non-X-ray-detected overhigh-density can
Table 4. AGN in superclusters
Name RA DEC z L(0.5−2 keV)
(1) (2) (3) (4) (5) 3XLSS J021046.2-060854 32.6928 -6.1485 0.428 4.15×1042 3XLSS J021053.0-061809 32.7211 -6.3026 0.423 3.66×1042 3XLSS J021309.2-055142 33.2886 -5.8618 0.298 6.03×1042 3XLSS J021153.5-053810† 32.9729 -5.6363 0.288 3.58×1042 3XLSS J021213.7-060408† 33.0571 -6.0690 0.283 6.21×1042 3XLSS J021235.9-053210 33.1499 -5.5364 0.299 6.70×1042
Notes. (1) X-ray source name; (2), (3) field coordinates in the J2000
system; (4) redshift; (5) Soft X-ray luminosity in units of erg s−1.
† Included in the 1000 brightest XXL X-ray point source catalog (Fotopoulou et al. submitted, XXL paper VI)
of AGN with respect to the corresponding overdensity of optical galaxies at the 95% confidence level (Gehrels 1986). This could indicate extra triggering of AGN caused by the environment. We note that the above result is not affected by the selection of a dif-ferent redshift range (±δz or ±1.5 × δz, see Table 3); although we detect fewer AGN, we also consider a much smaller volume.
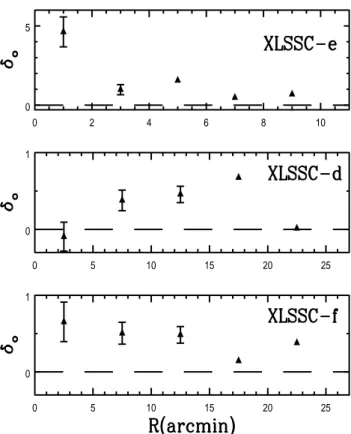
Next, we proceed with the 3D analysis of each supercluster individually. We find two AGN at the redshift of the XLSSC-e (Field-1) within 10′radius (Fig. 2, top). Both are low-luminosity AGN with L(0.5−2 keV) ∼4×1042erg s−1. The detailed overdensity
of optical galaxies, divided into five annuli in each field, is plot-ted in Fig. 3. It is apparent that in the area of XLSSC-e the bulk of the galaxies are concentrated in the central 4′, while in the last annulus the galaxy density reaches the field level. The AGN overdensity in the whole field is significantly higher than the op-tical galaxy overdensity at the 90% confidence level despite the small number statistics (Gehrels 1986). We also note that for the XLSSC-e, radio observations were obtained in XXL paper IX, but no large radio galaxies were found within the overdensities. They only associated eight radio sources with potential super-cluster member galaxies; however, they are not associated with any of our X-ray point-like sources.
Similarly, in XLSSC-f (Field-3) we find two to four spec-troscopically confirmed AGN compatible with the supercluster redshift (depending on the redshift range, see §4.1.2 and Table 3) and another possible member with compatible photometric redshift (Fig. 2, bottom). The optical galaxy overdensity pro-file (Fig. 3) is almost flat over the whole field. This is probably due to cluster XLSSC 111, which is very massive with a large
r500,MT radius and affects the full field. The X-ray overdensity
is significantly higher than the optical overdensity at the 99% confidence level. Similar to the two AGN found in XLSSC-e, the four AGN found in XLSSC-f are low-luminosity sources
(L(0.5−2 keV) < 7 × 1042erg s−1). The list of AGN can be found
in Table 4.
In contrast, no AGN is found within a 25′radius in XLSSC-d (Fig. 2, middle). In this field the large number of optical galax-ies are located in annuli 2 to 4 (Fig. 3), as expected from the location of the three clusters, while in the first and last annuli the density reaches the expected field value. The overdensity of AGN in Field-2 is δx= −1, but the null hypothesis that it is
con-sistent with the optical galaxy overdensity cannot be rejected at any statistically significant level.
We note that a low-luminosity source is actually detectable in a smaller fraction of XLSSC-e compared to the other two su-perclusters because of their different redshift (∼15% smaller ef-fective area for a source with f(0.5−2 keV) ∼ 5 × 10⁻¹⁵ erg s−1
0 5 10 15 20 25 0 1 0 5 10 15 20 25 0 1 0 2 4 6 8 10 0 5
Fig. 3. Spatial overdensity profile of optical galaxies within an-nuli of 2′ (XLSSC-e) and 5′ (XLSSC-d, XLSSC-f) centred at the geometrical centre of the superclusters. For the calculation of the overdensity, CFHTLS photometric redshifts of galaxies were used. The error-bars are 1σ Poissonian uncertainties and are shown only for the first two or three annuli of each field. For the others the errors are smaller than the height of the symbols.
cm−2). In addition, the spectroscopic completeness in XLSSC-e
is less than 50%, while in XLSSC-d and -f it is 93% and 75%, respectively. Therefore, there is some probability that we have missed supercluster members in XLSSC-e, although, as we have already discussed, the photometric redshift PDZs and the images of the optical counterparts render this probability small. Only in XLSSC-f is the probability of one extra AGN high, but in this supercluster the X-ray overdensity is already high without in-cluding the non-spectroscopic sources.
The results imply some intrinsic differences between the su-perclusters. XLSSC-e includes five merging clusters in tight con-figuration, while the three clusters of XLSSC-f are not part of any further significant overdensity. Nevertheless, their total mass is a factor of 2.5 larger than that of the three clusters of XLSSC-d. On the other hand, although the three clusters of XLSSC-d form the less massive structure, they are part of a larger over-density that includes at least another four clusters that we have not probed with the current observations. Therefore, we cannot conclude in the current paper on the reasons that produce the observed differences because of the small number of superclus-ters studied. We will extend our study to the full XXL Survey in order to understand these differences better and to quantify any trend regarding the AGN frequency in the environment of superclusters.
5. Conclusions
In the first part of the current paper we presented the multifi-bre spectroscopic observations in three 0.55 deg2 fields in the XXL-N survey with the 4.2m WHT. Our targets were candidate member galaxies of clusters and optical counterparts of X-ray point-like sources. We obtained spectra for 455 galaxies, 56 of which are AGN. We determined the redshift of 25 clusters, 6 of which belong to the merging supercluster XLSSC-e at z ∼ 0.43, and confirmed 2 more superclusters in looser configurations at z ∼ 0.3.
In the second part, we investigated the AGN frequency in the environment of the superclusters. To this end, we identified all possible AGN supercluster members, which we define as sources with L(0.5−2 keV) > 2.7 × 1042 erg s−1, and compared their
pro-jected and spatial overdensity with the expected overdensity of optical galaxies in the region. In more detail:
– XLSSC-d: The supercluster presents no significant 2D over-density of X-ray point-like sources and the total lack of AGN found by the 3D analysis is statistically consistent with the expected number of AGN within the area.
– XLSSC-f: In sharp contrast to XLSSC-d, a high projected overdensity of X-ray point-like sources was found by the 2D analysis. This result was confirmed by the 3D analy-sis, where the high number of spectroscopically confirmed AGN significantly exceeded the optical galaxy density ex-pectations.
– XLSSC-e: Similarly to XLSSC-f, we find a relatively high number of spectroscopically confirmed AGN that again ex-ceed the optical galaxy density expectations. The statistical significance of this result is not as high as for XLSSC-f and it is not supported by the 2D analysis. However, the proba-bility that we have missed some AGN in this field is higher than in the other two fields.
Overall, the number of AGN in the area of the three superclus-ters significantly exceeds the field expectations at the 95% con-fidence level.
All six AGN found in the area of the superclusters have X-ray luminosities below 7×1042erg s−1and we can argue that they
are luminosity sources. Similarly, a high number of low-luminosity AGN was reported in studies of AGN in rich clusters (e.g. Martini et al. 2002, 2006; Davis et al. 2003), but not above the field expectations (e.g. Martini et al. 2007; Haggard et al. 2010). In addition to our own data, optical spectroscopy by the SDSS-BOSS project (Dawson et al. 2013) also exists for these sources. Except for 3XLSS J021235.9-053210, none of the AGN spectra presents broad permitted emission lines. A more thor-ough investigation of the AGN population in superclusters will be presented in a future paper.
The reason for the difference between the AGN frequency in the three superclusters cannot be completely understood by the present study because of the small sample. To better understand the relation between AGN and the environment of superclusters, we will need to apply the same analysis to a larger number of massive formations. The wide area of the XXL Survey will soon give us the opportunity to realise this kind of study.
Acknowledgements. We would like to thank the anonymous referee for the use-ful comments and suggestions. XXL is an international project based around an XMM Very Large Programme surveying two 25 deg2extragalactic fields at a depth of 5×10⁻¹⁵erg s−1cm−2in [0.5-2] keV at the 90% completeness level (see XXL paper I). The XXL website is http://irfu.cea.fr/xxl. Multiband information and spectroscopic follow-up of the X-ray sources are obtained through a number of survey programmes, summarised at http://xxlmultiwave.pbworks.com/. The
authors acknowledge L. Chiappetti for producing a format and catalog com-pliance report. EK acknowledges fellowship funding provided by the Greek General Secretariat of Research and Technology in the framework of the pro-gramme Support of Postdoctoral Researchers, PE-1145. EK acknowledges the Centre National dEtudes Spatiales (CNES) and CNRS for support of post-doctoral research. YJ acknowledges support by FONDECYT grant N. 3130476. O.M. is grateful for the financial support provided by the NEWFELPRO fellow-ship project in Croatia. FP acknowledges support from the BMBF/DLR grant 50 OR 1117, the DFG grant RE 1462-6 and the DFG Transregio Programme TR33. This work is based on observations obtained with MegaPrime/MegaCam, a joint project of CFHT and CEA/IRFU, at the Canada-France-Hawaii Telescope (CFHT) which is operated by the National Research Council (NRC) of Canada, the Institut National des Sciences de l’Univers of the Centre National de la Recherche Scientifique (CNRS) of France, and the University of Hawaii. This work is based in part on data products produced at Terapix available at the Canadian Astronomy Data Centre as part of the Canada-France-Hawaii Telescope Legacy Survey, a collaborative project of NRC and CNRS.
References
Abell, G. O. 1958, ApJS, 3, 211
Arnold, T. J., Martini, P., Mulchaey, J. S., Berti, A., & Jeltema, T. E. 2009, ApJ, 707, 1691
Balogh, M. L., Navarro, J. F., & Morris, S. L. 2000, ApJ, 540, 113 Balogh, M., Bower, R. G., Smail, I., et al. 2002, MNRAS, 337, 256 Bekki, K., Couch, W. J., & Shioya, Y. 2002, ApJ, 577, 651 Best, P. N. 2004, MNRAS, 351, 70
Best, P. N., Kauffmann, G., Heckman, T. M., et al. 2005, MNRAS, 362, 25 Best, P. N., von der Linden, A., Kauffmann, G., Heckman, T. M., & Kaiser, C. R.
2007, MNRAS, 379, 894
Bitsakis, T., Dultzin, D., Ciesla, L., et al. 2015, MNRAS, 450, 3114 Bleem, L. E., Stalder, B., Brodwin, M., et al. 2015, ApJS, 216, 20
Brandt, W. N., & Alexander, D. M. 2010, Proceedings of the National Academy of Science, 107, 7184
Calvi, R., Poggianti, B. M., & Vulcani, B. 2011, MNRAS, 416, 727 Cappelluti, N., Cappi, M., Dadina, M., et al. 2005, A&A, 430, 39 Cappelluti, N., Brusa, M., Hasinger, G., et al. 2009, A&A, 497, 635 Cappi, M., et al. 2001, ApJ, 548, 624
Chiappetti, L., Tajer, M., Trinchieri, G., et al. 2005, A&A, 439, 413
Chon, G., B¨ohringer, H., Collins, C. A., & Krause, M. 2014, A&A, 567, A144 Chung, A., van Gorkom, J. H., Kenney, J. D. P, Crowl, H., & Volmer, B. 2009,
AJ, 138, 1741
Coupon, J., Ilbert, O., Kilbinger, M., et al. 2009, A&A, 500, 981 Cowie, L. L., & Songaila, A. 1977, Nature, 266, 501
D’Elia, V., Fiore, F., Elvis, M., Cappi, M., Mathur, S., Mazzotta, P., Falco, E., & Cocchia, F. 2004, A&A, 422, 11
Davis, D. S., Miller, N. A., & Mushotzky, R. F. 2003, ApJ, 597, 202 Dawson, K. S., Schlegel, D. J., Ahn, C. P., et al. 2013, AJ, 145, 10 Dressler, A., Thompson, I. B., & Shectman, S. A. 1985, ApJ, 288, 481 Driver, S. P., Hill, D. T., Kelvin, L. S., et al. 2011, MNRAS, 413, 971
Ebrero, J., Mateos, S., Stewart, G. C., Carrera, F. J., & Watson, M. G. 2009, A&A, 500, 749
Ehlert, S., Allen, S. W., Brandt, W. N., et al. 2013, MNRAS, 428, 3509 Ehlert, S., von der Linden, A., Allen, S. W., et al. 2014, MNRAS, 437, 1942 Ehlert, S., Allen, S. W., Brandt, W. N., et al. 2015, MNRAS, 446, 2709 Einasto, M., Liivam¨agi, L. J., Tago, E., et al. 2011, A&A, 532, A5 Einasto, M., Tago, E., Lietzen, H., et al. 2014, A&A, 568, A46 Eke, V. R., Frenk, C. S., Baugh, C. M., et al. 2004, MNRAS, 355, 769 Ellison, S. L., Patton, D. R., Mendel, J. T., & Scudder, J. M. 2011, MNRAS, 418,
2043
Elyiv, A., Clerc, N., Plionis, M., et al. 2012, A&A, 537, A131
Fassbender, R., ˇSuhada, R., & Nastasi, A. 2012, Advances in Astronomy, 2012 Gavazzi, G., Savorgnan, G., & Fumagalli, M. 2011, A&A, 534, A31
Gehrels, N. 1986, ApJ, 303, 336
Gilmour, R., Best, P., & Almaini, O. 2009, MNRAS, 392, 1509 Giovanelli, R., & Haynes, M. P. 1985, ApJ, 292, 404
Gisler, G. R. 1978, MNRAS, 183, 633
Gladders, M. D., & Yee, H. K. C. 2000, AJ, 120, 2148 Gunn, J. E., & Gott, J. R., III 1972, ApJ, 176, 1
Haggard, D., Green, P. J., Anderson, S. F., et al. 2010, ApJ, 723, 1447 Haines, C. P., Pereira, M. J., Sanderson, A. J. R., et al. 2012, ApJ, 754, 97 Hao, J., McKay, T. A., Koester, B. P., et al. 2010, ApJS, 191, 254 Hart, Q. N., Stocke, J. T., & Hallman, E. J. 2009, ApJ, 705, 854 Hasinger, G., Miyaji, T., & Schmidt, M. 2005, A&A, 441, 417 Hopkins, P. F., & Quataert, E. 2011, MNRAS, 415, 1027
Ilbert, O., Arnouts, S., McCracken, H. J., et al. 2006, A&A, 457, 841 Iovino, A., Cucciati, O., Scodeggio, M., et al. 2010, A&A, 509, A40
Jaff´e, Y. L., Smith, R., Candlish, G. N., et al. 2015, MNRAS, 448,1715 Jeltema, T. E., Mulchaey, J. S., Lubin, L. M., & Fassnacht, C. D. 2007, ApJ, 658,
865
Johnson, O., Best, P. N., & Almaini, O. 2003, MNRAS, 343, 924
Kauffmann, G., White, S. D. M., Heckman, T. M., et al. 2004, MNRAS, 353, 713
Kawakatu, N., Anabuki, N., Nagao, T., Umemura, M., & Nakagawa, T. 2006, ApJ, 637, 104
Koester, B. P., McKay, T. A., Annis, J., et al. 2007, ApJ, 660, 221 Koulouridis, E., Plionis, M., Chavushyan, V., et al. 2006, ApJ, 639, 37 Koulouridis, E., Chavushyan, V., Plionis, M., Krongold, Y., & Dultzin-Hacyan,
D. 2006, ApJ, 651, 93
Koulouridis, E., & Plionis, M. 2010, ApJ, 714, L181
Koulouridis, E., Plionis, M., Chavushyan, V., et al. 2013, A&A, 552, A135 Koulouridis, E., Plionis, M., Melnyk, O., et al. 2014, A&A, 567, A83 Koulouridis, E. 2014, A&A, 570, A72
Larson, R. B., Tinsley, B. M., & Caldwell, C. N. 1980, ApJ, 237, 692 Liske, J., Baldry, I. K., Driver, S. P., et al. 2015, MNRAS, 452, 2087
Martini, P., Kelson, D. D., Mulchaey, J. S., & Trager, S. C. 2002, ApJ, 576, L109 Martini, P., Kelson, D. D., Kim, E., Mulchaey, J. S., & Athey, A. A. 2006, ApJ,
644, 116
Martini, P., Mulchaey, J. S., & Kelson, D. D. 2007, ApJ, 664, 761 Martini, P., Miller, E. D., Brodwin, M., et al. 2013, ApJ, 768, 1 Melnyk, O., Plionis, M., Elyiv, A., et al. 2013, A&A, 557, A81
Miller, C. J., Nichol, R. C., G ´omez, P. L., Hopkins, A. M., & Bernardi, M. 2003, ApJ, 597, 142
Molnar, S. M., Hughes, J. P., Donahue, M., & Joy, M. 2002, ApJ, 573, L91 Old, L., Skibba, R. A., Pearce, F. R., et al. 2014, MNRAS, 441, 1513 Osterbrock, D. E. 1960, ApJ, 132, 325
Pacaud, F., Pierre, M., Adami, C., et al. 2007, MNRAS, 382, 1289 Pearson, D. W. 2015, MNRAS, 449, 3212
Pierre, M., Valtchanov, I., Altieri, B., et al. 2004, J. Cosmology Astropart. Phys., 9, 011
Pierre, M., Pacaud, F., Duc, P.-A., et al. 2006, MNRAS, 372, 591
Pimbblet, K. A., Shabala, S. S., Haines, C. P., Fraser-McKelvie, A., & Floyd, D. J. E. 2013, MNRAS, 429, 1827
Poggianti, B. M., von der Linden, A., De Lucia, G., et al. 2006, ApJ, 642, 188 Poggianti, B. M., Arag´on-Salamanca, A., Zaritsky, D., et al. 2009, ApJ, 693, 112 Popesso, P., & Biviano, A. 2006, A&A, 460, L23
Rykoff, E. S., Rozo, E., Busha, M. T., et al. 2014, ApJ, 785, 104 Silverman, J. D., Kampczyk, P., Jahnke, K., et al. 2011, ApJ, 743, 2 Szabo, T., Pierpaoli, E., Dong, F., Pipino, A., & Gunn, J. 2011, ApJ, 736, 21 Tanaka, M., Goto, T., Okamura, S., Shimasaku, K., & Brinkmann, J. 2004, AJ,
128, 2677
Umemura, M., Fukue, J., & Mineshige, S. 1998, MNRAS, 299, 1123
Urquhart, S. A., Willis, J. P., Hoekstra, H., & Pierre, M. 2010, MNRAS, 406, 368
van den Bosch, F. C., Aquino, D., Yang, X., et al. 2008, MNRAS, 387, 79 Vijayaraghavan R., & Ricker, P. M. 2013 MNRAS, 435, 2713
Villforth, C., Sarajedini, V., & Koekemoer, A. 2012, MNRAS, 426, 360 von der Linden, A., Wild, V., Kauffmann, G., White, S. D. M., & Weinmann, S.
2010, MNRAS, 404, 1231
Wen, Z. L., Han, J. L., & Liu, F. S. 2009, ApJS, 183, 197 Wen, Z. L., Han, J. L., & Liu, F. S. 2012, ApJS, 199, 34
Wetzel, A. R., Tinker, J. L., & Conroy, C. 2012, MNRAS, 424, 232 Willis, J. P., Pacaud, F., Valtchanov, I., et al. 2005, MNRAS, 363, 675 Wilman, D. J., Balogh, M. L., Bower, R. G., et al. 2005, MNRAS, 358, 88 Wilman, D. J., Pierini, D., Tyler, K., et al. 2008, ApJ, 680, 1009 XXL paper I, Pierre et al., submitted 2015
XXL paper II, Pacaud et al., submitted 2015 XXL paper III, Giles et al., submitted 2015 XXL paper IV, Lieu et al., submitted 2015 XXL paper VI, Fotopoulou et al., submitted 2015 XXL paper VII, Pompei et al., submitted 2015 XXL paper IX, Baran et al., submitted 2015 Zabludoff, A. I., & Mulchaey, J. S. 1998, ApJ, 496, 39