HAL Id: hal-01368016
https://hal.archives-ouvertes.fr/hal-01368016
Submitted on 18 Sep 2016
HAL is a multi-disciplinary open access
archive for the deposit and dissemination of
sci-entific research documents, whether they are
pub-lished or not. The documents may come from
teaching and research institutions in France or
abroad, or from public or private research centers.
L’archive ouverte pluridisciplinaire HAL, est
destinée au dépôt et à la diffusion de documents
scientifiques de niveau recherche, publiés ou non,
émanant des établissements d’enseignement et de
recherche français ou étrangers, des laboratoires
publics ou privés.
Enterprise 2.0 : literature taxonomy and usage
evaluation
Mayla Alimam, Emmanuel Bertin, Noel Crespi
To cite this version:
Mayla Alimam, Emmanuel Bertin, Noel Crespi. Enterprise 2.0 : literature taxonomy and usage
eval-uation. POEM 2016 : 9th IFIP WG 8.1 Working Conference on The Practice of Enterprise Modeling,
Nov 2016, Skövde, Sweden. pp.26-40, �10.1007/978-3-319-48393-1_3�. �hal-01368016�
Enterprise 2.0 – Literature Taxonomy and Usage
Evaluation
Mayla Alimam1,2 , Emmanuel Bertin1,2, Noël Crespi2
1 Orange Labs - Caen, France. {firstname.lastname}@orange.com 2 Telecom SudParis - Institute Mines-Telecom – CNRS 5157
Evry, France. {firstname.lastname}@telecom-sudparis.eu
Abstract. In the ten years since the emergence of the Enterprise 2.0 phenomenon, many studies have been realized in this field. This paper surveys today’s Enterprise 2.0 literature. Based on the ITIL methodology, it outlines its main research areas and highlights the remaining issues. Also, starting from the lack of empirical evaluation of the real usage of Enterprise 2.0 tools, it proposes to evaluate the use of a social networking platform in a large company based on the relationships created therein. Our findings indicate that social networking tools are not reflecting the employees’ actual relations at work.
Keywords: Enterprise 2.0; ITIL; enterprise social network; email; social graph
1
Introduction
Enterprise 2.0 (E2.0) was the term coined by Andrew McAfee ten years ago to describe “the use of emergent social software platforms within companies, or between companies and their partners or customers” [1]. The promising potentials of E2.0 tools have boosted their adoption in companies. For example, Gartner predicted in 2012 that 50% of large companies will have a deployed E2.0 solution by the end of 2016 [2].
Along with the rapid and wide spread use of these tools, many scholars have contributed to the understanding of this phenomenon. When they emerged, E2.0 tools were first considered as experimental [3], and studies mainly focused on their functionalities and potentials [4, 5]. However, now that one decade has passed after this emergence, other trends are observed. In their survey of E2.0 literature, Williams et al. [6] reveal a number of remaining issues in the research on these tools. The authors mainly argue that the rising E2.0 phenomenon has reached the point of sustainability and thus scholars must turn their focus to the empirical large-scale examination of their initiatives. In fact, E2.0 tools should be considered in the same way as Enterprise Resource Planning (ERP) systems. Research on these tools needs to be modelled and classified in order to point out whether they are aligned with the business needs. Hence, this paper provides a modelling perspective of E2.0 research that addresses the call of Williams et al. We consider E2.0 tools as standard enterprise IT services and propose to model their research into the processes of ITIL framework for the IT service management at enterprises. This modelling allows summarizing the
literature within categories representing the service lifecycle stages while identifying the remaining gaps at each stage. Furthermore, this paper provides an illustrative example of how to contribute to a main gap identified through the ITIL: evaluating the returned value of E2.0 tools. Based on a qualitative case study, we empirically analyze the links created in an enterprise social network and explore the similarity between these links and the employees’ daily work flows carried by the enterprise’s email tool.
The rest of the paper is organized as follows. Section 2 explains the methodology of our work. Section 3 presents the categories of E2.0 research modelled based on the lifecycle stages of the ITIL framework. Section 4 is devoted to our empirical contribution in an enterprise social network. Finally, Section 5 contains conclusions.
2
Research Methodology
This research study provides two main contributions addressing the following research questions. Considering E2.0 research field as a stable field after ten years of its emergence [6], is research within this field completely covering all aspects related to the entire lifecycle of E2.0 tools? How should the remaining gaps be addressed by researchers?
To answer the first question we model and evaluate E2.0 literature by mapping a selection of major contributions onto the five lifecycle stages provided by ITIL framework for delivering valuable IT services to the business. For that purpose, we followed a structured and iterative process built on Webster & Waston’s approach [7] to search, identify, and analyze the relevant literature. We considered within our scope the social media used in the workplace for corporate objectives. As this notion emerged in 2006, we deliberately excluded from our scope, scholarships appearing during the three years following this emergence in order to avoid the bias of exploratory and descriptive literature [6]. We therefore performed a keyword-based search1 for peer-reviewed articles published in major scholarly journals and
conferences proceedings since 2010 using the following digital libraries: Wiley Online Library, IEEE Xplore, SpringerLink, and Science Direct. Based on the abstracts of the returned 298 articles, 27 articles were identified as relevant to the defined scope. After a comprehensive analysis, we classified each article to one or more of the ITIL lifecycle stages.
Second, we highlight the need for research to turn its focus to empirical case studies. To address the second research question we observe the service’s overall lifecycle. ITIL’s guidelines emphasize the importance of continually evaluating the delivered tool once it comes into use. In fact, it’s based on empirical usage evaluation that scholars as well as practitioners can better look into improving the tools’ design and methods of control. This evaluation should be able to assess the benefits of the implementation and measure its returned value based on tangible indicators. We provide, thus, in Section 4, an illustrative example of how to perform such evaluation.
1 In addition to “E2.0”, the notion of using social media tools in organizational contexts is also
3
Literature review based on ITIL perspective
3.1 ITIL Framework Overview
Information Technology Infrastructure Library (ITIL) is a globally recognized standard that contains a series of best practices for IT Service Management (ITSM) in organizations. First published in 1989, ITIL has grown to be the most popular and complete ITSM framework that aligns IT services with business needs [8, 9]. It provides in its latest edition of 2011 a revolving flow of five core stages that cover and manage the lifecycle of the IT service. These stages are as follows: service strategy, design, transition (for its deployment management), operation and continual service improvement.
3.2 Distribution of E2.0 Literature on the ITIL Lifecycle Stages
Stage 1: Service Strategy
During the service strategy stage, the enterprise management decides on the strategy to serve its employees starting from their needs aligned by the company’s strategic objectives. At this stage of the lifecycle, researchers are interested in defining the concerned tools, describing their behavior and providing their characteristics and specifications. Regarding its scope, E2.0 is still considered as a combination of Web 2.0 technologies integrated into multiple organizational processes for which no specific set of tools has been provided. However, current research seems to have an implied consensus about the key tools that are the most often deployed in enterprises. Table 1 interprets this consensus, providing an overall list of E2.0 tools noted in major contributions in this area [3, 4, 10, 11, 12, 13] while comparing them to a primitive list that has been provided at the early stage in [3].
Table 1. Common research contributions on listing E2.0 tools
E2.0 Tools Contributions Web se rv ice s P 2P n etwo rk in g Co ll ec ti ve in telli ge nc e S oc ia l n etwo rk in g P od ca sts Blo gs Mi cr ob lo gg in g RS S fe ed s Wik is M ash -ups S oc ia l b oo km ar k in g Virtu al wo rl ds S oc ial cu sto m er re latio nsh ip m an ag em en t
Early stage Bughin [3]
Current Androile [4] McAfee [12] Schubert&Glitsch [13] Treem& Leonardi [11] Burégio et al. [10] Common tools
Regarding the specifications of E2.0 tools, scholars are now contributing more deeply to the definition of these tools’ characteristics. Several aspects are being discussed, with the objective of assisting companies in deciding on the appropriate tool for adoption [13, 14]. In terms of functionality, researchers tend to explore the tools’ capabilities and potentials on two levels: collective and individual. At the collective level, E2.0 tools are categorized based on their functional features with the aim of highlighting their potential. The following capabilities are offered by these tools according to the literature:
Information sharing [15, 16, 17],
Communication and social relations [15, 13, 4, 18], Collaboration / cooperation and innovation [15, 4, 13, 18]; Training and learning [15, 4],
Knowledge management [15, 4], and
Management activities and coordination [15, 13, 4].
At a more specific level, the degree to which a capability is afforded in each tool is highlighted in [15]. For example, wikis support a high degree of collaboration and innovation but a low degree of management activities and problem solving. Reference [10] also provides a detailed description of each tool’s benefits and possible risks. According to its authors, wikis co-create knowledge through shared content but require strong commitment to keep content updated; online social networks support access to expertise, resources, and leaders with the provided social profiles, however, their advantages are only useful when they are accessed by a large number of users; Microblogging encourages interactive discussions and allows an informal information communication, but its unstructured content might cause information overload; social bookmarking promotes a useful information resources assessment, but raises confidentiality concerns when the access to resources is open; and finally, social customer relationship management allows to get closer to customers and derives meaning from social data through analytics, but risks consumers' limited engagement if no tangible value is added to their experience.
At the same individual level, another perspective of exploring the tools’ capabilities is provided in [11]. This approach particularly looks into the communicative behavior of E2.0 tools while comparing them to the enterprise’s traditional communication tools. The authors identify four capabilities emerging from the use of E2.0 tools. They refer to these capabilities as affordances and identify them as follows: visibility, editability, persistence, and association.
Finally, on the enterprise side, studies are emphasizing the need to correlate between the organizational requirements and the specifications of E2.0 tools. To that end, a framework is proposed in [13]. The framework supports companies in performing their requirement analysis based on an established overview of activities (business processes and use cases). While arguing that business activities that have a non-sequenced ad-hoc structure cannot be modeled, the authors propose describing these types of activities through use cases. These use cases differ from business processes in being flexible and unpredictable in their sequence. Consequently, the framework uses the activities’ description to identify candidate areas for collaboration scenarios. These scenarios are then matched with features of the tools. The authors
finally propose to establish a generic catalogue of predefined collaboration scenarios that occur frequently occur in companies.
Nevertheless, researchers are neglecting to consider at this stage the variation of companies’ size between small and large which influences the company’s requirements and financial capacity.
Stage 2: Service Design
The service design includes all actions related to the design of the ESM. The enterprise management decides whether to develop a new private ESM or otherwise to select and customize a market offering. These models of delivery are provided in [19] as follows:
Making use of public sites such as publicly available microblogs and online social networking sites (e.g. Facebook) to enable employees’ interactions with external customers;
Private solutions exclusively for internal audiences, implemented and hosted either by the company itself or as cloud-based services; and
In-house developed proprietary solutions, often built as prototypes.
Reference [20] goes beyond the delivery to provide a classification that explores the business models of social networking product providers. It outlines three types of these models: a consumer model which is community driven (e.g. Facebook), a corporate model, tightly integrated with organizational processes and technologies (e.g. Microsoft SharePoint), and finally, an emerging hybrid model, which blends the community driven benefits with the corporately focused models (e.g. Jive).
Further technical specifications are also discussed in [21] and [10]. From a systemic perspective, [21] proposes two possible scenarios for the design of systems containing E2.0 tools: either to have them federated in a single integrated platform, or to maintain their individuality while enabling coordination between their data. In addition, [10] conceptualizes an architecture where the level of control varies based on the process type (i.e. strict for structured data in the business world and loose for unstructured data in the social world).
However, we highlight here the need for the design to cover more technical details related to its consistency and compliance with the company’s processes, infrastructure, policies, etc. The analysis of their social interaction patterns in corporate environment is also necessary as these tools are usually designed for smaller numbers of users.
Stage 3: Service Transition
Deploying ESM is achieved at the service transition stage. Various approaches to explore the deployment process of E2.0 tools and assist the organizations in performing this deployment are present in the literature. Some studies propose checklists and guiding frameworks consisting of steps to be engaged by the companies wanting to succeed at this operation [3, 10, 15, 20]. In addition to the technological aspect, these studies also incorporate the organizational as well as the managerial considerations in the tool’s deployment process.
A wide perspective of tool deployment frameworks is presented in [15] where authors adopt a fit-viability model to evaluate E2.0 initiatives. Two major considerations are exploited within this framework. For its decision to select a technology to be deployed, the company should consider the right fit between the tasks to be performed, and the selected tool. The adoption decision should also consider the viability of three organizational factors to ensure the readiness of the company before the deployment. These factors concern the financial aspect of the adoption, the existing IT infrastructure for the adoption’s feasibility, and finally, the human and organizational factors, including for example managers’ and employees’ readiness, legal issues, etc. After these factors have been examined, the framework proposes to adopt a well-defined deployment strategy, and to, finally, pursue the deployment process by measuring the performance of the tool to assess the business value of this adoption.
Other studies, however, contribute specifically to the practical deployment of the tool. Regarding the definition of the deployment strategy, its several approaches are explored in [22] while discussing each approach’s advantages and challenges. The chosen strategy must be aligned with the organization’s mission, work processes, culture and industry. A bottom-up approach is best applicable in growing organizations with a critical mass of younger employees or in flatter organizations where younger employees have better visibility to senior management. A middle-out approach is optimal in larger, globally dispersed organizations where entrepreneurs and middle managers have enough technical knowledge to master these tools and enough influence over the projects and work processes to diffuse this usage. A top-down approach is however optimal in situations where a rapid adoption is needed to meet competitive challenges. Furthermore, a hybrid approach is proposed in [20]. It combines top-down elements with bottom-up elements to provide guidance and managerial support while allowing a degree of autonomy in usage and content creation by the end-users. Particularly in the case of small or medium enterprises, the deployment strategy has to be totally supported by the top management [23].
Researchers are also bringing attention to the organizational challenges and risks related to the deployment of E2.0 tools. These challenges concern factors mainly related to the enterprise culture and strategic thinking which might be against adopting this technology [15, 24, 20], and to the information management (i.e. legality, security and privacy, and intellectual property and copyright) [15]. A governance policy that complies with the company’s regulation and strategic objectives should be thus elaborated [15, 25]. Also, the company’s financial resources may also be a factor in the case of small and medium-sized enterprises. External expertise can be consulted in this case to ensure avoiding a failed adoption [17]. Furthermore, [26] provides in a systematic approach four main risk categories described in a risk catalog. The catalog is obtained from an evolved conceptual risk model that characterizes the risks based on their properties (i.e. the causes, factors and consequences of the risks). The four outlined categories are as follows: loss of control, loss of reputation, information leakage, and managerial risks.
Nevertheless, challenges and successful deployments are tightly related to the organizational form as argued in [27]. E2.0 tools are a good fit in enterprises characterized as highly fluid and horizontal. Their deployment in rigid enterprises can
also assist in achieving an organizational transformation towards more agility if this latter is specifically targeted.
Finally at this stage, we highlight the need for more empirical experiments and case studies to evaluate the theoretical frameworks and provide strategies for risk mitigation.
Stage 4: Service Operation
The service operation stage is responsible for technical, applications and operation management. Research at this stage is focusing on promoting users’ participation and defining methods for controlling the tools’ operations and generated information. According to scholars, the perception of benefits can vary between users. This perception can be a contextual phenomenon influenced by user types as captured and interpreted in [28]. E2.0 tools are qualified here as technologies-in-practice [29] for which the usage patterns take shape during practice according to users’ specific work practices. Three uses are outlined for three levels of users: as a social tool for task coordination in teams, as a social tool for organizing within projects or as a networking and crowd-sourcing space at enterprise-wide levels. This perception can also be related to the user’s appropriation of the tool. Reference [18] highlights how the intensity of usage impacts this perception. Only active contributors experience most of the benefits consistently. A moderate level of contribution is, however, sufficient for a user to experience the spirit of belonging and sense-making. Reference [30] also reveals a broader factor impacting the user appropriation and the perceived usefulness of E2.0 tools. This factor is related to the formerly established assumptions of a company’s employees about the usage of the tool. The authors outline how the personal advanced experience of a category of employees in public social media is paradoxically limiting these employees’ perception of a tool’s usefulness. This skeptical category, usually consisting of younger employees, is resisting shifting its technological frame to a corporate context. This resistance is explained by the category’s concerns about potential distraction or threats resulting from the use of E2.0 tools. In contrast to older employees, this category finds these tools unsuitable for task-orientated usages.
Regarding the control of the tools, [25] argues that companies should formulate and apply, by means of a decision making authority, a practical technology roadmap. This latter should involve training, communication and promotion program supported by online training content and live workshops and training sessions. It should also involve aspects related to user rights and content diffusion permissions [13, 23]. Reference [20] suggests empowering end-user participation and giving users sufficient autonomy to exploit, contribute and distribute content. Users have to be convinced of the benefits of the selected tool, as the act of using it is often voluntary [13]. This is why, according to [23], considering the employees’ mindset is a key factor of a successful implementation, especially in the case of small and medium-sized enterprises. In terms of practice, [31] suggests integrating the social dimension into the development and maintenance of the organizational information system. It creates social networks represented by relations between the process’s components. These relations serve solving the resources conflicts and monitoring the performance of the business processes.
Nevertheless, research needs to bring other control aspects into focus. The matter of how controlling and protecting the privacy of the generated knowledge while empowering users’ participation and initiatives remains problematic.
Stage 5: Continual Service Improvement
During the continual service improvement, the enterprise focuses on the value returned to its employees and its outcomes while ensuring that the service is continually addressing future needs. Particularly in large-scale organizations, analysis and mining approaches are being applied to datasets derived from enterprise social networking platforms to evaluate users’ interactions over the tool and to thus evaluate the impact of these platforms. The relationship between users’ interactions on their social network and their attributes derived from the company’s hierarchal graph is explored in [32]. Several formal statistical models based on logistic regression are built here to quantify the effects of these attributes on the interaction patterns. Two influencing attributes are revealed as follows. Regarding the geo-location, users are more likely to interact when they are employed in the same country. Regarding the hierarchical level, pairs of peered employees or employee/direct manager pairs seem to have more interactions than pairs that have several hierarchal levels between them.
Also in a global organizational context, the financial aspect is mined in [33], however, through a broader analysis. Data here are gathered not only from the company’s social networking platform, but also from other sources including e-mails and instant message communications. These findings reveal that mixing genders in teams produces a better financial performance, and that projects, with too many managers seem, to be less successful financially.
Other approaches to evaluating E2.0 tools based on their performance assessment are proposed in [10, 15]. Scholars contribute to this area by proposing key performance indicators. A set of impact metrics is derived from tools’ capabilities and provided in [4]. These metrics remain, however, at a high, general level, as they are not directly related to the technology itself. For example, what the author derives from the functionality of knowledge management are the following metrics: ability to share knowledge, ability to retrieve knowledge, ability to organize knowledge, and ability to leverage knowledge. Clearly such metrics need to be more specific. They should, in fact, be derived from each tool’s technical specification, as suggested in [15]. The authors here propose sample criteria for measuring the performance of contributors on an online social networking platform. Their sample contains the following criteria: increased conversion rate, increased employee and/or customer satisfaction, reduced customer service cost, reduced rate of customer attrition, increased stickiness (time spent on vendor’s web site), intensity of customer-to-customer communication, increased revenue, number of ideas generated by employees and partners, and online social shopping volume (if available).
Finally here, we highlight the high importance of this stage as it examines the overall lifecycle of the tool. The definition of the returned value of E2.0 and how this value can be measured is yet ambiguous. More focus on its actual usage and on the analysis of its generated data is thus indispensable.
Within this context, we propose in the next section a contribution to this specific stage of the lifecycle.
4
Contribution to the Evaluation of an E2.0 Tool
Our contribution provides an example of how empirical analysis can be performed to evaluate the use of an E2.0 tool. We propose a new approach that evaluates the benefit of a tool by comparing its use to the work patterns at the workplace. The objective is to assess the usage offered by this tool and its influence on/by the employees’ practices.
To that end, we select to evaluate one of the most deployed E2.0 tools in the workplace; an enterprise social networking platform [34]. The power of this tool resides in its ability to link between people on a large scale. Its established network of relations offers its users a social base wherein various activities such as communication and collaborating can be performed depending on the platform’s enabled features. In fact, since its emergence in knowledge-working corporations, the use of this tool has been often supported by the leading authority aiming to shift its internal communicational activities towards this new wave of tool [35]. We are therefore interested in exploring the social graph underlying the design of this tool.
To obtain our objective, we attempt to determine whether the tool’s established social network reflects the real-life relations that exist between employees at work. We argue that, prior to using enterprise social networking platforms in companies, employees already had their own implicit social networks, expressed through their daily communicational activities. To this day, the majority of these activities are performed through email message exchanges. In fact, the electronic messaging system (email) has been the primary enabler of a wide variety of activities due to the plasticity of use it offers [36]. We therefore consider its residing social network as the most representative graph of workers’ professional relations we can use for comparison.
Next, we define the questions and the main observations that we are aiming to perform based on the comparison between the two graphs. Is the established social relation network of the enterprise social networking platform reflecting the existing workers’ relations expressed in the email social graph? What characterizes the identified relations in the enterprise social networking platform?
Finally, we search to answer the defined question by conducting an experiment on a qualitative sample of participants. We chose the qualitative approach because we needed to obtain a qualitative data set for the base of our comparison [37]. Indeed, workers’ professional inboxes are the most appropriate sources for modeling their relations; however, at the same time, these inboxes contain a large portion of clutter. We did not want such unrelated messages to impact the credibility of our results.
Further details about the collected data and the performed analysis are provided in the next sub-sections.
4.1 Experimental Data Collection
To obtain our data sets, we conducted an experiment in a large telecommunication provider where knowledge work is prominent. The company has a social networking platform based on Jive Software. Further in this paper, we will refer to this tool as “Jive”. Jive was deployed in the targeted company in 2014. Its use has now become more popular as it is being supported by the hierarchal authority.
As explained earlier, the experiment was conducted on a qualitative sample of representative users. Our sample involved 37 participants. Profiles of the participants were carefully selected to include employees of various ages, types and backgrounds (i.e. project managers, team leaders, research and development engineers, academic researchers). Further, we made sure to select participants who are active workers at the enterprise as well as active to moderate users on Jive.
The purpose of selecting this sample was to build the social participants’ sub-graphs at the two environments and compare the resulting two sub-graphs. To that end, we asked each participant to provide us with an accurately selected sample of his/her own messages. Each participant’s selected messages had to be representative of his/her daily and recent activities at the workplace (i.e. containing exchanges with the most relevant persons as estimated by the participant himself/herself).
Two data sets were collected to build our graphs using NodeXL [38]. Data set A concerned data from the participants’ email messages. The data collecting went was as follows: for each message, collect the sender’s name u, the recipient(s) name(s) vi; create an undirected edge between the nodes:
e(u,vi); i=1 to n (1)
Note that we only involved the recipients in the “To” field and considered the “CC” field as less relevant.
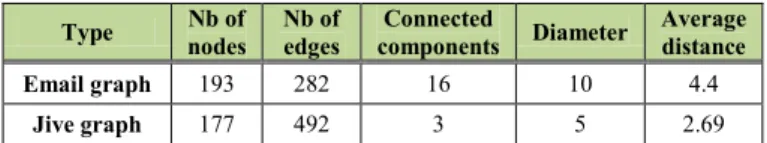
Table 2. Information about the two graphs
Type Nb of nodes Nb of edges components Connected Diameter Average distance
Email graph 193 282 16 10 4.4
Jive graph 177 492 3 5 2.69
Data set B concerned data from Jive, collected as follows: for each participant u, collect his/her list of relations vi; create an undirected edge between the nodes as in (1). Duplicate edges were eliminated from both graphs. Table 2 provides information about the two graphs.
4.2 Similarity Comparison
We approach the similarity comparison between the two built graphs at two levels. The first level provides an overall comparison between the two graphs whereas the second level looks into the correlation between the two graphs based on their common nodes and corresponding distances. More details are provided below.
Overall similarity.
To make an overall comparison between the email graph A and Jive graph B, we apply a method that measures their similarity and provides a single similarity score [39]. The advantage of this method among the other measures proposed in the literature is that it involves nodes’ neighbor matching while performing an iterative calculation of the nodes’ similarity.
The concept of the developed algorithm is as follows: two nodes i in A and j in B are considered similar if the neighbor nodes of i can be matched to similar neighbor nodes of j.
(2)
Equation (2) calculates the similarity of the i th node of graph A and j th node of graph B in (k+1) th iterations where s(i,j)in is the in degree similarity of node i in A and j in B, and s(i,j)out is the out degree similarity of node i in A and j in B. These degrees are calculated in (3) and (4), respectively, using the summation of the neighbors’ similarity in the previous iteration.
(3)
Note that id(i) stands forth in-degree of node i and od(i) the out-degree of node i.
(4)
Iteration of node similarity calculation is repeated until convergence. An epsilon value is defined to determine that point, based on the difference between node similarities in two iterations.
(5)
A matrix of similarity scores of the nodes in the two graphs is then calculated. The final similarity value is provided in (6) as the sum of the maximum similarity values of the two graph nodes divided by the size of the smaller graph.
(6)
Correlation between corresponding nodes and edges.
The second level of comparison involves the node’s identity in the analysis. It searches for correlation between pairs of nodes based on their corresponding distances. This approach applies the following method:
Define the Jive distance d as the calculation of the shortest path between a given pair of nodes (i, j) in Jive graph B; and then
For each pair of nodes in email graph A, calculate its corresponding value d in B.
4.3 Results
Overall similarity.
Applying the first measure indicated a low level of similarity between the two graphs. Details about the results of the algorithm are as follows: the optimal value that allowed obtaining the convergence of iterations according to our tests was 0.1.For a better estimation of this value, we provide the similarity calculation results for two given identical graphs in Table 3.
Table 3. Similarity calculation for two identical graphs
0.1 0.01 0.001
s(A,B) 93.75% 99.22% 99.90%
For our two graphs, the returned similarity percentage was: s(A,B) =24.97%
Correlation between corresponding nodes and edges.
Regarding the Jive distances of the email graph’s pairs, Figure 2 gives the summary of the Jive distances’ calculation for all the email pairs. Recall that a Jive distance d represents the shortest path calculation for a given pair of nodes (i, j).
As seen in the Figure, Jive distances range between 0 and 3. The value of 0 indicates that a given email pair does not exist in the Jive graph (i.e. no relation is found between the two people in a Jive graph). On the other hand, a value of 3 indicates that a given email pair is related in the Jive graph, however not directly. The majority of Jive distances (72%) have a value of 0.
However, the majority of distances found range between the values of 1 and 2. Only a few Jive distances have a value of 3. These results are discussed in the next sub-section.
4.4 Discussion
The low percentage of the measured similarity calculated based on neighbor matching provides a first indication of the lack of overall correlation between the two graphs. The distance calculation also demonstrates this low correlation by the variation of distances between 0 (non-existent relations) and 1 to 3 (existent; however, not always directly). Our results indicate that the majority of email relations located in the email graph could not be located in the Jive graph; the relations in the two graphs are not correlating. Only 16% of the email relations took place directly in the Jive graph. We infer from these findings that the Jive relations do not reflect the worker’s existing activities at the workplace. Reciprocally, identified Jive relations that are not located in the email graph express the new channels of communication that were created with the use of the tool.
Fig. 2. Histogram of Jive distances
These channels demonstrate the potential of a social networking tool, when used in a corporate context, to expand a worker’s scope of relations for future collaboration or communication.
Nevertheless, the correlated portion of workers’ relations in the two graphs opens the question of how the usage of these two tools is taking place. The dual existence of relations indicates parallel communication channels between the same people.
Finally, the purpose of this usage needs to be characterized in future research to provide some insight into how new tools are impacting the existing working tools. The scope of this analysis can also be expanded to include, in addition to email, other working tools such as instant messaging, conferencing, etc. The same analysis can thus be applied to measure the benefit of other types of E2.0 tool. However, our approach here does not include, within its comparison, the analysis of users’ interaction over the platform. We consider this lack as a limitation that can be included in future research.
5
Conclusion
This paper develops the understanding about the current state of Enterprise 2.0 research. It provides a brief review of the recent major contributions to E2.0 literature while modelling it to ITIL processes for IT service management. Our overall observation of the five resulted categories suggests the following: the goal of introducing the tool should be clearly and precisely stated from the beginning and not be a somehow vague objective such as “bringing agility” or “transforming ways of working”. All the lifecycle processes should be then oriented toward this goal, which can then be continuously monitored and evaluated (through well-defined KPIs).
Our paper, therefore, contributes to the evaluation stage by providing an empirical example of how the use of an E2.0 tool can be assessed. The example evaluates users’ relations on an enterprise social networking platform by comparing them to the natural relations that the same users create while performing activities at the workplace. Analysis of the qualitative data that we collected indicates that workers’ relations on their social networking tool are not similar to their actual relations. This outlines how enterprise social networking is providing new scopes for interacting, rather that reflecting the existing work processes of an enterprise.
In conclusion, since empirical results are more reliable, we highlight the need for case studies and experiments such as the one provided in our example to develop further understanding about the remaining issues in E2.0 research. We therefore prompt scholars to consider empirical methods in their future research to provide more insights into the adoption of these tools, especially for practitioners.
References
[1] McAfee, A.P.: Enterprise 2.0 : The Dawn of Emergent Collaboration. MIT Sloan Management Review 47, 21–28 (2006).
[2] Mann, J., Austin, T., Drakos, N., Rozwell, C., Walls, A.: Predicts 2013: social and collaboration go deeper and wider. Gartner. Inc. Report (2012).
[3] Bughin, J.: The rise of enterprise 2.0. Journal of Direct, Data and Digital Marketing Practice. 9, 251–259 (2008).
[4] Andriole, S.J.: Business impact of Web 2.0 technologies. Communications of the ACM. 53, 67–79 (2010).
[5] Kuettner, T., Diehl, R., Schubert, P.: Change factors in enterprise 2.0 initiatives: Can we learn from ERP? Electronic Markets. 23, 329–340 (2013).
[6] Williams, S.P., Hausmann, V., Hardy, C.A., Schubert, P.: Enterprise 2.0 Research: Meeting the challenges of practice. BLED 2013 Proc. (2013).
[7] Webster, J., Watson, R.T.: Analyzing the past to prepare for the future : Writing a literature review. MIS Quarterly. 26, xiii–xxiii (2002).
[8] Marrone, M., & Kolbe, L. M.. Impact of IT service management frameworks on the IT organization. Business & Information Systems Engineering, (2011): 3(1), 5-18.
[9] Arraj, V. ITIL®: the basics. Buckinghampshire, UK. (2010).
[10] Buregio, V., Maamar, Z., Meira, S.: An architecture and guiding framework for the social enterprise. IEEE Internet Computing. 19, 64–68 (2015).
[11] Treem, J.W., Leonardi, P.M.: Social Media Use in Organizations. Communication Yearbook. 36, 143–189 (2012).
[12] McAfee, A.: Enterprise 2.0: How to manage social technologies to transform your organization. Harvard Business Press (2013).
[13] Schubert, P., Glitsch, J.H.: Adding Structure to Enterprise Collaboration Systems: Identification of Use Cases and Collaboration Scenarios. Procedia Computer Science. 64, 161–169 (2015).
[14] Williams, S.P., Schubert, P.: An Empirical Study of Enterprise 2.0 in Context. Proceedings of the Bled Conference. 42–55 (2011).
[15] Turban, E., Bolloju, N., Liang, T.-P.: Enterprise Social Networking: Opportunities, Adoption, and Risk Mitigation. Journal of Organizational Computing and Electronic Commerce. 21, 202–220 (2011).
[16] Fulk, J., Yuan, Y.C.: Location, motivation, and social capitalization via enterprise social networking. Journal of Computer-Mediated Communication. 19, 20–37 (2013).
[17] Gibbs, J.L., Rozaidi, N.A., Eisenberg, J.: Overcoming the “Ideology of Openness”: Probing the affordances of social media for organizational knowledge sharing. Journal of Computer-Mediated Communication. 19, 102–120 (2013).
[18] Holtzblatt, L., Drury, J.L., Weiss, D., Damianos, L.E., Cuomo, D.: Evaluating the uses and benefits of an enterprise social media platform. Journal of Social Media for Organizations. 1, 1–21 (2013).
[19] Leonardi, P.M., Huysman, M., Steinfield, C.: Enterprise social media: Definition, history, and prospects for the study of social technologies in organizations. Journal of Computer-Mediated Communication. 19, 1–19 (2013).
[20] Mathiesen, P., Fielt, E.: Enterprise social networks: a business model perspective. In: 24th Australasian Conference on Information Systems (ACIS). pp. 1–12. RMIT University (2013).
[21] Alimam, M., Bertin, E., Crespi, N.: Enterprise Social Systems: The What, the Why, and the How. In: 2015 IEEE 17th Conference on Business Informatics. pp. 9–17. IEEE (2015).
[22] Guinan, P.J., Parise, S., Rollag, K.: Jumpstarting the use of social technologies in your organization. Business Horizons. 57, 337–347 (2014).
[23] Meske, C., Stieglitz, S.: Adoption and Use of Social Media in Small and Medium-Sized Enterprises. Lecture Notes in Business Information Processing. 1–14 (2013).
[24] Haefliger, S., Monteiro, E., Foray, D., von Krogh, G.: Social software and strategy. Long Range Planning. 44, 297–316 (2011).
[25] Louw, R., Mtsweni, J.: The quest towards a winning Enterprise 2.0 collaboration technology adoption strategy. International Journal of Advanced Computer Science & Applications 4, 34–39 (2013).
[26] Braun, R., Esswein, W.: Towards a conceptualization of corporate risks in online social networks: A literature based overview of risks. Proceedings - IEEE International Enterprise Distributed Object Computing Workshop, EDOC. 267–274 (2013).
[27] Alimam, M., Emmanuel B., and Noel C. Social And Collaborative Services For Organizations: Back To Requirements. The Spring Servitization Conference. (2015). [28] Richter, A., Riemer, K.: The Contextual Nature Of Enterprise Social Networking: A Multi
Case Study Comparison. ECIS 2013 Proceedings. 12 (2013).
[29] Orlikowski, W. J., and C. Suzanne I. The truth is not out there: an enacted view of the “Digital Economy”. Understanding the digital economy: Data, tools, and research (2000): 352-380.Cao
[30] Treem, J.W., Dailey, S.L., Pierce, C.S., Leonardi, P.M.: Bringing technological frames to work: How previous experience with social media shapes the technology’s meaning in an organization. Journal of Communication. 65, 396–422 (2015).
[31] Maamar, Z., Faci, N., Kajan, E., Boukadi, K., Sakr, S., Boukhebouze, M., Mostéfaoui, S.K., Burégio, V., Yahya, F., Monfort, V.: Enterprise 2.0: Research Challenges and Opportunities. In: International Conference on Web Information Systems and Technologies. pp. 16–30. Springer (2014).
[32] Cao, J., Gao, H.Y., Li, L.E., Friedman, B.: Enterprise Social Network Analysis and Modeling: A Tale of Two Graphs. Proceedings of the IEEE Infocom. 2382–2390 (2013). [33] Lin, C.-Y., Wu, L., Wen, Z., Tong, H., Griffiths-Fisher, V., Shi, L., Lubensky, D.: Social
network analysis in enterprise. Proceedings of the IEEE. 100, 2759–2776 (2012).
[34] Chui M., Manyika J., Bughin J., Dobbs R., Roxburgh C., Sarrazin H., Sands G. and Westergren M., The social economy: Unlocking value and productivity through social technologies, McKinsey Global Institute (2012).
[35] Silic, M. Back A. and Silic D. Atos-Towards Zero Email Company. ECIS 2015 Proceedings (2015).
[36] Alimam M., Bertin E., Crespi N.. Improving The Capabilities Of Email For Businesses – The Case Of Social Tagging, ECIS 2016 Proceedings. (2016).
[37] Miles, M.B., Huberman, A.M.: Qualitative data analysis: A sourcebook of new methods. (1984).
[38] Smith, M., Milic-Frayling, N., Shneiderman, B., Mendes Rodrigues, E., Leskovec, J., Dunne, C., (2010). NodeXL: a free and open network overview, discovery and exploration add-in for Excel 2007/2010, http://nodexl.codeplex.com/ from the Social Media Research Foundation, http://www.smrfoundation.org
[39] Nikolić, M.: Measuring similarity of graph nodes by neighbor matching. Intelligent Data Analysis. 16, 865–878 (2012).
![Table 1 interprets this consensus, providing an overall list of E2.0 tools noted in major contributions in this area [3, 4, 10, 11, 12, 13] while comparing them to a primitive list that has been provided at the early stage in](https://thumb-eu.123doks.com/thumbv2/123doknet/12304931.324294/4.892.113.790.752.1018/interprets-consensus-providing-overall-contributions-comparing-primitive-provided.webp)