Université de Montréal
Solid-state NMR and Electrochemical Dilatometry Study of Charge Storage
in Supercapacitor with Redox-active Ionic Liquid Electrolyte
par Yanyu Wang
Départment de chimie Faculté des arts et des sciences
Mémoire présentée à la Faculté des études supérieures et postdoctorales en vue de l’obtention du grade de Maîtrise ès sciences (M.Sc.) en chimie
en chimie
Octobre, 2018
Résumé
Les liquides ioniques électroactifs se distinguent comme nouveaux électrolytes prometteurs pour les supercapacités électrochimiques en permettant notamment d’atteindre des densités énergétiques plus élevées qu’en milieux organiques ou avec des liquides ioniques traditionnels. Cet accroissement est dû aux réactions de transfert électronique (faradiques) qui y prennent place en plus de ceux dans la double-couche qui sont purement capacitifs. Les études fondamentales sur les mécanismes menant au stockage d’énergie dans des supercapacités à base de liquides ioniques électroactifs sont, bien qu’essentielles, peu nombreuses en comparaison avec les systèmes classiques. Le développement d’approches basées sur la spectroscopie de résonance magnétique nucléaire à l’état solide (SS-NMR) permet l’obtention d’information sur l’environnement local au sein des matériaux d’électrodes qui est nécessaire pour comprendre les mécanismes de stockage dans les supercapacités. Elle permet notamment de suivre l’adsorption et la désorption des ions dans la microstructure du carbone activé utilisé pour les électrodes. Ces approches ont jusqu’à maintenant été utilisées uniquement pour l’étude de systèmes classiques où le stockage n’est effectué que par les mécanismes non-faradiques (double-couche électrigue). Dans ce mémoire je présenterai l’utilisation de la SS-NMR en combinaison avec la dilatométrie électrochimique pour l’étude approfondie des mécanismes de stockage dans des supercapacités constituées d’électrodes à base de carbone activé et utilisant un électrolyte à base de liquide ionique électroactif. La capacité de cette approche pour la détermination de la contribution faradique à la charge emmagasinée a été démontrée pour la première fois. Cette étude a permis de démontrer que le mécanisme de stockage avec un électrolyte électroactif diffère en fonction du voltage appliqué aux électrodes. À l’électrode positive, la désorption des co-ions dans les micropores du carbone activé domine à bas voltage alors que l’adsorption des contre-ions devient importante à haut voltage où elle est accompagnée de l’oxydation du groupement électroactif présent sur le liquide ionique. À l’électrode négative, l’adsorption du contre-ion est le mécanisme principal peu importe le voltage appliqué. L’utilisation de la dilatométrie électrochimique qui permet de mesurer le changement d’épaisseur d’une électrode en fonction du potentiel appliqué a confirmé ces observations. Les résultats de ce mémoire ont permis de mieux
comprendre le stockage d’énergie par les supercapacités électrochimiques et l’approche développée pourra être appliquée aux systèmes d’électrolytes électroactifs afin d’en améliorer les performances.
Mots-clés : Liquide ionique électroactif; Supercapacité électrochimique; Réaction faradique; Spectroscopie de résonance magnétique nucléaire; Dilatométrie électrochimique.
Abstract
Redox-active ionic liquids are emerging as promising new electrolytes for supercapacitors, providing higher capacitance and energy density than organic or ionic liquid electrolytes. Fundamental studies of the charge storage mechanism in supercapacitors are of critical importance for the development and application of devices. Solid-state NMR (SS-NMR) methodology having the ability to provide local environment information within electrodes at the molecular level has been recently developed to study the mechanism of charge storage in supercapacitors. The charge storage in supercapacitors with organic or ionic liquid electrolytes has been studied by SS-NMR. The charge storage in supercapacitors with redox-active species that involves faradaic processes is different from those of electrochemical double-layer capacitors comprising organic solvents or ionic liquids as electrolytes. However, there are until now no published findings on charge storage mechanisms in supercapacitors with redox-active electrolytes. Therefore, fundamental studies of the charge storage mechanism in supercapacitors with redox-active ionic liquid electrolytes are needed. In this thesis, SS-NMR techniques combined with electrochemical dilatometry were used to investigate in depth the charge storage in supercapacitors comprising redox-active ionic liquid electrolytes. The charge contributed from the faradaic reaction of the redox-active species is determined for the first time by the NMR measurements. Moreover, it is revealed that the charge storage mechanism of supercapacitors with the redox-active ionic liquid electrolyte EMIm FcNTf/ACN (1-ethyl-3-methylimidazolium ferrocenylsulfonyl (trifluoromethylsulfonyl) imide/acetonitrile) is driven by different charge regimes for different voltages. More specifically, charge storage on the positive electrode occurs via co-ion desorption in the low voltage range and subsequently counter-ion adsorption in the high voltage range, whereas charging on the negative electrode occurs exclusively by counter-ion adsorption over the studied voltage range. The electrochemical dilatometry measurements show macroscopic dimensional changes of the electrodes during charging, further confirming the proposed mechanism suggested by SS-NMR. The results give a detailed picture of the charge storage of supercapacitors with a redox-active ionic liquid electrolyte, providing new insights on the charge storage in supercapacitors.
Keywords : Redox-active ionic liquid; Supercapacitors; Faradaic reaction; Solid-state NMR, Electrochemical dilatometry.
Table of Contents
Résumé...ⅰ Abstract...ⅲ List of tables... ⅷ List of figures... ⅸ List of abbreviations...ⅹⅲ Acknowledgements...ⅹⅵ Chapter 1: Introduction...1 1.1 Fundamentals of supercapacitors...21.1.1 Electrical double-layer capacitors...3
1.1.2 Pseudocapacitors...5
1.1.3 Hybride supercapacitors...6
1.2 Technical specifications of supercapacitors...6
1.2.1 Capacitance...7
1.2.2 Energy density and power density...7
1.2.3 Equivalent series resistance...8
1.2.4 Cycle-life...9 1.2.5 Self-discharge rate...9 1.2.6 Thermal stability...10 1.3 Electrodes of supercapacitors...10 1.3.1 Carbon-based materials...10 1.3.1.1 Activated carbons...13 1.3.1.2 Carbide-Derived carbons...15 1.3.1.3 Carbon nanotubes...16 1.3.1.4 Graphene...18 1.3.2 Pseudocapacitive materials...19 1.3.2.1 Metal oxides/hydroxides...20 1.3.2.1.1 RuO2...20 1.3.2.1.2 MnO2...21
1.3.2.2 Conductive polymers...22
1.4 Electrolytes of supercapacitors...23
1.4.1 Aqueous electrolyte...24
1.4.2 Organic electrolyte...25
1.4.3 Ionic liquids...28
1.4.3.1 General compositions, properties and supercapacitor performances...28
1.4.3.2 Pure ionic liquid electrolyte...32
1.4.3.3 Mixture of ionic liquid and organic solvent...35
1.4.4 Solid electrolyte...36
1.4.5 Redox-active electrolyte...38
1.4.5.1 Redox-active aqueous electrolyte...38
1.4.5.2 Redox-active ionic liquid electrolyte...39
1.4.5.3 Redox-active solid electrolyte...39
1.5 Description of thesis and objectives...41
References...42
Chapter 2: Materials and Methods...55
2.1 Materials...55
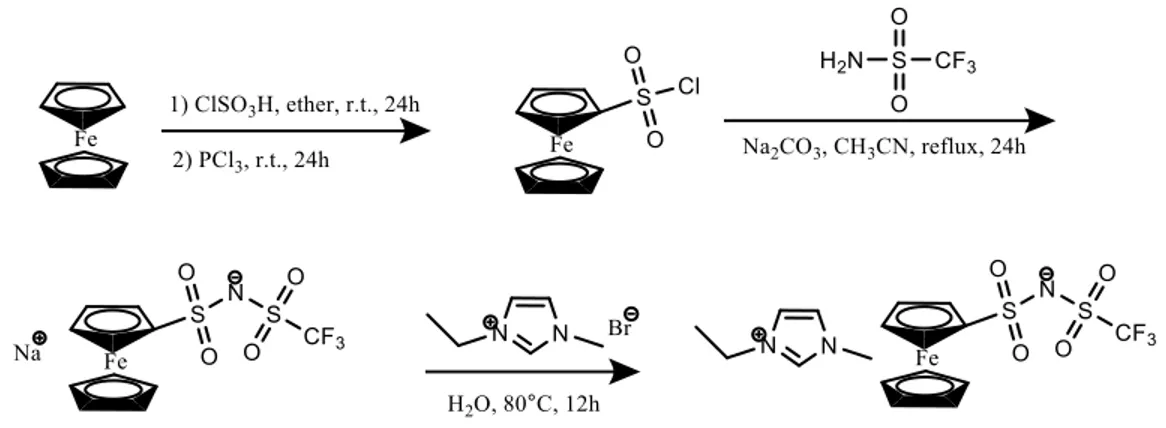
2.1.1 Synthesis and characterization of redox-acitve ionic liquid...55
2.1.2 Preparation of carbon electrode...57
2.2 Electrochemical dilatometry for the study of supercapacitors...57
2.2.1 Construction of electrochemical dilatometer...57
2.2.2 Electrochemical measurement...58
2.3 Solid-state NMR spectroscopy for the study of supercapacitors...58
2.3.1 Magic-angle spinning...58
2.3.2 19F nucleus NMR study...59
2.3.3 Identifying adsorbed species in microporous carbon...60
2.3.4 Insight into supercapacitor charging mechanisms...62
References...65
Chapter 3: Solid-state NMR and Electrochemical Dilatometry Study of Charge Storage in Supercapacitor with Redox-active Ionic Liquid Electrolyte...66
3.2 Introduction...69
3.3 Experimental section...72
3.3.1 Carbon electrode fabrication...72
3.3.2 Redox-active ionic liquid and electrolytes...72
3.3.3 Cell preparation...73
3.3.4 Ex situ NMR experiments...73
3.3.5 In situ electrochemical dilatometry experiments...74
3.4 Result and discussion...74
3.4.1 Static & MAS NMR spectra of soaked electrodes...74
3.4.2 Ex situ NMR studies of charge storage...77
3.4.3 In situ electrochemical dilatometry measurements of charging cells...83
3.4.4 Possible model of charging mechanism...85
3.5 Conclusions...86
3.6 Acknowledgements...88
References...89
3.7 Supporting information...93
3.7.1 Deconvolutions of ex situ NMR spectra...94
3.7.2 Cyclic voltammogram of supercapacitor with 50 % EMIm FcNTf in ACN...94
3.7.3 Characterization of EMIm FcNTf...95
3.7.4 Thermal analysis of EMIm FcNTf...97
List of tables
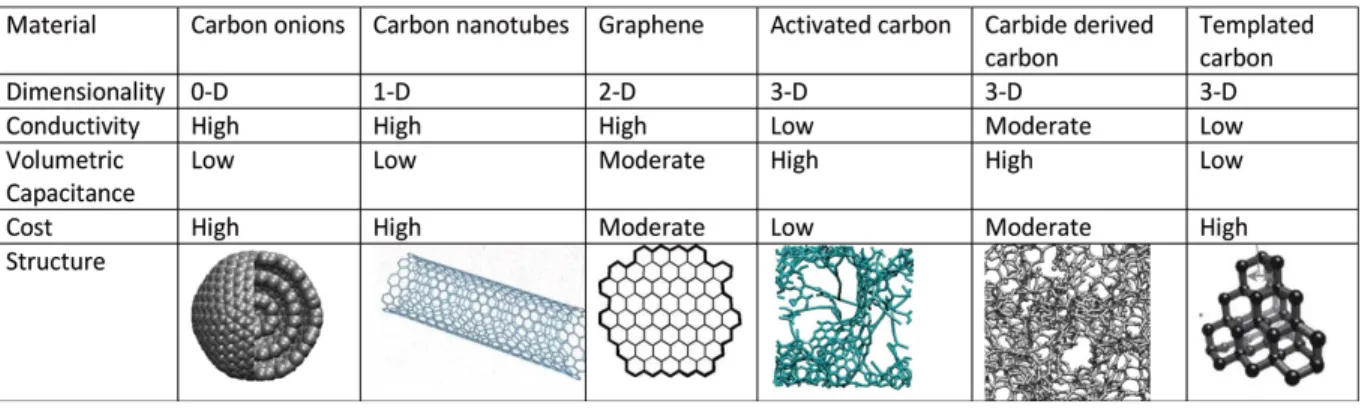
Chapter 1Table 1-1. Different carbon structures used in EDLCs with onion-like carbon, carbon nanotubes, graphene, activated carbon, and carbide-derived carbon and templated carbon. Reprinted from ref. 215.
List of figures
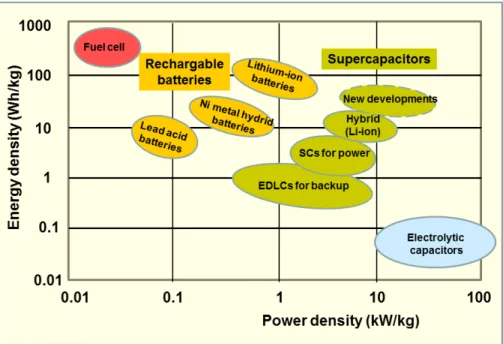
Chapter 1Figure 1-1. Ragone chart showing specific power vs. specific energy of various energy storage systems. Reprinted from Wikipedia (https://en.wikipedia.org/wiki/Supercapacitor).
Figure 1-2. Schematic diagram of (A) an electrostatic capacitor, (B) an electrical double-layer capacitor, (C) a pseudocapacitor, and (D) a hybrid-capacitor. Reprinted from ref. 3.
Figure 1-3. Models of the electrical double layer at a positively charged surface: (a) the Helmholtz model, (b) the Gouy–Chapman model, and (c) the Stern model, showing the inner Helmholtz plane (IHP) and outer the Helmholtz plane (OHP). d is the double layer distance described by the Helmholtz model. ψ0 and ψ are the potentials at the electrode surface and the
electrode/electrolyte interface, respectively. Reprinted from ref. 16.
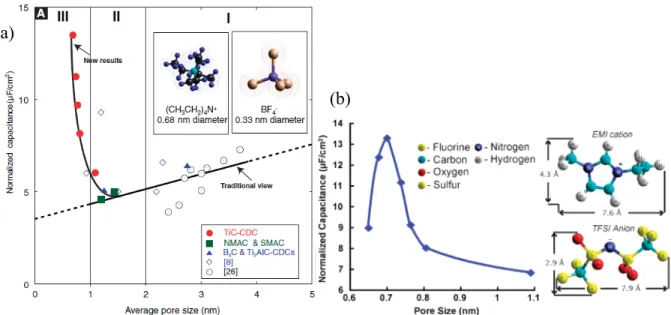
Figure 1-4. (a) Plot of normalized specific capacitance versus average pore size shows that capacitance decreases with decreasing pore size until a critical value was reached, unlike the traditional view which assumed that capacitance continually decreased. Reprinted from ref. 25. (b) Normalized capacitance change versus the pore size of the CDC samples; inset shows HyperChem models of the structure of EMIM and TFSI ions. Reprinted from ref. 27.
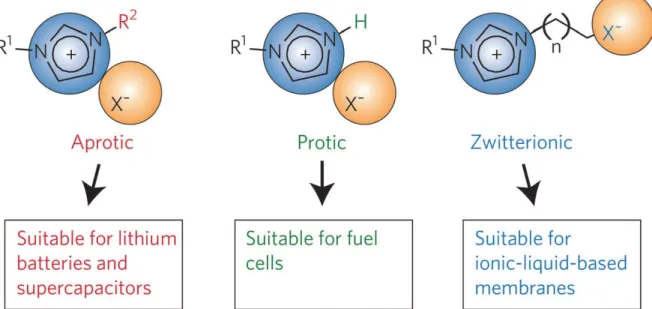
Figure 1-5. Basic types of ionic liquids: aprotic, protic and zwitterionic types. Reprinted from ref. 162.
Figure 1-6. Commonly used cations, anions of ILs for SCs, and some typical examples of ILs. Reprinted from ref. 131.
Figure 1-7. (a) Power density vs. energy density plots at 2.7 V and at 3.2 V for electrochemical supercapacitors with ILs studied. Reprinted from ref. 175. (b) Relationship between the electrochemical window and the energy density of graphene electrodes measured in different IL electrolytes. Reprinted from ref. 171. (c) The effect of cation size of ionic liquids on the capacitance of EDLCs. Reprinted from ref. 172.
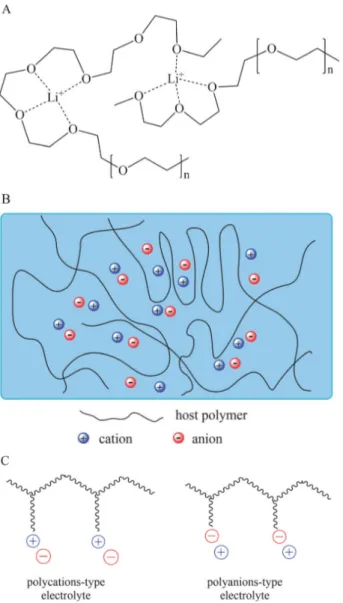
Figure 1-8. Schematic diagrams of (A) a dry solid-state polymer electrolyte (e.g., PEO/Li+),
(B) a gel polymer electrolyte, and (C) a polyelectrolyte. Reprinted from ref. 131. Chapter 2
Figure 2-2. Dilatometer in the full cell configuration Figure 2-2. Dilatometer in the full cell configuration.
Figure 2-3. (a) A cartoon showing in-pore ions located close to carbon surfaces in carbon micropores. (b) SEM image showing voids and large spaces between carbon particles where ex-pore ions reside. Reprinted from Ref. 2. (c) 19F MAS NMR (7.1 T) spectra of YP-50F
carbon film soaked with Pyr13TFSI ionic liquid. Reprinted from Ref. 3. (d) Schematic
illustration of the ring current-induced magnetic field, Bind, associated with delocalized
π-electrons in a six-membered carbon ring within an applied magnetic field B0. Reprinted from
Ref. 2.
Figure 2-4. Schematic illustrations of possible charge storage mechanisms within a micropore that contains anions and cations prior to charging. If the electrode surface is positively polarized, an equal negative ionic charge can arise through either (a) adsorption of ex-pore anions into the micropores, (b) exchange of ex-pore cations for in-pore anions or (c) the expulsion of cations from the micropores. Reprinted from Ref. 5.
Chapter 3
Figure 3-1. 19F NMR spectra recorded at MAS (8 kHz, top) and in static mode (bottom) shows
the necessity of spinning to obtain a sufficient resolution to isolate the in-pore ion contribution. The signals came only from the F atoms on the FcNTf anion. The peaks at about -35, -55 and -100 ppm are spinning sidebands. The measurements were done on the YP-50F carbon electrodes (95 wt % activated carbon and 5 wt % PTFE) soaked overnight in a solution of 50 wt % of the ionic liquid EMIm FcNTf in acetonitrile. The excess of electrolyte was removed prior to the measurements.
Figure 3-2. 19F NMR spectra of YP-50F carbon electrodes after contacting an excess of three
different EMIm FcNTf/ACN electrolytes overnight and removing the excess solution. The electrolytes contained (a) 30 wt %, (b) 50 wt % and (c) 80 wt % of the redox-active ionic liquid. The ex-pore peak (δ = -78 ppm) intensity reflects the increasing quantity of FcNTf in the interparticle spaces of the porous electrode. The deconvolution of the spectra was used to evaluate the relative surface area of both peaks (ex-pore and in-pore) and the concentration of in-pore anions (presented in the d) panel).
Figure 3-3. 19F NMR spectra of the positive and negative YP-50F activated electrodes of a
FcNTf redox-active ionic liquid in acetonitrile electrolyte and were charged using a 1 h potentiostatic step at the given voltage for 1 h (after equilibrating the cell with 5 GCD cycles, see Material and methods section for conditions). An increase in the relative proportion of in-pore FcNTf anions is observed at higher voltage values only at the positive electrode, as expected for double-layer charging. The quantity of anions in the carbon of the negative electrode remained constant.
Figure 3-4. Effect of the voltage on the 19F chemical shift of in-pore (red triangle and blue
diamond for negative and positive electrode, respectively) and ex-pore (black cross) anions. This variation of the peak resonance suggest a modification of the immediate anion environment during the charging process, an effect commonly seen with ionic liquids in activated carbon electrodes. The chemical shift of anions outside of the pores (bulk and interparticle spacing) is not affected by the voltage. Before recording the NMR spectra, the supercapacitor cells were poised to a voltage between 0 and 2 V for a duration of 1 h.
Figure 3-5. In-pore FcNTf anion population found in the positive (a) and negative electrode (b) of a supercapacitor after applying different voltage between 0.0 and 2.0 V for 1 h. Values are given as millimoles per gram of YP-50F carbon in each electrode and were calculated from the relative peak surface area after deconvolution of the NMR spectra. The increase at the positive electrode between 1.0 and 2.0 V is indicative of significant amounts of anion into pores during charging of the supercapacitor.
Figure 3-6. Comparison of ionic and total electronic charge stored in the supercapacitor at different voltages. The ionic charge is calculated from the increase in the quantity of in-pore FcNTf anions relative to the amount found in the carbon after soaking (unbiased electrodes, Figure 3-2d). The total charge represents the amount of coulomb that was accumulated over the potentiostatic step. For an applied voltage of 1.0 V and above, the oxidation of ferrocene to ferrocenium becomes a significant contribution to the charging mechanism.
Figure 3-7. Results from the in situ electrochemical dilatometry measurements on a supercapacitors cell with 50 wt % EMIm FcNTf acetonitrile solution as electrolyte. The measurements were done on the positive (a and b) and on the negative electrode (c), separately. Panel (b) shows an enlargement of the second cycle at the positive electrode. At low voltage, a contraction of the electrode is noted which is attributed to the expulsion of
cations. This small feature of the dilatometry curve was consistently observed in all measurements with the EMIm FcNTf ionic liquid (at the positive electrode only).
Figure 3-8. Schematic illustration of the different possible ion displacement inside and outside of the carbon micropores involved in supercapacitors based on the redox-active ionic liquid EMIm FcNTf electrolyte at different potentials. The different processes illustrated are proposed on the basis of the experimental results from NMR. The blue and red arrows indicate cations and anions (respectively) moving in or out of the micropores and the black arrows denote an electron transfer reaction. Note that solvent (acetonitrile) molecules are omitted for clarity and that electron transfer is also possible on the carbon particle surface, outside of the carbon pores (not shown).
Figure 3-S1. Spectral deconvolutions of ex situ 19F NMR data.
Figure 3-S2. Total 19F signal calculated from the sum of the peak surface area for ex-pore and in-pore contributions after applying different voltage between 0.0 and 2.0 V for 1 h.
Figure 3-S3. Cyclic voltammogram recorded with two-electrode Swagelok cell with 50% EMIm FcNTf in ACN at a scan rate of 10 mV·s-1 at 25 °C.
Figure 3-S4. a) Cyclic voltammogram recorded with three-electrode Swagelok cell with 50 % EMIm FcNTf in ACN at a scan rate of 1 mV·s-1 at 25 °C. b) Galvanostatic charge-discharge
profiles recorded with three-electrode Swagelok cell with 50 % EMIm FcNTf in ACN at a current density of 50 mA·g-1 at 25 °C.
Figure 3-S5. Comparison of the NMR spectra (19F signal) recorded immediately on the positive electrode carbon material after dismounting the cell (0 h) and after leaving the active material for 1.5 h in the NMR.
Figure 3-S6. 1H NMR of of EMIm FcNTf.
Figure 3-S7. 13C NMR of EMIm FcNTf.
Figure 3-S8. 19F NMR of EMIm FcNTf.
Figure 3-S9. DSC profile of EMIm FcNTf. Figure 3-S10. TGA profile of EMIm FcNTf.
List of abbreviations
SCs: supercapacitorsEDLCs: electrochemical double-layer capacitors EDL: electrical double layer
C: capacitance
A: surface area of the electrode
ε: dielectric constant of the electrolyte d: effective thickness of the EDL IHP: inner Helmholtz plane OHP: outer Helmholtz plane CT: total capacitance
Cp: capacitance of positive electrode
Cn: capacitance of negative electrode
Cs: mass specific capacitance
Cv: the volumetric capacitance
V: cell voltage E: energy density P: power density
R: equivalent series resistance of SC
ESPW: electrochemical stability potential window ESR: equivalent series resistance
IL: ionic liquid
SSA: specific surface area PSD: pore-size distribution ACs: activated carbons
CDCs: carbide-derived carbons PANI: polyaniline
PPy: polypyrrole
CNTs: carbon nanotubes ACNTs: aligned CNTs
LBL: layer-by-layer
EPD: electrophoretic deposition CVD: chemical vapor deposition rGO: reduced graphene oxide PANI: polyaniline
PTh: polythiophene ACN: acetonitrile PC: propylene carbonate
TEABF4: tetraethylammonium tetrafluoroborate
MD: molecular dynamics DFT: density functional theory MC: Monte Carlo
NMR: nuclear magnetic resonance
EQCM: electrochemical quartz-crystal microbalance SANS: small angle neutron scattering
IM: imidazolium EMIM: 1-ethyl-3-methylimidazolium BMIM: 1-butyl-3-methylimidazolium BF4-: tetrafluoroborate PF6-: hexafluorophosphate TFSI or NTf2: bis(trifluoromethanesulfonyl)imide FSI: bis(fluorosulfonyl)imide DCA: dicyanamide OTf: trifluoromethanesulfonate
[Pyr14][TFSI]: N-butyl-N-methylpyrrolidinium bis(trifluoromethanesulfonyl)imide
[Me3S][TFSI]: trimethylsulfonium bis(trifluorosulfonyl)imide
[PIP13][FSI]: propylpiperidinium bis[fluorosulfonyl]imide
EC: ethylene carbonate DMC: dimethyl carbonate DAIM: diallylimidazolium DMF: dimethylformamide
SPE: solid polymer electrolyte GPE: gel polymer electrolyte PEO: poly ethylene oxide PVA: poly vinyl alcohol HQ: hydroquinone MB: methylene blue PPD: p-phenylenediamine
[FcMIM][NTf2]: 1-(methylferrocenyl)-3-ethylimidazolium bis(trifluoromethanesulfonyl)imide
[EMIM][FcNTf]: 1-ethyl-3-methylimidazolium ferrocenylsulfonyl-(trifluoromethylsulfonyl)-imide
AQ: anthraquinone
TEMPO: 2,2,6,6-tetramethylpiperidinyl-1-oxyl DMSO: dimethyl sulfoxide
DSC: differential scanning calorimetry TGA: thermal gravimetric analysis PTFE: polytetrafluoroethylene PVDF: polyvinylidene fluoride WE: working electrode
CE: counter electrode MAS: magic-angle spinning
Pyr13TFSI: 1-methyl-1-propylpyrrolidinium bis(trifluoromethanesulfonyl)imide
SS-NMR: solid-state NMR RILs: redox-active ionic liquids IR: infrared spectroscopy
Acknowledgements
First of all, I would like to express my sincere gratitude to my supervisor, Prof. Dominic Rochefort, for the tremendous support of my Master’s study and research, for the patient guidance, encouragement and advice throughout my study time. I have been extremely lucky to have him as supervisor for my Master’s study.
I would also like to thank all professors and staff at Department of Chemistry who ever helped me in any aspects. In particular I would like to thank Cedric Malveau and other staff in the NMR laboratory, who trained me how to use the solid-state NMR and gave lots of helpful suggestions for the NMR measurements.
All members in Prof. Dominic Rochefort’s group helped me a lot in both study and personal time. I appreciate the friendships we constructed and good advice and collaboration they generously provided. I had a good time to work with all of them.
In regards to financial support, I would like to thank the Natural Sciences and Engineering Research Council of Canada (NSERC), for providing the funding which allowed the completion of this work.
Finally, I must express my gratitude to my family, for their continued support and encouragement. I am grateful for the patience of my parents who experienced all of the ups and downs of my research.
Chapter 1 Introduction
The need to develop and scale up sustainable, clean and efficient energy sources as well as new technologies associated with energy conversion and storage is being given worldwide urgent priority due to the accelerating depletion of existing fossil fuel reserves and the affiliated environmental problems, e.g., increased greenhouse gas emissions and general air and water pollution. Among various areas of application, lithium-ion batteries, fuel cells and supercapacitors (SCs) are at the forefront as the most effective and practical energy conversion and storage devices.
SCs, also known as ultracapacitors or electrochemical capacitors, have drawn great attentions as promising next-generation power sources to fill the gap between electrolytic capacitors and batteries. They offer advantages such as a higher energy density than electrolytic capacitors, a higher power density induced by a fast charge/discharge rate (within several seconds or several minutes) and a longer cycle life (>100 000 cycles) when compared to batteries and fuel cells. Figure 1-1 illustrates a Ragone plot for the most important energy storage systems.1 Currently, SCs have attracted considerable interest in a wide variety of
applications such as portable electronics, electric or hybrid electric vehicles, aircrafts and smart grids. For example, in the case of both electric and hybrid vehicles including fuel cell ones, SCs could serve as an intermediate power source for short-term acceleration and recovery of energy during breaking, thus saving energy and protecting the battery from the high-frequency rapid discharging and charging process.2
Figure 1-1. Ragone chart showing specific power vs. specific energy of various energy storage systems. Reprinted from Wikipedia (https://en.wikipedia.org/wiki/Supercapacitor).
1.1 Fundamentals of supercapacitors
A SC consists of two electrodes in contact with an electrolyte solution isolated by a separator. According to the charge storage mechanism, SCs can be briefly classified as electrochemical double-layer capacitors (EDLCs), pseudocapacitors or hybrid-capacitors.3
Figure 1-2. Schematic diagram of (A) an electrostatic capacitor, (B) an electrical double-layer capacitor, (C) a pseudocapacitor, and (D) a hybrid-capacitor. Reprinted from ref. 3.
1.1.1 Electrical double-layer capacitors (EDLCs)
In general, the electrodes of EDLCs are fabricated from nanoscale materials that have a high surface area and a high porosity. Currently, carbon materials that have high surface area are the most popular materials for the electrode of SCs. The energy storage mechanism in EDLCs arises from the electrostatic charge accumulated at the interface between the electrode and the electrolyte. The concept of the electrical double layer (EDL) was first described and modeled by von Helmholtz in the 19th century.4 As schematically illustrated in Figure 1-3a,
the Helmholtz model describes the separation of charge and the formation of two layers of opposite charge at the electrode/electrolyte interface when an electrode is polarized. Under this condition, ions of opposite sign diffuse through the electrolyte to form a condensed layer with a thickness of a few nanometers in a plane parallel to the electrode surface, ensuring charge neutrality. This accumulation of charge is referred to as the electrical double layer. The potential in the vicinity of the electrode decreases when the distance between the ions and the electrode increases. The capacitance of this simplified Helmholtz double layer through reversible ion adsorption on the carbon surface is defined by equation (1):
𝐶 =%&'#$
where A is the surface area of the electrode; ε is the dielectric constant of the electrolyte; and d is the effective thickness of the EDL. Since the simple Helmholtz model does not take into account several factors such as the diffusion of ions in the solution and the interaction between the dipole moment of the solvent and the electrode, Gouy and Chapman5,6 proposed a diffuse
layer model to consider a continuous distribution of electrolyte ions (both cations and anions) in the electrolyte solution driven by thermal motion, in which the potential decreases exponentially from the electrode surface to the bulk solution (see Fig. 1-3b). However, a serious problem with the Gouy–Chapman model is the overestimation of the EDL capacitance. The capacitance of two separated arrays of charges increases inversely with their separation distance, hence a very large capacitance value would arise in the case of point charge ions very closely approaching the electrode surface. In 1924, Stern7 suggested a model combining
the Helmholtz and Gouy–Chapman model by accounting for the hydrodynamic motion of the ionic species in the diffuse layer and the accumulation of ions close to the electrode surface. The Stern model explicitly states two regions of ion distribution—the compact Helmholtz layer (Stern layer) and the diffuse layer (see Fig. 1-3c). By introducing the compact layer closest to the electrode, the problem of a far too high capacitance that arises in the Gouy– Chapman treatment is automatically avoided. In the compact layer, ions are strongly adsorbed by the electrode and Grahame made an important distinction between an inner and an outer Helmholtz layer in the interphase which corresponds to different distances of closest approach to the electrode surface. The inner Helmholtz plane (IHP) refers to the distance of closest approach of specifically adsorbed ions and the outer Helmholtz plane (OHP) refers to that of (1)
the non-specifically adsorbed ions. The OHP is also the plane where the diffuse layer begins. The diffuse layer is what the Gouy–Chapman model defines, where the non-specifically adsorbed ions are distributed in a three-dimensional region because of thermal agitation in the solution.
Figure 1-3. Models of the electrical double layer at a positively charged surface: (a) the Helmholtz model, (b) the Gouy–Chapman model, and (c) the Stern model, showing the inner Helmholtz plane (IHP) and the outer Helmholtz plane (OHP). d is the double layer distance described by the Helmholtz model. ψ0 and ψ are the potentials at the electrode surface and the
electrode/electrolyte interface, respectively. Reprinted from ref. 16.
1.1.2 Pseudocapacitors
The charge physically stored in a porous electrode by the accumulation of electrostatic charge at the electrode/electrolyte interface is unfortunately limited and therefore EDLCs have a limited specific capacitance and a low energy density. Advanced approaches to increase the energy density of SCs are to hybridize the electrode materials by adding electrochemically active materials to the carbon materials or to completely replace the carbon materials with
electrochemical-active materials. Alternatively, the introduction of redox-active electrolyte by dissolving electroactive species in the electrolyte or using electroactive species solely as the electrolyte is also a means to increase the energy density. SCs with electrochemical-active materials as the electrodes or electrolyte are called faradaic supercapacitors or pseudocapacitors. Pseudocapacitors not only store charges in the EDL, but also undergo fast and reversible redox reactions (faradaic reactions) on the electrode surfaces. Pseudocapacitors generally providing greater pseudocapacitances (10–100 times the capacitance in conventional EDLCs) are highly desirable as the next generation of SCs. The most commonly known redox-active species for the electrodes of pseudocapacitors are several transition metal oxides, including RuO2, MnO2, Co3O4,8-10 conducting polymers such as polyaniline11, and carbon
materials functionalized with oxygen or nitrogen heteroatoms12. The redox-active electrolytes
include electrolytes mixed with redox-active species such as iodine, bromine, hydroquinones.13-15
1.1.3 Hybrid supercapacitors
Hybrid SCs refer to the one using both the electrical double-layer (EDL) and faradaic mechanisms to store charges. There are two different types of hybrid supercapacitor systems, which can be distinguished by their electrode configurations: asymmetric (e.g. one electrode consists of electrostatic carbon material while the other consists of pseudocapacitive material) and battery-type (e.g. combination of a supercapacitor electrode with a lithium-ion battery electrode). With a correct electrode combination it is possible to increase the cell voltage, which in turn leads to an improvement in the energy density of SCs.
1.2 Technical specifications of supercapacitors
In this section, I will introduce briefly several parameters such as capacitance, energy density, power density, etc., which are very important factors for discussing and evaluating the supercapacitors.
1.2.1 Capacitance
As shown in Fig. 1-2b, the entire SC can be treated as two capacitors in series since both electrode/electrolyte interfaces represent a capacitor. Hence the total capacitance (CT) can
be expressed as: 1 𝐶)= 1 𝐶*+ 1 𝐶,
where Cp and Cn are the capacitances of the positive and negative electrodes, respectively. For
a symmetric SC, since Cp = Cn, the total capacitance (CT) would be half of either electrode’s
capacitance. In the case of the asymmetric SC, CT is mainly dominated by the electrode with
the smaller capacitance. To evaluate the capacitance of an electrode material, a specific capacitance is often used, which can be expressed either as the mass specific capacitance (also called gravimetric specific capacitance) (Cs), or the volumetric capacitance (Cv). Generally, Cs
is the most frequently used one to characterize an electrode material, with units of Faraday per gram (F·g-1). A comparison between different electrode materials can be made based on their
values of Cs.
1.2.2 Energy density and power density
When a SC is charged, a cell voltage V builts up across the two electrodes. The stored energy E (Wh), also called the energy density, in a supercapacitor is given by equation (3):16
𝐸 =1 2𝐶)𝑉0
in which CT is the total capacitance of the cell. The maximum power density P (W) is given by
equation (4): 16
𝑃 = 1 4𝑅𝑉0
where R is the equivalent series resistance of the SC. The energy and power densities normalized by the weight of the device or the electrode provide a basis for comparison between devices, especially from an application point of view. As the two equations show, V, (2)
(3)
CT and R are three important variables determining the performance of a SC. In order to
improve both the energy density and power density of a SC, increasing the values of both V and CT and simultaneously reducing the value of R are desirable. Since both the energy
density and power density are proportional to the square of the operating voltage, an increase of cell voltage would have a greater contribution to the improvement of the energy density and power density of a SC than increasing the capacitance or reducing the resistance. Generally, the maximum operating voltage of a SC is strongly dependent on the electrochemical stability potential window (ESPW) or the potential window of the electrolyte. Alternatively, the normalization of energy density and power density can also be carried out by the device volume (m3) rather than the mass (kg) to provide a comparison for the compact devices.
1.2.3 Equivalent series resistance (ESR)
The ESR (Ω) is composed of the intrinsic resistance of the electroactive materials, contact resistance between the electroactive materials and the current collector, diffusion resistance of ions in the electrode materials and through the separator, and ionic resistance of electrolytes. It is an important parameter for determining the SC’s power density as indicated by equation (4), which indicates that the power density increases with a decreasing ESR value. Similar to other electrochemical energy storage devices, a high ESR limits the charging/discharging rate, leading to a low power density. Therefore, for some pulse power applications, the ESR value of a SC is even more important than the capacitance value. Normally, ESR is the sum of resistances including the intrinsic resistance of the electrode material, the ionic resistance of the electrolyte and contact resistance between the current collector and the electrode.16 As identified, the resistances of the bulk electrolyte solution and
the electrolyte inside the electrode pores tend to dominate the ESR, especially when non-aqueous electrolytes such as organic, ionic liquid (IL) and solid-state electrolytes are used in the SCs. Therefore, in order to achieve a high power density for a SC, it is necessary to use an electrolyte with high ionic conductivity. However, there is often a trade-off between the ionic conductivity and the operating potential window of the electrolyte. In general, aqueous electrolytes, such as H2SO4 and KOH, have high ionic conductivities, but low operating
potential windows. In contrast, although non-aqueous electrolytes such as organic and IL can offer high operating voltages, their ionic conductivities are generally at least one order of magnitude lower than those of the aqueous electrolytes,17 leading to a higher ESR, and thereby
limiting the power density. Therefore, to achieve both high energy and power densities for SCs, it is essential to develop electrolytes with a wide operating voltage and a small ESR (or high ion conductivity).
1.2.4 Cycle-life
Cycle-life, an indicator of the stability of SC, is also one of the important parameters for evaluating the overall SC performance. General test procedures for stability analysis involve the electrode undergoing charge and discharge cycling in a certain electrolyte to compare the initial and final capacitance. EDLCs using carbon electrodes generally have a very high cycling stability.18 However, when pseudocapacitive reactions are introduced, the
cyclic stability is generally reduced due to the non-ideal electrochemical reversibility resulting from the interactions between the electrolyte ions and the electrode materials. Actually, the cycle-life of SCs depends on many factors such as the cell type, the electrode material, the electrolyte, the charge/discharge rate, the operating voltage and the temperature.
1.2.5 Self-discharge rate
Another issue concerning the SC performance is the self-discharge rate, which is related to the potential losses of a charged electrode over a period of storage time.19 During the
self-discharge process, current leakage leads to a decrease of the cell voltage, which may limit the use of SCs for some applications requiring a fixed amount of energy retention. The SC self-discharge rate and its mechanism are dependent on the type of electrolyte, impurities and residual gases.
1.2.6 Thermal stability
Currently most applications of SCs are achieved in the temperature range of -30 to 70 °C.20 Expanding the working temperature range of SCs can further widen the scope of the
applications of SCs. For example, most space avionics applications are required to operate at temperatures as low as -55 °C.20 Fuel cell vehicles, on the other hand, may require a higher
working temperature. In addition, the working temperature can affect several properties of SCs such as the energy and power densities, ESR, cycle life and self-discharge rate. The performance of temperature-dependent SCs is strongly dependent on the nature of the electrolyte, e.g. the concentration, the type of conducting salt and the property of solvent.
1.3 Electrodes of supercapacitors
The capacitance and charge storage of SCs intimately depend on the electrode materials used. Therefore, further developing new materials with high capacitance and improved performance relative to existing electrode materials is one of the most critical aspects in the development of SCs. In general, the electrode materials of SCs can be categorized into three types: (1) carbon materials with high specific surface area, (2) conducting polymers, and (3) transition metal oxides and hydroxides.3
1.3.1 Carbon-based materials
Carbon materials store charges mainly in an electrochemical double layer formed at the interface between the electrode and the electrolyte. Therefore, the capacitance predominantly depends on the surface area accessible to the electrolyte ions. The important factors influencing their electrochemical performance are the specific surface area (SSA), pore size distribution (PSD), pore structure and electrical conductivity.1,21 The general rule for selecting
carbon materials as the SC electrode is to obtain a high accessible specific surface area with good electrical conductivity. Table 1-1 shows examples of different carbon structures that have high SSA and high conductivity and can be used as SC electrodes.215
Table 1-1. Different carbon structures used in EDLCs with onion-like carbon, carbon nanotubes, graphene, activated carbon, carbide-derived carbon and templated carbon. Reprinted from ref.215.
Based on equation (1), it is usually anticipated that the larger the SSA, the higher the capacitance. Initial research on carbon materials was directed towards significantly increasing the pore volume by developing materials with large SSA. However, the increase in capacitance is relatively limited because not all micropores of the carbon material are electrochemically accessible to form an electrical double layer when they are immersed in electrolyte. It has been demonstrated that there is no linear relationship between the SSA and the capacitance, i.e., the capacitance of various carbon materials does not increase linearly with SSA. Despite the SSA of activated carbons (ACs) being as high as 2500–3000 m2·g−1,
only a relatively small Cs < 10 μF·cm−2 was obtained compared to the theoretical value (15–25
μF·cm−2).22 On the contrary, activated carbon fibers with a SSA of only 1000 m2·g−1 exhibit
an extremely high capacitance corresponding to that of the conventional ACs with a SSA of 3000 m2·g−1. 23
Efforts have been made to study the relationship between the pore size of porous carbon materials and their capacitance performance. An adequate pore size is more important than a high surface area for achieving high values of capacitance, and the optimal pore sizes are found to be 0.7 and 0.8 nm in aqueous and organic media, respectively.24 Moreover, J.
Chmiola et al. demonstrated that carbide-derived carbons (CDCs) with a pore size of 0.8–1.0 nm exhibit an anomalous increase in capacitance due to the desolvation of ions upon entering the micropores (Figure 1-4a).25,26 These observations indicate that the micropores
electrochemically accessible to the electrolyte ions to form an electrical double layer have a significant effect on the capacitance value. Largeot et al. have experimentally determined the relationship between the electrolyte ion size and the pore size of CDCs when no solvent is present in the system and concluded that the maximum EDL capacitance is achieved when the pore size is very close to the electrolyte ion size (Figure 1-4b).21 Both larger and smaller pores
lead to a significant decrease in capacitance. This phenomenon was also verified in aqueous electrolyte in a recent study conducted by the same group.27 These interesting findings
challenged the conventional view that only those pores larger than the size of solvated electrolyte ions are capable of forming a double layer and contributing to the charge storage due to the ion sieving effect. The above observations have only been reported for special carbon materials. Thus, the relationship between pore size and capacitance should be thoroughly investigated both theoretically and experimentally, which is beneficial for designing advanced carbon materials with optimal pore structure and maximized electrochemical performance.
Figure 1-4. (a) Plot of normalized specific capacitance versus average pore size shows that capacitance decreases with decreasing pore size until a critical value was reached, unlike the traditional view which assumed that capacitance continually decreased. Reprinted from ref. 25. (b) Normalized capacitance change versus the pore size of the CDC samples; inset shows HyperChem models of the structure of EMIM and TFSI ions. Reprinted from ref. 27.
1.3.1.1 Activated carbons (ACs)
ACs are the most widely used electrode materials due to their large surface area, relatively good electrical properties and low cost. ACs are generally produced by creating a three-dimensional porous network through either physical (thermal) or chemical activation of various types of carbonaceous materials (e.g. coal, wood, nutshell, etc.). Physical activation usually refers to the treatment of carbon precursors at high temperature (from 700 to 1200 °C) in the presence of oxidizing gases such as steam, CO2 and air. Chemical activation is usually
carried out at lower temperature (from 400 to 700 °C) with activating agents like phosphoric acid, potassium hydroxide, sodium hydroxide and zinc chloride. Depending on the activation methods as well as the carbon precursors used, ACs possessing various physicochemical properties with well-developed SSA as high as 3000 m2·g-1 have been produced.22,24,28,29,31-33
(b) (a)
In addition to SSA, pore-size distribution (PSD) is also an important parameter affecting the electrochemical performance of ACs. In general, a narrow PSD gives an increase in surface area of regular pore distributions compared with a broad PSD, leading to an increase in capacitance and energy density,35 which means that monodispersed pores and elaborately
optimized PSD would be an ideal choice for the electrode material of SCs.36 In addition,
Kondrat et al. demonstrated that the optimal pore size that provides the maximal energy density increases with increasing operating voltage and saturates at high voltages.36
The initial carbon precursors have an important impact on the SSA and the electrochemical performance. The most commonly used precursors for commercial AC production include petroleum coke, pitch and coal.37-40 Depending on different activation
conditions, a variety of ACs with different SSAs of 900–3500 m2·g−1 and Cs of 200–350 F·g−1
in aqueous electrolytes and 130–220 F·g−1 in non-aqueous electrolytes have been produced.
Given the limitation of fossil fuel resources, plenty of biomass-derived ACs have attracted attention during the past few years. ACs are widely prepared from various natural precursors, such as nutshells41-43, seaweeds44-45, woods41,46, corn grains47, saccharides48,49, etc.
Unfortunately, ACs derived from natural precursors usually have significant difference in terms of their properties, which is seriously detrimental for the use of SCs especially in the automotive field. Thus, various synthetic polymers such as phenol formaldehyde resins50,
polystyrene-based resins51, polyfurfuryl alcohols52, polyaniline (PANI)53 and polypyrrole
(PPy)54 have generated considerable interest and explored as promising alternative precursors
in recent years due to their low cost, commercial availability, uniform structure and high purity. Yan et al. synthesized an AC by the carbonization of rod-shaped PANI and subsequent KOH activation, showing a high Cs of 455 F·g−1 and a remarkable rate capability due to its
high SSA of 1976 m2·g−1, narrow PSD (<3 nm) and short diffusion length.53 Wei et al.
prepared an AC from PPy using a one-step KOH activation process.54 The as-produced AC
possesses 0.5–4 nm pores with a pore volume of 2.39 cm3·g−1 and ultrahigh SSA up to 3432
m2·g−1, leading to a high C
s of 300 F·g−1 in ionic liquid at 60 °C, which is more than a
two-fold improvement compared to commercial ACs and other reported novel carbon materials. Moreover, activation methods and conditions also play significant roles in the porosity and electrochemical performance of ACs. Due to lesser extent of carbon etching than chemical
activation, ACs prepared by physical activation processes usually have relative low SSA (680–2420 m2·g−1) and pore volume, and low C
s (33.7–206 and 56–172 F·g−1 in aqueous and
non-aqueous electrolytes, respectively).41,42,55 With regards to the chemical activation,
activation conditions such as the activation temperature, activation time and mass ratio of activation agent and precursor are key factors affecting the yield, SSA and pore structure of ACs, which accordingly affect their capacitive performances.54,56-58 Typically, a high
activation temperature, long activation time and large mass ratio of activation agent and precursor lead to enhanced SSA, pore volume and average pore size.54,59 However, excessive
activation will result in large pore volume, low electrical conductivity and corresponding loss of power delivery and low volumetric energy density.
Furthermore, surface functionalities also have an important influence on the electrode performance. The surface functionalities may induce faradaic reactions, contributing some additional capacitance to the total capacitance.45,57,60,61 Carbon with high oxygen content
prepared by the pyrolysis of seaweed for supercapacitors exhibited a Cs of 125 F·g−1 and a
high energy density of 10.7 Wh·kg−1 with a cell voltage of 1.6 V.62 However, the presence of
surface functionalities or moisture generally gives rise to a poor electrode stability during cycling, an increase in the series resistance, an increase in the leakage current, the decomposition of the organic electrolyte and the deterioration of capacitance.63 Thus, surface
chemistry of ACs should be elaborately optimized to enhance the long-term cycling stability. Nowadays, a variety of ACs produced through physical or chemical activation from various precursors are the most extensively used electrode materials for commercial supercapacitors. Nevertheless, their practical applications are still limited to some extent as the energy density is still relative low and the control of PSD and pore structure is still challenging. Therefore, it is of great importance to design and produce ACs with elaborately designed PSD, minimized pore tortuosity, interconnected pore structure, short pore length and controlled surface chemistry in order to facilitate the ion transport and enhance the energy storage without sacrificing their power capability and cycle life.
1.3.1.2 Carbide-derived carbons (CDCs)
CDCs are produced by the extraction of non-carbon atoms from carbides (TiC, B4C,
ZrC, Ti3SiC2, Ti2AlC and SiC) by the reaction:
𝑀𝐶 + 𝑛𝐶𝑙0 → 𝑀𝐶𝑙0,+ 𝐶(𝑠)
This method allows the synthesis of micro- and mesoporous carbons with SSA of 1000-3000 m2·g−1 and controlled pore size, since porosity is formed by leaching out
non-carbon atoms M from the crystal structure of the carbide precursor.64-68 For example, V.
Presser et al. reported the synthesis of TiC-CDC with a narrow PSD having a mean value that is tunable between 0.6 and 1.1 nm by changing the synthesis temperature.64
The adverse effect of the micropores in CDCs is the relatively slow ion transport in small pores and thus a moderate rate of charge and discharge, seriously limiting their power storage. One strategy to mediate this limitation is to develop hierarchical porous CDCs with straight ordered mesopores.67,69 Ordered mesoporous channels are favorable for the insertion
and retention of the electrolyte ions, and can serve as highways for fast ionic transport. Meanwhile, the micropores on the mesopore walls can increase the SSA, providing more sites for charge storage. M. Rose et al. demonstrated a SC with CDC electrode exhibiting not only a very high Cs of ≈ 202 F·g−1 in aqueous electrolyte, but also an exceptionally high power
performance with up to 90% of the capacitance retained when the current density was increased from 0.1 to over 20 A·g−1 due to the presence of straight mesoporous channels
combined with a high micropore content in CDC.69
From an academic point of view, CDCs are very important material for study as they can provide valuable information about the effect of pore size, channel structure, and other parameters on ion diffusion and charge storage in carbon nanomaterials. However, CDCs still have very limited commercial potential due to their high cost, serious safety and environmental concerns associated with their production.
1.3.1.3 Carbon nanotubes (CNTs)
CNTs that are one-dimensional carbon materials, have been extensively studied for EDLC applications due to their excellent electrical conductivity, unique pore structure, exceptional mechanical, chemical and thermal stability.34,35 However, the C
s of CNTs is
generally low due to the limitation of their SSA (less than 600 m2·g−1).30 Intriguingly,
although the surface area of CNTs is relatively moderate, their area Cs can reach up to 50.4
μF·cm−2, which is higher than those of ACs (20–50 μF·cm−2) owing to the low density and the
perfect electrolyte accessibility by the entanglement of CNTs.30 On the other hand, carbon
nanotubes can serve as excellent substrates for electrode composites by decorating or coating the CNT surface with a thin film of redox materials for improvement of conductivity and cell performance.70
Over the past decade, there are considerably increasing interests in flexible and lightweight energy-storage systems to meet the demands for portable electronic devices. Recently, CNTs have been printed on plastics, papers or coated on textiles to fabricate thin and flexible SCs.71-73 In the electrodes of these SCs, CNTs not only act as highly conductive
and flexible active materials, but also play a role in increasing the effective surface area of the films to maximize the efficiency of thin film SCs. Z. Q. Niu et al. reported a compact-designed SC fabricated using large-scale, free-standing and flexible single-walled CNT films as both the anode and cathode, which exhibited a high energy density (≈43.7 Wh·kg−1) and a power
density (≈193.7 kW·kg−1) due to small internal resistance.71 K.-H. Choi et al. have
demonstrated a stretchable and wearable SC using SWNTs coated textiles as electrode, exhibiting a high Cs of 140 F·g−1and an extraordinary energy density of 20 Wh·kg−1 at a
specific power of 10 kW·kg−1 in 1 mol·L−1 LiPF
6 electrolyte, and showing an extremely good
cycling stability with only 2 % variation in capacitance over 130 000 cycles.73
Moreover, aligned CNTs (ACNTs) have aroused particular interests in SC applications due to their advantages over randomly entangled CNTs.74-76 ACNTs have relatively regular
pore structures and conductive channels, leading to higher effective SSA, facilitating fast ion and electron transportation and providing improved charge storage abilities, which is highly desirable in high power required applications. A. Izadi-Najafabadi et al. fabricated electrodes for SCs from vertically ACNTs with near-ideal SSA (1300 m2·g−1), which could operate at a
high voltage (4 V) while maintaining durable full charge-discharge cyclability with an energy density (94 Wh·kg−1, 47 Wh·L−1) and power density (210 kW·kg−1, 105 kW·L−1), far
exceeding those of AC SCs both gravimetrically and volumetrically.74 The ordered pore
structure of SWNT electrodes have a lower tortuosity, facilitating fast ion transport and thus higher power capability.
Due to the fact that the power performance would be seriously limited by the large contact resistance between active materials and current collector, various methods have been employed to reduce the internal resistance of CNT electrodes in order to obtain high power capabilities. An effective approach is to assemble binder-free CNT films, which can be realized through layer-by-layer (LBL) assembly77,78 and electrophoretic deposition (EPD)79.
LBL CNT electrodes were demonstrated ultrahigh capacitance of 160 F·g−1 in 1 M H2SO4,
which is extremely higher than those of ACNTs and conventional CNTs.78 Compared to LBL
assembly methode, EPD is a relatively quick means to fabricate CNT films, which usually uses an oppositely charged metal current collector to attract CNTs in CNT suspension by the effect of electrostatic attraction.79 This method has several advantages including short
assembly time, simple equipments and applicability for large-scale production. Another promising approach to reduce the internal resistance of CNT electrodes is direct growth of CNTs on conductive substrates, such as graphite foil80, aluminum81, Au82 and metallic alloy83.
This approach minimizes the contact resistance between the active material and the current collector and greatly simplifies the electrode fabrication process.
Despite of these tremendous achievements, a number of issues in CNTs including limited SSA, unnegligible impurities and high production cost still need to be addressed in order to further promote the industrial application of CNTs.
1.3.1.4 Graphene
Graphene is one-atom-thick two-dimensional layer of sp2-bonded carbon. Because of
high SSA of 2,630 m2·g−1 and extraordinary theoretical capacitance of 550 F·g-1, graphene has
great opportunity to replace the traditional carbon materials such as ACs in SCs.34 Various
strategies. In general, top-down strategy is mainly based on the exfoliation of graphite, including micromechanical cleavage, oxidation-exfoliation-reduction, intercalation exfoliation and solid exfoliation (e.g., ball milling).84 Bottom-up strategy includes organic synthesis from
small structurally-defined molecules (e.g., polyphenylene85) and chemical vapor deposition
(CVD)86. Notably, the graphene products vary distinctly in terms of number of layers, sizes,
functional groups, wrinkles, defects (inplane holes or heteroatom doping) and shapes (e.g., graphene nanoribbons) depending on synthesis methods, which could be remarkably reflected by huge differences in apparent properties (e.g., SSA and density) and electrochemical performance of electrochemical energy storage devices. For instance, mechanically exfoliated graphene sheets possess perfect crystallinity but void of abundant defects. The as-produced graphene exhibits a low sheet resistance of around 400 Ω·sq-1 at room temperature87, much
higher than that of reduced graphene oxide (rGO) sheets produced by wet chemical routes, in which many defects and oxygen containing functional groups are left in the graphene sheets, therefore resulting in low conductivity88.
Restacking of graphene sheets during preparation that causes substantial ionic resistance for the electrode is a crucial issue to avoid. To minimize the aggregation, a number of efforts have been made, including incorporating spacers (e.g., metal nanoparticles91,92,
oxide/hydroxide nanoparticles93-96, water molecule97, conducting polymers98,99, carbon
nanomaterials100-102), preparation of porous or crumpled graphene sheets103-105 and activation
of graphene106,107. These attempts not only greatly enhance the electrochemical utilization of
graphene layers but also facilitate the diffusion and migration of electrolyte ions.
Because of the fluffy state of the graphene sheets, the packing density of common graphene electrodes is rather low (from 0.05 to 0.75 g·cm-3), which would result in low
volumetric energy density.89 By simply compressing graphene sheets electrode material,
volumetric capacitance and energy density would be enhanced.214 Notably, ion diffusion could
be not efficiently achieved in most compact graphene materials due to limited channels for efficient diffusion and transport of electrolyte ions, leading to a low volumetric capacitance. Therefore, rational design of porous structures in compact graphene-based film electrode is of importance for achieving high volumetric capacitance. Taking advantage of intrinsic microcorrugated 2D configuration and self-assembly behavior of rGO, Yang et al.89
demonstrated the fabrication of rGO electrodes by capillary compression of adaptive graphene gel films in the presence of a nonvolatile liquid electrolyte. This soft approach enables subnanometer scale integration of graphene sheets with electrolytes to form highly compact carbon electrodes with a continuous ion transport network. The SCs based on the resulting liquid electrolyte-mediated rGO film electrode can achieve a high volumetric energy density of 60 Wh·L-1. Tao et al.90 developed a highly dense but porous graphene-based monolithic
carbon by adding zinc chloride during capillary drying of graphene hydrogel, the SSA of the monolithic graphene was tuned from 370 to over 1,000 m2·g-1, while the monoliths still
maintained high density from 1.6 to 0.6 g·cm-3. Having a good balance of porosity and
density, the directly sliced graphene pellet electrode with a thickness up to 400 μm delivered a capacitance of 150 F·cm3 in an ionic liquid electrolyte, corresponding to a volumetric energy
density of ~65 Wh·L-1 in a symmetric SC, which was among the highest value reported to
date for SCs.
1.3.2 Pseudocapacitive materials
As mentioned above, materials based on EDL mechanism have limited specific capacitance. SCs made of redox-active materials bearing greater pseudocapacitance are highly desirable as the next generation of SCs.108 They not only store charges in the double layer as a
conventional supercapacitor electrode does, but also undergo fast and reversible surface redox reactions (faradaic reactions). Therefore, considerable efforts have been devoted in recent years to develop electrode materials with pseudocapacitance. This kind of material is generally classified into two types: conducting polymers and electroactive metal oxides/hydroxides.
1.3.2.1 Metal oxides/hydroxides
In general, metal oxides/hydroxides can provide a higher energy density in SCs than conventional carbon materials and a better electrochemical stability than polymer materials. To date, the investigated metal oxides/hydroxides include RuO2, MnO2, Co3O4, Co(OH)2,NiO,
1.3.2.1.1 RuO2
Among various transition metal oxides, RuOx is the most extensively studied candidate
due to its wide potential window, highly reversible redox reactions, three distinct oxidation states accessible within a 1.2 V voltage window, high proton conductivity, extraordinary high specific capacitance, good thermal stability, long cycle life, metallic-type conductivity and high rate capability.109-110 With RuO
2 electrodes, EDL charging only contributes to about 10%
of the accumulated charge, in the meantime with the occurance of redox pseudocapacitance mechanism. The pseudocapacitive behaviors of RuO2 in acidic and alkaline media involve
different reactions, which accordingly present different sensitivities toward crystallinity. For example, amorphous RuO2 materials in the H2SO4 electrolyte showed a maximum Cs of 720
F·g-1 upon calcination at 150 °C.111 For a crystalline state of RuO
2 in a KOH electrolyte, a
maximum capacitance of 710 F·g-1 was achieved by calcinating at 200 °C.112 The
corresponding mechanisms have been demonstrated to be as follow. In an acidic solution, rapid reversible electron transfer is accompanied by the electroadsorption of protons on the surface of RuO2 particles, where Ru oxidation states can change from Ru (Ⅱ) to Ru (Ⅳ).3,113
However, in an alkaline solution, the changes in the valency state of RuO2 are quite different.
The ruthenium is oxidized to RuO42-, RuO4- and RuO4 on charging and these high valency
state compounds are reduced to RuO2 upon discharging.199
It has been demonstrated that the Cs of RuO2 strongly depends on several factors,
including the SSA, the crystallinity, the combined water in RuO2 as well as the electrolyte.
Owing to the pseudocapacitance of RuO2 arising mainly from the surface reaction, high SSA
can provide more active sites to participate in redox reactions, resulting in high Cs. Thus,
several approaches such as depositing RuO2 films on various substrates with rough surface,
coating thin RuO2 films on high SSA materials and synthesizing nanoscaled RuO2 particles,
have been explored toward enhancing the SSA of RuO2.114-116 Amorphous RuO2 thin films
deposited on stainless steel substrates by anodic deposition showed stable electrochemical performance with a maximum Cs of 1190 F·g−1 in H2SO4 electrolyte.116 An amorphous RuO2
usually exhibits remarkable electrochemical performance as the redox reaction takes place (6)
both on the surface and in the bulk. RuO2 with high crystallinity is unfavorable for the
transport and diffusion of protons, resulting in large diffusion resistance.108 Moreover, the
combined water in RuO2 allows the diffusion of cations inside the electrode layer by hopping
of alkaline and H+ ions between H
2O and OH− sites.108 Hydrous RuO2 (RuO2·0.5H2O) showed
a Cs as high as ≈900 F·g−1, which was more than 1000 times greater than that of anhydrous
RuO2 (0.75 F·g−1).117 Furthermore, the used electrolyte (acid/base and concentration) also has
a significant impact on the electrochemical performance of RuO2.3
Despite the high Cs and excellent rate capability of amorphous hydrous RuO2, the
relatively high cost, low abundance and environmental concerns seriously prohibit its further commercialization for SCs. Recent years, considerable efforts have been devoted to exploit relative cheap and environmentally benign materials that exhibit similar electrochemical behavior to that of RuO2 as alternative candidates to RuO2, such as MnO2, NiO, Co3O4, V2O5,
etc.118-121
1.3.2.1.2 MnO2
MnO2 as a highly promising alternative to RuO2 has attracted enormous attentions as
electrode materials for SCs due to its high theoretical Cs (≈1100 F·g−1), low cost, abundance
and environmentally friendly nature. In general, pseudocapacitive charge storage of MnO2 in
an aqueous electrolyte takes place via the redox of Mn between the +4 and +3 oxidation states at the surface or in the bulk.122 Nevertheless, MnO2 does not possess the high electronic
conductivity as that of RuO2 (104 S·cm-1 for bulk single crystal). Depending on the crystal
structure, the conductivity of MnO2 ranges from 10-7 to 10-3 S·cm-1.123 As a result, charge
storage in MnO2 occurs within a thin layer of the surface.122 This corresponds to a
significantly lower capacitance values than the theoretical value for thick composite electrodes, where typical Cs ranges between 200 and 250 F·g-1. On the other hand, it has been
shown that ultrathin films of MnO2 can achieve a Cs of >1000 F·g-1 122, indicating that
nanostructuring is a highly effective method for accessing all of the MnO2 storage sites. To
overcome the poor electrical conductivity, several advanced methods have been widely explored, such as incorporating metal with excellent conductivity into MnO2 or hybridizing