HAL Id: inserm-01397806
https://www.hal.inserm.fr/inserm-01397806
Submitted on 16 Nov 2016
HAL is a multi-disciplinary open access
archive for the deposit and dissemination of
sci-entific research documents, whether they are
pub-lished or not. The documents may come from
teaching and research institutions in France or
abroad, or from public or private research centers.
L’archive ouverte pluridisciplinaire HAL, est
destinée au dépôt et à la diffusion de documents
scientifiques de niveau recherche, publiés ou non,
émanant des établissements d’enseignement et de
recherche français ou étrangers, des laboratoires
publics ou privés.
MSSEG Challenge Proceedings: Multiple Sclerosis
Lesions Segmentation Challenge Using a Data
Management and Processing Infrastructure
Olivier Commowick, Frédéric Cervenansky, Roxana Ameli
To cite this version:
Olivier Commowick, Frédéric Cervenansky, Roxana Ameli. MSSEG Challenge Proceedings: Multiple
Sclerosis Lesions Segmentation Challenge Using a Data Management and Processing Infrastructure.
MICCAI, Oct 2016, Athènes, Greece. 2016. �inserm-01397806�
MSSEG Challenge Proceedings: Multiple
Sclerosis Lesions Segmentation Challenge
Using a Data Management and
Processing Infrastructure
Editors
Olivier Commowick, Frédéric Cervenansky, Roxana Ameli
©MSSEG-2016, 1st MICCAI Challenge on Multiple Sclerosis Lesions Segmen-tation Challenge Using a Data Management and Processing Infrastructure The papers included in this proceedings book were part of the technical challenge cited on the cover. The papers were selected and reviewed by the editors and the organization committee. Some challenge presentations may not be available for publication. The papers published in this proceedings book reflect the work and thoughts of the corresponding authors and are published herein as submitted with minor editorial revisions. Neither the authors, the editors, nor the chal-lenge organizers can accept any legal responsibility for any errors or omissions that may be made. Please use the following format to cite materials from this proceedings book:
<Authors>, <Paper Title>, In: Proceedings of the 1st MICCAI Challenge on Multiple Sclerosis Lesions Segmentation Challenge Using a Data Management and Processing Infrastructure — MICCAI-MSSEG, O. Commowick, F. Cerve-nansky, and R. Ameli (Eds), pp. <Page Numbers>, 2016.
i
Preface
This proceedings book gathers methodological papers of segmentation methods evaluated at the first MICCAI Challenge on Multiple Sclerosis Lesions Segmen-tation Challenge Using a Data Management and Processing Infrastructure. This challenge took place as part of an effort of the OFSEP1(French registry on
mul-tiple sclerosis aiming at gathering, for research purposes, imaging data, clinical data and biological samples from the French population of multiple sclerosis sub-jects) and FLI2 (France Life Imaging, devoted to setup a national distributed
e-infrastructure to manage and process medical imaging data). These joint ef-forts are directed towards automatic segmentation of MRI scans of MS patients to help clinicians in their daily practice. This challenge took place at the MICCAI 2016 conference, on October 21st 2016.
More precisely, the goals of this challenge were multiple. It first aimed at evaluating state-of-the-art and advanced segmentation methods from the par-ticipants on a database following a standard protocol3. For this, both lesion
detection (how many lesions are detected) and lesion segmentation (how pre-cise the lesions are delineated) were evaluated on a multi-centric database (38 patients from four different centers, imaged on 1.5 or 3T scanners, each patient being manually annotated by seven experts from three different French centers, located in Bordeaux, Lyon and Rennes).
This challenge was also the occasion to perform this advanced evaluation on a common infrastructure, provided by FLI. As such, challengers were asked to provide their pipeline as a Docker container image. After integration in the VIP platform4, the challengers pipelines were then evaluated independently by
the challenge organization team, the testing data and evaluation results being queried and stored in a Shanoir database5. This infrastructure enabled a fair
comparison of the algorithms in terms of running time comparison and ensuring all algorithms were run with the same parameters for each patient (which is required for a truly automatic segmentation). These proceedings do not include results of the evaluation, rather the evaluated methods descriptions. Evaluation results are available on the challenge website6from the day of the challenge.
As a conclusion note, the organizers of the challenge are welcoming new pipelines to be evaluated after the challenge itself. Interested teams may go on the challenge website to register their new method and evaluate it on our data. Acknowledgments
This challenge workshop was partially supported by the France Life Imaging national project in France (ANR-11-INBS-006), and by the OFSEP national
1 OFSEP:http://www.ofsep.org
2 FLI:https://project.inria.fr/fli/en/
3 OFSEP acquisition protocol:http://www.ncbi.nlm.nih.gov/pubmed/25660217 4 VIP:http://vip.creatis.insa-lyon.fr
5 Shanoir:http://shanoir.org
ii
project in France (ANR-10-COHO-002). This challenge would also not have been possible without the great work of FLI, OFSEP and VIP engineers, namely: Sorina Camarasu-Pop, Pascal Girard, Florent Leray, Julien Louis, Simon Loury, Aneta Morawin, Mathieu Simon and Yao Yao.
iii
Organization
The challenge was jointly organized by France Life Imaging (for methodological and technical resources) and the OFSEP French national cohort in MS (for data provision and medical expertise). The organization was based on three specific boards: a scientific, technical and clinical committees.
Scientific committee
Christian Barillot CNRS, Rennes, France
Olivier Commowick Inria, Rennes, France
Charles Guttman Brigham and Women’s Hospital, Boston, MA, USA Martin Styner University of North Carolina, Chapel Hill, NC, USA Simon Warfield Children’s Hospital, Boston, MA, USA Technical committee
Frédéric Cervenansky Université Claude Bernard, Lyon, France
Tristan Glatard CNRS, Lyon, France
Audrey Istace OFSEP, Lyon, France
Michael Kain FLI-IAM, Inria, Rennes, France
Baptiste Laurent FLI-IAM, Inserm, Brest, France
Medical committee
Roxana Ameli University Hospital of Lyon, France
François Cotton University Hospital of Lyon, France Jean-Christophe Ferré University Hospital of Rennes, France Thomas Tourdias University Hospital of Bordeaux, France
Table of Contents
Preface
. . . iOrganization
. . . iiiMultiple Sclerosis Lesion Segmentation using an
Automated Multimodal Graph Cut
. . . 1Jérémy Beaumont, Olivier Commowick and Christian Barillot
Automatic Multiple Sclerosis Lesion Segmentation
from Intensity-Normalized Multi-Channel MRI
. . . 9Jérémy Beaumont, Olivier Commowick and Christian Barillot
Automatic Multiple Sclerosis Lesion Segmentation
with P-LOCUS
. . . 17Senan Doyle, Florence Forbes and Michel Dojat
MS Lesion Segmentation using FLAIR MRI Only
. . . 21Jesse Knight and April Khademi
Automatic Multiple Sclerosis Lesion Segmentation
Using Hybrid Artificial Neural Networks
. . . 29Amirreza Mahbod, Chunliang Wang and Örjan Smedby
Nabla-net: a Deep Dag-like Convolutional
Architecture for Biomedical Image Segmentation:
Application to White-Matter Lesion Segmentation
in Multiple Sclerosis
. . . 37Richard McKinley, Tom Gundersen, Franca Wagner, Andrew
Chan, Roland Wiest and Mauricio Reyes
Prediction of MS Lesions using Random Forests
. . . 45John Muschelli, Elizabeth Sweeney, Jacob Maronge and
Ciprian Crainiceanu
.Unsupervised Multiple Sclerosis Lesion Detection
and Segmentation using Rules and Level Sets
. . . 51Eloy Roura, Mariano Cabezas, Sergi Valverde, Sandra
vi
Evaluation-Oriented Training Strategy on MS
Segmentation Challenge 2016
. . . 57Michel M. Santos, Paula R. B. Diniz, Abel G. Silva-Filho
and Wellington P. Santos
MRI Robust Brain Tissue Segmentation with
application to Multiple Sclerosis
. . . 63Xavier Tomas-Fernandez and Simon K. Warfield
A 3D Hierarchical Multimodal Detection and
Segmentation Method for Multiple Sclerosis Lesions
in MRI
. . . 69Hélène Urien, Irène Buvat, Nicolas Rougon and Isabelle Bloch
Multiple Sclerosis Lesion Detection and Segmentation
using a Convolutional Neural Network of 3D Patches
. . 75Sergi Valverde, Mariano Cabezas, Eloy Roura, Sandra
González-Villà, Joaquim Salvi, Arnau Oliver and Xavier Lladó
Random Forest for Multiple Sclerosis Lesion
Segmentation. . . .
81F.J. Vera-Olmos, H. Melero and N. Malpica
Multiple Sclerosis lesion segmentation using an
automated multimodal Graph Cut
Jeremy Beaumont Olivier Commowick Christian Barillot
VisAGeS U746 INSERM / INRIA, IRISA UMR CNRS 6074, Rennes, France
Abstract. In this paper, we present an algorithm for Multiple Sclerosis (MS) lesion segmentation. Our method is fully automated and includes three main steps: 1. the computation of a rough total lesion load in order to optimize the parameter set of the following step; 2. the detection of lesions by graph cut initialized with a robust Expectation-Maximization (EM) algorithm; 3. the application of rules to remove false positives and to adjust the contour of the detected lesions. Our algorithm will be tested on the FLI 2016 MSSEG challenge data.
Keywords: Graph Cut, Expectation-Maximization, Multiple sclerosis, Tissue classification
1
Introduction
Multiple Sclerosis (MS) is a chronic demyelinating disease that a↵ects the cen-tral nervous system. Brain lesions detection plays an important role in Multiple Sclerosis (MS) studies, as it is used to evaluate patient disease and its future evolution. Currently, lesions are detected by manual or semi-automatic segmen-tation methods, which are very time consuming and which show a high inter and intra-raters variability [8]. This issue can be solved with fully automated MS lesion segmentation methods. Here, we present one, based on the combina-tion of graph cut and robust EM tissues segmentacombina-tion using multiple sequences of Magnetic Resonance Imaging (MRI). Our process is applied to the FLI 2016 MSSEG challenge data.
2
Challenge data and evaluation criteria
2.1 Data and pre-processing15 MS patients data sets are available to allow challengers to optimize their segmentation algorithms. These data sets contain pre-processed and unprocessed data, available for challengers who would rather do their own pre-processing on the data, the ground truth and the seven manual segmentations used to compute it.
The challenge data sets include T1-w, T1-w Gadolinium, T2-w, PD and FLAIR sequences. It will not be described further in this paper, more details
2 Beaumont et al.
can be found on the challenge website1. The pre-processed data are denoised
with the NL-means algorithm [5], rigidly registered [3] towards the FLAIR im-ages, brain extracted using the volBrain platform [10] and bias corrected using the N4 algorithm [11]. As data are brain extracted, brain masks are provided in the pre-processed data sets. We decided to use the pre-processed data. Therefore, the method we described below will focus only on the MS lesions segmentation itself.
2.2 Evaluation criteria for the MS-SEG challenge
The qualitative evaluation of the proposed segmentation algorithm is made through two categories of evaluation metrics: lesion detection (are the lesions well detected independently of the contour quality?) and segmentation precision (are the lesion contours close to those of the ground truth?). For the MS-SEG challenge, the di↵erent segmentation workflow results will be compared to a ground truth for each MS patient using several evaluation metrics and will be ranked using two of them2:
F1 score: A metric used to assess the capacity of an algorithm to detect le-sions. The F1 score is a combination of the lesion sensitivity (SensL), i.e. the proportion of detected lesions in the ground truth, and the lesion positive predictive value (PPVL), i.e. the proportion of true positive lesions inside the result of segmentation algorithms.
Dice score: A well known overlap metric used to assess the capacity of an algorithm to be accurate in lesion delineation.
The ground truth is computed with the Logarithmic Opinion Pool Based STAPLE (LOP STAPLE) method [1], using seven independent manual segmen-tations for each patient.
3
MS lesions segmentation workflow
3.1 Lesions detection using graph cutThe segmentation algorithm relies on a graph cut approach previously presented in [6] and [2]. 3 MR sequences and the brain mask are required for this algorithm. We choose to use T1-w, T2-w and FLAIR sequences. We do not use PD as it generally shows less MS lesion contrast than T2-w and FLAIR.
Graph cut principle: MS patient images are used to generate a graph which will be exploited to segment in an optimal way MS lesions from both contour and regional information. This graph is initialized in a manner that each of its
1 https://portal.fli-iam.irisa.fr/msseg-challenge/data
2 More details are provided on the challenge website: https://portal.fli-iam.
Automatic Graph Cut Segmentation 3
nodes corresponds to a voxel and is connected to two others nodes representing the object class for MS lesions and the background class for normal appearing brain tissues (NABT). These two nodes are respectively called terminal source and sink. The image nodes are connected with their spatial neighbors by n-links, whose values are computed using a spectral gradient [6] and depend on the similarity of the two considered voxels. The t-links connect nodes in the image to their corresponding terminal source and sink nodes and represent how voxels fit into given models of the object and background. The simplest way to estimate object and background models is to use seeds chosen by a user. However, user interactions are prohibited if we want to develop an automated algorithm. This is why we compute the seeds in images with a 3-class multivariate Gaussian Mixture Model (GMM), where each class is equivalent to a brain tissue: White Matter (WM), Grey Matter (GM) and Cerebrospinal Fluid (CSF). MS lesions are considered as the outliers of this model.
Seeds computation: To be robust to outliers, the 3-class multivariate GMM is estimated using an Expectation Maximisation (EM) algorithm [7] which opti-mizes a trimmed likelihood. This EM algorithm has a parameter, h, representing the portion of voxels that are removed from the estimation. Its value needs to be adjusted to reject MS lesions as well as other outliers like veins or skull stripping errors from the estimation of the NABT model.
The obtained parameters of the GMM are used to compute a Mahalanobis distance [4] between each voxel of the images and each class of the NABT model. From this distance, a p-value, used to represent the probability not to fit into each of the 3 classes, can be computed. For each voxel i, we keep the lowest p-value among the three classes, denoted pi. Sinks should have a high value
when their corresponding voxels are close to the NABT model. The sinks t-links weights Wbi are then computed as:
Wbi = 1 pi (1)
All voxels that do not fit in the NABT model have a high p-value, therefore, we wish to di↵erentiate MS lesions from other outliers (vessels, skull stripping errors . . . ) using a priori knowledge about lesion intensities. MS lesions are usu-ally hyperintense compared to WM in T2-w and FLAIR images. A fuzzy logic approach has been chosen to model this expert’s knowledge. Instead of defining a binary threshold for hyper intensity, a fuzzy weight, computed for each sequence from the two parameters slope begining Sb and slope end Se, is characterized
(see [6] for more details). The final sources weights Woiare computed by taking
the minimum value between the p-value and the fuzzy weights WT 2and Wf lair:
Woi= min(pi, WT 2, Wf lair) (2)
Parameters definition: The presented algorithm works with three param-eters: h, Sband Se. In order to obtain the best segmentation results, we optimize
4 Beaumont et al.
these parameters with the provided training data set. We note that the param-eter h depends on the proportion of outliers in an image, and as such is directly linked with the Total Lesion Load (TLL) of MS patients. Therefore, the al-gorithm parameters have to be adapted to the MS patient TLL, which has to be estimated before performing the segmentation. We define two parameter sets: one for mild lesion load (TLL < 25 cm3), and the other one for severe lesion load
(TLL 25 cm3). These sets are presented in Table 1. A rough TLL estimation is automatically computed with the following steps:
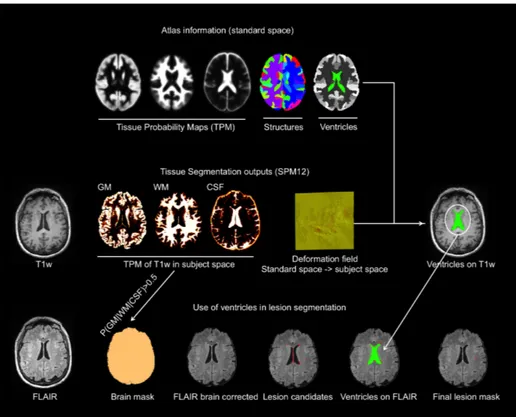
1. Non-linear registration of an atlas on the T1-w image. This atlas contains CSF, GM and WM probability maps plus a brain mask without the cerebel-lum and the brainstem.
2. Masking the T2-w and FLAIR images to keep only the WM in the two hemispheres (the amount of lesions is usually lower in the cerebellum and the brainstem and can be removed of the rough TLL estimation), using the atlas WM probability map and brain mask without the cerebellum and the brainstem.
3. Segmentation of the T2-w and FLAIR masked images with the K-means algorithm [9]. T2-w and FLAIR images are segmented respectively in 4 and 3 classes. This segmentation is performed to extract MS lesions, regrouped in one class in each image, from WM.
4. Intersection of the T2-w and FLAIR MS lesions classes.
5. Computation of the volume from the resulting image, which corresponds to an approximation of the TLL.
h Sb Se
Mild Lesion Load 0.1 2.0 4.0
Severe Lesion Load 0.4 3.0 4.0
Table 1: Values of our segmentation algorithm parameters, optimized on the training data.
3.2 Post-processing
After the detection of candidate lesions, some false positives still remain. To remove these artifacts, we add a post-process, made of the following steps:
1. lesions which have a size lower than 3 mm3 are removed
2. lesions touching the brain mask border are removed, as they are probably false positives due to vessels or skull stripping errors
3. lesions not sufficiently located in WM are removed, as MS lesions are typi-cally located there
Automatic Graph Cut Segmentation 5
4. lesions which do not touch a mask computed from MS patient T2-w and FLAIR sequences are removed. Lesions are considered as hyper intense in these two modalities, so it is possible to build a mask of “probable lesions”, i.e. regions where lesions may appear and out of which no lesion may be seen. This mask is built by automatically thresholding the T2-w and FLAIR images and intersecting those masks. Our segmentation method generates several false positives in the brainstem, therefore, the mask used in this post-processing step also excludes this region.
5. lesions delineations are improved using the mask of “probable lesions” com-puted in the previous step
4
Results
4.1 Sample results
Table 2 presents an evaluation of the whole segmentation algorithm with a post-processing step on the training data. An example of segmentation result is shown in Figure 1.
Dice scores SensL PPVL F1 scores
Mild Lesion Load 0.4703 0.4124 0.5698 0.4441
Severe Lesion Load 0.7219 0.2775 0.4605 0.3061
Mean 0.5709 0.3584 0.5260 0.3889
Table 2: Evaluation of our segmentation algorithm on the training data
4.2 Implementation and Computation Times
The algorithm benefices of a multi-threaded implementation, based on ITK and available in open-source software Anima3. The total computation time to process
each segmentation of the data set on a computer with an Intel(R) Xeon(R) CPU E5-2660 v3 @ 2.60GHz (8 cores) is approximately 10 minutes.
5
Conclusion
A fully automated MS lesion segmentation method using a graph cut initialized with a robust EM algorithm was presented. The results of the segmentation depend on the algorithm input parameters, which are directly linked with the MS patient TLL. The TLL is difficult to estimate and an error could result in a bad choice of these parameters, which may influence the segmentation workflow leading to worse results. Consequently, the automation of the presented method
3
6 Beaumont et al.
(a) FLAIR (b) T2
(c) Ground truth (d) Automatic segmentation
Fig. 1: Automatic segmentation of the data set 01016SACH
is a complicated task where the initialization of the parameters is very important to reach satisfactory results. These results are improved with a post-processing step in order to reduce the number of false positives to be as close as possible to the ground truth.
References
1. Akhondi-Asl, A., Hoyte, L., Lockhart, M.E., Warfield, S.K.: A logarithmic opinion pool based STAPLE algorithm for the fusion of segmentations with associated reliability weights. IEEE transactions on medical imaging 33(10), 1997–2009 (Oct 2014)
Automatic Graph Cut Segmentation 7 2. Catanese, L., Commowick, O., Barillot, C.: Automatic graph cut segmentation of multiple sclerosis lesions. In: ISBI challenge on longitudinal Multiple Sclerosis lesion segmentation (Apr 2015)
3. Commowick, O., Wiest-Daessl´e, N., Prima, S.: Block-matching strategies for rigid registration of multimodal medical images. In: 2012 9th IEEE International Sym-posium on Biomedical Imaging (ISBI). pp. 700–703 (May 2012)
4. Commowick, O., Fillard, P., Clatz, O., Warfield, S.K.: Detection of DTI White Matter Abnormalities in Multiple Sclerosis Patients. In: Metaxas, D., Axel, L., Fichtinger, G., Sz´ekely, G. (eds.) Medical Image Computing and Computer-Assisted Intervention – MICCAI 2008, pp. 975–982. No. 5241 in Lecture Notes in Computer Science, Springer Berlin Heidelberg (Sep 2008), dOI: 10.1007/978-3-540-85988-8 116
5. Coupe, P., Yger, P., Prima, S., Hellier, P., Kervrann, C., Barillot, C.: An Optimized Blockwise Nonlocal Means Denoising Filter for 3-D Magnetic Resonance Images. IEEE Transactions on Medical Imaging 27(4), 425–441 (Apr 2008)
6. Garcia-Lorenzo, D., Lecoeur, J., Douglas, A., Louis Collins, D.: Multiple Sclerosis Lesion Segmentation Using an Automatic Multimodal Graph Cuts. In: MICCAI. LNCS, vol. 5762, pp. 584–591 (2009)
7. Garcia-Lorenzo, D., Prima, S., Arnold, D.L.: Trimmed-Likelihood Estimation for Focal Lesions and Tissue Segmentation in Multisequence MRI for Multiple Sclero-sis. In: IEEE Trans. Med. Imag. vol. 30, no. 8, pp. 1455–1467. IEEE (2011) 8. Grimaud, J., Lai, M., Thorpe, J., Adeleine, P., Wang, L., Barker, G.J., Plummer,
D.L., Tofts, P.S., McDonald, W.I., Miller, D.H.: Quantification of MRI lesion load in multiple sclerosis: A comparison of three computer-assisted techniques. Magnetic Resonance Imaging 14(5), 495–505 (Jan 1996)
9. Hartigan, J.A., Wong, M.A.: Algorithm AS 136: A K-Means Clustering Algorithm. Journal of the Royal Statistical Society. Series C (Applied Statistics) 28(1), 100–108 (1979)
10. Manjon, J.V., Coup´e, P.: volBrain: An online MRI brain volumetry system. In: Organization for Human Brain Mapping’15. Honolulu, United States (Jun 2015) 11. Tustison, N.J., Avants, B.B., Cook, P.A., Zheng, Y., Egan, A., Yushkevich, P.A.,
Gee, J.C.: N4ITK: Improved N3 Bias Correction. IEEE Transactions on Medical Imaging 29(6), 1310–1320 (Jun 2010)
Automatic Multiple Sclerosis lesion
segmentation from Intensity-Normalized
multi-channel MRI
Jeremy Beaumont Olivier Commowick Christian Barillot
VisAGeS U746 INSERM / INRIA, IRISA UMR CNRS 6074, Rennes, France
Abstract. In the context of the FLI MICCAI 2016 MSSEG challenge for lesion segmentation, we present a fully automated algorithm for Multiple Sclerosis (MS) lesion segmentation. Our method is composed of three main steps. First, the MS patient images are registered and intensity normalized. Then, the lesion segmentation is done using a voxel-wise comparison of multi-channel Magnetic Resonance Images (MRI) against a set of controls. Finally, the segmentation is refined by applying several lesion appearance rules.
Keywords: Multiple Sclerosis, Intensity Normalization, Statistics, MRI
1
Introduction
Multiple Sclerosis (MS) is a auto-immune brain degenerative disease causing irre-versible patient handicap and which is still not well understood. Lesion detection is a major step to evaluate the patient disease status and its future evolution. Manual and semi-automatic segmentation methods are very time consuming and can show high inter and intra-rater variability [5]. To solve this issue, we present a fully automated method for MS lesions segmentation based on the combination of intensity standardization and voxel-wise comparison of multi-channel Mag-netic Resonance Images (MRI) of the patient and control subjects. Our process is applied to the FLI 2016 MSSEG challenge data.
2
Challenge data and evaluation criteria
2.1 Data and pre-processingTo allow challengers to optimize their segmentation algorithms, MS-SEG chal-lenge organizers gave access to 15 MS patient data sets. Each data set contains pre-processed and unprocessed data, available for challengers who wish to per-form their own pre-processing on the data, along with the ground truth and the seven manual segmentations used to compute it.
10 Beaumont et al.
The challenge data sets include T1-w, T1-w Gadolinium, T2-w, PD and FLAIR sequences1. Pre-processed data are provided in order to reduce the
de-pendency of the segmentation results on processing performance. The pre-processed data are denoised with the NL-means algorithm [4], rigidly registered [2] towards the FLAIR images, brain extracted using the volBrain platform [8] and bias corrected using the N4 algorithm [12]. As brain extraction was per-formed, brain masks are provided in the pre-processed data sets. We decided to use the pre-processed data. For this reason, the method we describe below will focus only on the MS lesions segmentation itself.
2.2 Evaluation criteria for the MS-SEG challenge
The quality of the proposed segmentation algorithm may be assessed through two categories of evaluation metrics: lesion detection (are the lesions well detected independently of the contour quality?) and segmentation precision (are the lesion contours close to those of the ground truth?). For the MS-SEG challenge, the organizers will compare the results of the di↵erent segmentation workflows to a ground truth for each MS patient and will use several evaluation metrics, out of which two will be used for the ranking of the challengers algorithms2:
F1 score: This metric is used to evaluate the quality of an algorithm in terms of lesions detection. It corresponds to the combination of the lesion sensitivity (SensL), i.e. the proportion of detected lesions in the ground truth, and the lesion positive predictive value (PPVL), i.e. the proportion of true positive lesions inside the result of segmentation algorithms.
Dice score: This well known overlap metric is used to evaluate the quality of an algorithm in terms of segmentation precision.
The ground truth is computed with the Logarithmic Opinion Pool based STAPLE (LOP STAPLE) method [1], using seven independent manual segmen-tations for each patient.
3
MS lesions segmentation workflow
3.1 Intensity StandardizationOur segmentation workflow is based on the voxel-wise comparison of MS patient images against a set of controls. However, intensity profile of conventional MRI has a high inter-subject and inter-scanner variability. To solve this issue, Karpate et al. [7] proposed the estimation of a correction factor which is used to make corresponding anatomical tissues take on the same intensity profile.
1 The challenge data sets will not be described further in this paper, more
de-tails can be found on the challenge website: https://portal.fli-iam.irisa.fr/ msseg-challenge/data
2 More details are provided on the challenge website: https://portal.fli-iam.
Robust Detection of Multiple Sclerosis Lesions 11
Image intensities of a healthy brain can be modeled by a 3-class Gaussian Mixture Model (GMM), where each Gaussian represents one of the brain tis-sues: White Matter (WM), Gray Matter (GM) and Cerebrospinal Fluid (CSF). MS lesions are considered as outliers of this model. Estimating the three classes parameters is rendered difficult because of MS lesion outlier intensities. We there-fore estimate them with a modification of the Maximum Likelihood Estimator (MLE) proposed by Notsu et al. [9], more robust to outliers. This estimation is based on the -loss function for the Normal distribution, used to maximize the MLE in the form of divergence, and is casted to yield an Expectation Maximisation (EM) algorithm [7].
Once the parameters are estimated, we obtain the means and covariances of tissues for the source and target images. These values are used to define a linear correction function which can be solved by linear regression. The results of the linear regression are then exploited to normalize the intensity profiles of the images.
3.2 MS lesions detection
MRI registration and intensity normalization make lesion segmentation possible through a comparison of vector of intensities between the patient and control subjects. Patient images are registered on the set of controls using a linear reg-istration method, based on the use of a block-matching algorithm as presented in [2,10], and a non linear registration method, based on the estimation of a dense non linear transformation between the images as presented in [11]. The methodology used by Karpate et al. [6] to compare the multi-channel vectors of intensities between MS patient and a group of controls is based on the com-putation of statistical di↵erences through the Mahalanobis distance [3]. These vectors of intensities are built from the available images and can therefore use any combination of them, like FLAIR, or T2-w and FLAIR, or DP, T2-w and FLAIR, making this a parameter of the algorithm.
3.3 Refinement of the segmentation
The intensities of pixels corresponding to brain tissues can vary in function of the brain region where they are located. Indeed, pixels which belong to the white matter brainstem and cerebellum are usually more intense than pixels which belong to the white matter hemispheres. This phenomenon induces the detection of several false positives in the brainstem and the cerebellum. Therefore, intensity standardization and MS lesions detection are computed on one hand in the two hemispheres and on the other hand in the brainstem and the cerebellum. 3.4 Post-processing
This comparison based segmentation algorithm may generate false positives for several reasons (registration errors, presence of noise in the images . . . ). There-fore, we add a post-processing step to our segmentation workflow in order to reduce the number of false positives. The post-processing is made of four steps:
12 Beaumont et al.
1. lesions which have a size lower than 3 mm3 are removed
2. lesions touching the brain mask border are removed, as they are probably false positives due to vessels or skull stripping errors
3. lesions not sufficiently located in WM are removed, as MS lesions are typi-cally located there
4. lesions which do not touch a mask computed from MS patient T2-w and FLAIR sequences are removed. Lesions are considered as hyper intense in these two modalities, so it is possible to build a mask of “probable lesions”, i.e. regions where lesions may appear and out of which no lesion may be seen. This mask is built by automatically thresholding the T2-w and FLAIR images and intersecting those masks. Our segmentation method generates several false positives in the brainstem, therefore, the mask used in this post-processing step also excludes this region.
5. lesions delineations are improved using the mask of “probable lesions” com-puted in the previous step
4
Results
4.1 MRI sequences used for MS lesions detection
Our algorithm can work with only one MR sequence or with several modalities. We have tested our segmentation workflow with T2-w and FLAIR sequences, discarding T1-w and PD images, as they generally show less MS lesion contrast than T2-w and FLAIR. Table 1 presents an evaluation of our segmentation (without post-processing algorithm) on the 15 training data. We worked on two possibilities to combine T2-w and FLAIR images for MS lesions segmentation: Intersection: Here, we consider that the T2-w and FLAIR MS patient images
are registered and intensity normalized on a set of controls. Vector images are created to combine T2-w and FLAIR sequences, on one hand, from MS patient images, and on the other hand, from control subject images. These vector images are then compared with the method described in section 3.2. Intersection of T2-w and FLAIR is interesting as it generates theoretically less false lesions detection as T2-w or FLAIR segmentation alone. However, this way to combine images has a drawback: in some cases, it is possible that a lesion intensity profile is close to the one of a tissue in a modality, which may reduce the Mahalanobis distance and induce the non-detection of a lesion even if its intensity profile is far from tissues intensity profiles in the other modalities.
Union: Here, we consider that our algorithm has already been used to segment MS patient lesions, first with T2-w sequences, and secondly with FLAIR sequences. Then, both segmentations are added. This induces, in theory, that more lesions are detected than in T2-w and in FLAIR segmentations alone. Yet, this type of combination has an inconvenient: false lesions detections from the both T2-w and FLAIR segmentations are kept, thereby adding some noise in the final segmentation.
Robust Detection of Multiple Sclerosis Lesions 13
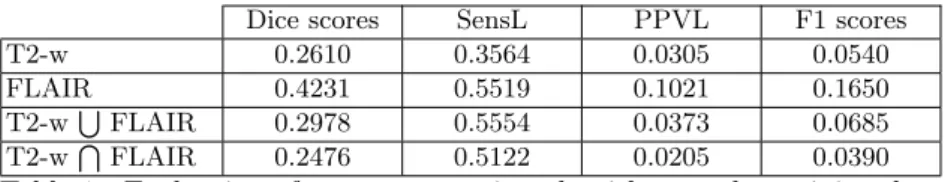
Dice scores SensL PPVL F1 scores
T2-w 0.2610 0.3564 0.0305 0.0540
FLAIR 0.4231 0.5519 0.1021 0.1650
T2-wSFLAIR 0.2978 0.5554 0.0373 0.0685
T2-wTFLAIR 0.2476 0.5122 0.0205 0.0390
Table 1: Evaluation of our segmentation algorithm on the training data without post-processing.
4.2 Sample results
Table 2 presents an evaluation of the whole segmentation algorithm with a post-processing step on the training data. We choose to perform segmentation twice, using di↵erent MRI sequences each time, in order to remove some false positives and to improve lesions delineation. One process uses FLAIR image when the other uses the intersection of T2-w and FLAIR images as theses modalities are the ones which provide the best results. An example of segmentation result is shown in Figure 1.
Dice scores SensL PPVL F1 scores
T2-w 0.4010 0.3771 0.1811 0.2102 FLAIR 0.5053 0.5309 0.1803 0.2552 T2-wSFLAIR 0.4244 0.4932 0.1530 0.2135 T2-wTFLAIR 0.4396 0.5270 0.1507 0.2166 FLAIR and T2-wTFLAIR 0.5663 0.4560 0.2871 0.3290
Table 2: Evaluation of our segmentation algorithm with a post-processing step.
4.3 Implementation and Computation Times
The pipeline presented for the FLI2016 MICCAI MSSEG challenge used the combination of FLAIR and T2 T FLAIR modalities to perform the segmen-tation as this process is the one which provides the best results (see Table 2). The algorithm implementation is multi-threaded, based on ITK and available in Anima3. The total computation time to process each segmentation of the data set on a computer with an Intel(R) Xeon(R) CPU E5-2660 v3 @ 2.60GHz (8 cores) is approximately 8 minutes.
5
Conclusion
We presented a fully automated MS lesion segmentation method based on in-tensity normalization and voxel-wise comparison. MS lesion segmentation is a
3
14 Beaumont et al.
(a) FLAIR (b) T2
(c) Ground truth (d) Automatic segmentation
Fig. 1: Automatic segmentation of the data set 01016SACH
complicated task as MS lesion definition is inter-expert dependent. There is a high variability in the detection of lesions even between ground truth and man-ual segmentations (dice scores and F1 scores for training data vary respectively from 0.26 to 0.88 and 0.13 to 1). A few MR sequences also have a low initial res-olution. This may influence the segmentation workflow and lead to worse results. Consequently, the choice of the optimal modalities used to compute a segmen-tation and the definition of efficient post-processing steps can be a complicated task.
References
1. Akhondi-Asl, A., Hoyte, L., Lockhart, M.E., Warfield, S.K.: A logarithmic opinion pool based STAPLE algorithm for the fusion of segmentations with associated
Robust Detection of Multiple Sclerosis Lesions 15 reliability weights. IEEE transactions on medical imaging 33(10), 1997–2009 (Oct 2014)
2. Commowick, O., Wiest-Daessl´e, N., Prima, S.: Block-matching strategies for rigid registration of multimodal medical images. In: 2012 9th IEEE International Sym-posium on Biomedical Imaging (ISBI). pp. 700–703 (May 2012)
3. Commowick, O., Fillard, P., Clatz, O., Warfield, S.K.: Detection of DTI White Matter Abnormalities in Multiple Sclerosis Patients. In: Metaxas, D., Axel, L., Fichtinger, G., Sz´ekely, G. (eds.) Medical Image Computing and Computer-Assisted Intervention – MICCAI 2008, pp. 975–982. No. 5241 in Lecture Notes in Computer Science, Springer Berlin Heidelberg (Sep 2008), dOI: 10.1007/978-3-540-85988-8 116
4. Coupe, P., Yger, P., Prima, S., Hellier, P., Kervrann, C., Barillot, C.: An Optimized Blockwise Nonlocal Means Denoising Filter for 3-D Magnetic Resonance Images. IEEE Transactions on Medical Imaging 27(4), 425–441 (Apr 2008)
5. Grimaud, J., Lai, M., Thorpe, J., Adeleine, P., Wang, L., Barker, G.J., Plummer, D.L., Tofts, P.S., McDonald, W.I., Miller, D.H.: Quantification of MRI lesion load in multiple sclerosis: A comparison of three computer-assisted techniques. Magnetic Resonance Imaging 14(5), 495–505 (Jan 1996)
6. Karpate, Y., Commowick, O., Barillot, C.: Robust Detection of Multiple Sclerosis Lesions from Intensity-Normalized Multi-Channel MRI (Feb 2015)
7. Karpate, Y., Commowick, O., Barillot, C., Edan, G.: Longitudinal Intensity Normalization in Multiple Sclerosis Patients. In: Linguraru, M.G., Laura, C.O., Shekhar, R., Wesarg, S., Ballester, M.A.G., Drechsler, K., Sato, Y., Erdt, M. (eds.) Clinical Image-Based Procedures. Translational Research in Medical Imaging, pp. 118–125. No. 8680 in Lecture Notes in Computer Science, Springer International Publishing (Sep 2014), dOI: 10.1007/978-3-319-13909-8 15
8. Manjon, J.V., Coup´e, P.: volBrain: An online MRI brain volumetry system. In: Organization for Human Brain Mapping’15. Honolulu, United States (Jun 2015) 9. Notsu, A., Komori, O., Eguchi, S.: Spontaneous Clustering via Minimum
Gamma-Divergence. Neural Computation 26(2), 421–448 (Feb 2014)
10. Ourselin, S., Roche, A., Prima, S., Ayache, N.: Block Matching: A General Frame-work to Improve Robustness of Rigid Registration of Medical Images. In: Delp, S.L., DiGoia, A.M., Jaramaz, B. (eds.) Medical Image Computing and Computer-Assisted Intervention – MICCAI 2000, pp. 557–566. No. 1935 in Lecture Notes in Computer Science, Springer Berlin Heidelberg (Oct 2000), dOI: 10.1007/978-3-540-40899-4 57
11. Suarez, R.O., Commowick, O., Prabhu, S.P., Warfield, S.K.: Automated delin-eation of white matter fiber tracts with a multiple region-of-interest approach. NeuroImage 59(4), 3690–3700 (Feb 2012)
12. Tustison, N.J., Avants, B.B., Cook, P.A., Zheng, Y., Egan, A., Yushkevich, P.A., Gee, J.C.: N4ITK: Improved N3 Bias Correction. IEEE Transactions on Medical Imaging 29(6), 1310–1320 (Jun 2010)
Automatic multiple sclerosis lesion segmentation
with P-LOCUS
Senan Doyle1, Florence Forbes2, and Michel Dojat3
1 Pixyl Medical, Grenoble, France 2 Inria Grenoble Rhˆone-Alpes, Grenoble, France
3 INSERM U1216, GIN, Grenoble, France
Abstract. P-LOCUS provides automatic quantitative neuroimaging bio-marker extraction tools to aid diagnosis, prognosis and follow-up in mul-tiple sclerosis studies. The software performs accurate and precise seg-mentation of multiple sclerosis lesions in a multi-stage process. In the first step, a weighted Gaussian tissue model is used to perform a ro-bust segmentation. The algorithm avails of complementary information from multiple MR sequences, and includes additional estimated weight variables to account for the relative importance of each voxel. These esti-mated weights are used to define candidate lesion voxels that are not well described by a normal tissue model. In the second step, the candidate le-sion regions are used to populate the weighted Gaussian model and guide convergence to an optimal solution. The segmentation is unsupervised, removing the need for a training dataset, and providing independence from specific scanner type and MRI scanner protocol.
1
Introduction
MS brain lesion segmentation is important for diagnosis, prognosis, and patient follow-up. Typically, this task is performed manually by a medical expert, how-ever automatic methods are sought to alleviate the tedious, time consuming and subjective nature of manual delineation. Automatic methods are motivated by the demand for large-scale multi-center clinical research studies that require pre-cise, repeatable and cost-efficient analysis. Automatic brain image segmentation remains a challenging task for a number of reasons, including the presence of artefacts, and the heterogeneity of MRI scanner protocol.
Automated or semi-automated MS brain lesion detection methods can be classified according to their use of multiple sequences, a priori knowledge about the structure of normal brain, and the specific tissue segmentation model. In most approaches, normal brain tissue prior probability maps are used to help identify lesion as an outlier.
Existing methods frequently avail of complementary information from multi-ple sequences. For exammulti-ple, lesion voxels may appear hyperintense in one modal-ity and normal in another. This is implicitly used by neurologists when examining data. In an statistical framework, complementary information from di↵erent se-quences can help to better discriminate data generated by di↵erent probabilistic
18 Senan Doyle et al.
distributions in a multi-dimensional space. Intensity distributions are commonly modeled as multi-dimensional Gaussian distributions. This provides a way to combine the multiple sequences in a single segmentation task but with all the sequences having equal importance. Given that the information content and dis-criminative power to detect lesions varies between di↵erent MR sequences, we adopt a weighted data model, originally proposed by Forbes et al [4], that allows for the identification of atypical lesion voxels and the subsequent inclusion of the lesion class as an additional model component.
2
Weighted Model
We consider a finite set V of N voxels on a regular 3D grid. The intensities ob-served at each voxel are denoted by y ={y1, . . . , yN} . Each yi={yi1, . . . , yiM}
is itself a vector of M intensity values corresponding to M di↵erent MR se-quences. The goal is to assign each voxel i to one of K classes considering the observed features data y. For brain tissue segmentation, we consider in general 3 tissues plus some possible additional classes to account for lesions in pathological data. We denote the hidden classes by z = {z1, . . . , zN}, and the set in which
z takes its values by Z. Typically, the zi’s take their values in {1 . . . K}. We
consider non-negative weights ! = {!i, i 2 V } in a state space denoted by W
and with !i ={!i1, . . . , !iM}. In our general setting the weights are sequence
and voxel-specific.
The segmentation task is recast into a missing data framework in which y are observations and z are missing variables. Their joint distribution p(y, z|!; ) is governed by the weights !2 W and parameters 2 , which are both unknown and need to be estimated. A prior distribution p(!) is defined on the weights, considered additional missing variables. Denoting the parameters by ={ , }, we assume that the joint distribution p(y, z, !; ) is a MRF with the following energy function:
H(y, z, !; ) = HZ(z; ) + HW(!) +
X
i2V
log g(yi|zi, !i; )
where the energy term HW(!)involving only ! does not depend on and theg(yi|zi, !i; )s are probability density functions of yi.
For the data term Pi2V log g(yi|zi, !i; )in (1), we consider M-dimensional Gaussian distributions with diagonal covariance matrices. For each class k,t(µ
k1, . . . , µkM) is the mean vector and{sk1, . . . , skM}the covariance matrix components. When
zi = k, then G(yim; µzim, szim) represents the Gaussian distribution with mean µkm and variance skm. The whole set of Gaussian parameters is denoted by ={µkm, skm, k = 1 . . . K, m = 1 . . . M}.Our data term is then defined by setting
g(yi|zi, !i; ) = M
Y
m=1
G(yim; µzim,szim
!im
Automatic multiple sclerosis lesion segmentation with P-LOCUS 19 which is proportional to M Q m=1G(y im; µzim, szim)
!im. Intuitively, the impact of a larger !im is to give more importance to the intensity value yim in the model.
A weight of one recovers the standard multivariate Gaussian case.
The missing data term HZ(z; ) in (1) is set to a standard Potts model, with
external field ⇠ and spatial interaction parameter ⌘, and whose energy is
HZ(z; ) = X i2V (⇠izi+ X j2N (i) ⌘hzi, zji),
whereN (i) denotes the voxels neighboring i and hzi, zji is 1 when zi = zj
and 0 otherwise. Parameter ={⇠, ⌘} with ⇠ = {t(⇠
i1. . . ⇠iK), i2 V } being a
set of real-valued K-dimensional vectors and ⌘ a real positive value.
The weights are assumed independent from parameters and independent across modalities. The simplest choice is to define a prior p(!) =QMm=1Qi2V p(!im)
where each p(!im) is a Gamma distribution with hyperparameters ↵im(shape)
and im(inverse scale). Thus HW(!) = M X m=1 X i2V ((↵im 1) log !im im!im).
In practice, the set of hyperparameters is fixed so that the modes of each prior p(!im) are located at some expert weights{!imexp, m = 1 . . . M, i2 V } accounting
for some external knowledge, if available. Formally, we set ↵im= im!imexp+ 1 to
achieve this. The expert weights can be chosen according to the specific task. For example, when voxels with typical lesion intensities are not numerous enough to attract a model component, increasing the expert weight for some of them will help in biasing the model toward the identification of a lesion class.
A solution to the model is found using the Expectation-Maximization (EM) framework [2] combined with a variational approximation for tractability in the presence of Markov dependencies. In particular, the mean field principle provides a deterministic way to deal with intractable MRF models[1].
3
Method
Of the four possible input sequences available, the method uses only the un-processed T1-weighted and Flair. The images are masked, co-registered and cor-rected for inhomogeneities using the N4 algorithm.
The segmentation process consists of two stages, as detailed in [3]. In the first step, we set K = 3, considering only the three normal tissue classes (with all !imexpand im set to 1). The ⇠ parameters in the MRF prior are set to ⇠ik=
log fik where fik is the normalized value given by a normal tissue atlas. The
interaction parameter ⌘ is estimated using a stochastic gradient descent method as specified in [1]. The estimated weights for the Flair sequence are thresholded
20 Senan Doyle et al.
at a value of one to identify outlier regions corresponding to candidate lesion regions. This candidate region is refined using additional intensity, location and size constraints, as in [7, 5, 6]. Retained lesions are hyperintense in Flair, confined to white matter and greater than 5mm3.
In the second step, the candidate region is used to specify the parameters of the weight distribution in a K = 4 segmentation setting. We set im according
to: im = L for all i 2 L and im = L¯ for all i 62 L, where L and L¯ are
values to be specified. We set L¯ = 1000 to express our a priori trust in the
estimation of the normal brain tissue classes from the preliminary first step, and set L= 10 to allow some flexibility in the weight estimation.
The expert weight is fixed to !L= 2 and !L¯= 1. Large values of !Lmake the
lesion class more representative and handle the possibility of very small lesions, while a small !L¯ ensures that the weighting of a large candidate lesion region
does not a↵ect the estimation of other classes. A post-processing step removes artefacts based on spatial location.
4
Conclusion
The adaptive weighting model facilitates accurate and robust MS lesion segmen-tation from T1-weighted and Flair sequences. The advantage of this approach is that the weights, and therefore the ’outliers’ are obtained in a multi-sequence framework that provides a more robust estimation of normal tissue parameters. The method is independent of MRI scanner, and does not require training data.
References
1. G. Celeux, F. Forbes, and N. Peyrard. EM procedures using mean field-like approx-imations for Markov model-based image segmentation. Pat. Rec., 36(1):131–144, 2003.
2. A. Dempster, N. Laird, and D. Rubin. Maximum likelihood from incomplete data via the EM algorithm. J. Roy. Statist. Soc. Ser. B, 39:1–38, 1977.
3. F. Forbes, S. Doyle, D. Garcia-Lorenzo, C. Barillot, and M. Dojat. A Weighted
Multi-Sequence Markov Model For Brain Lesion Segmentation. In AISTATS,
Sardignia, May 13-15, 2010.
4. Florence Forbes, Senan Doyle, Daniel Garc´ıa-Lorenzo, Christian Barillot, and Michel Dojat. Adaptive weighted fusion of multiple mr sequences for brain lesion segmen-tation. In ISBI, pages 69–72. IEEE, 2010.
5. O. Freifeld, H. Greenspan, and J. Goldberger. Lesion detection in noisy MR brain images using constrained GMM and active contours. In IEEE ISBI, pages 596–599, 2007.
6. D. Garcia-Lorenzo, L. Lecoeur, D.L. Arnold, D. L. Collins, and C. Barillot. Mul-tiple Sclerosis lesion segmentation using an automatic multimodal graph cuts. In MICCAI, pages 584–591, 2009.
7. K. Van Leemput, F. Maes, D. Vandermeulen, A. Colchester, and P. Suetens. Auto-mated segmentation of multiple sclerosis lesions by model outlier detection. IEEE trans. Med. Ima., 20(8):677–688, 2001.
MS Lesion Segmentation
Using FLAIR MRI Only
Jesse Knight, April Khademi
Image Analysis in Medicine Lab, School of Engineering, University of Guelph [email protected]
Abstract. There have been many e↵orts to automate segmentation of MS lesions in brain MRI, since human delineation is time consuming and error prone. However, most existing methods require multiple coreg-istered MR sequences, tissue priors or parametric models, and are rarely validated on multi-scanner image databases. In this work, a fast, FLAIR-only lesion segmentation algorithm is proposed, that does not use tissue priors or parametric models. The method uses an edge-based model of partial volume averaging to estimate fuzzy membership profiles of tissue classes. Results are further refined using an upstream image standard-ization pipeline, and downstream post processing. Lesion segmentation performance is measured on 15 volumes from three di↵erent scanners, demonstrating the robustness of the approach.
1
Introduction
Multiple Sclerosis (MS) is a demyelinating autoimmune disease a↵ecting the cen-tral nervous system. MR imaging of MS lesions plays an integral role in disease diagnosis, monitoring, and research [1]. Since manual segmentation of MS lesions is subjective, unreliable, and time consuming, there has been significant interest in automating this task [2]. Existing approaches have performed classification based on voxel values from multiple coregistered MR sequences, neighborhood voxel values, normalized coordinates, and tissue prior images [2].
Despite the large number of proposed methods, very few have been validated on images from di↵erent scanners, which reflects the challenging variability in clinical images [2]. For instance, the works by Souplet et al. [3], Garcia-Lorenzo et al. [4], and Wang et al. [5] fit parametric models to the graylevel distributions of each tissue class, and use images from a single scanner for validation. However, it has been shown that graylevel distributions are highly specific to the acquiring scanner [6]. Similarly, in the works by Wu et al. [7], Steenwijk et al. [8], and Samaille et al. [9], K-Nearest Neighbour classification is used with features from multiple MR sequences; yet without normalization of graylevels across scanners, these approaches are unlikely to generalize. There are also additional challenges associated with using multiple MRI modalities or tissue priors, including the need for accurate registration, additional scan time, limited retrospective image availability, and increased segmentation model complexity.
22 Jesse Knight, April Khademi
Here we present an edge-based segmentation method, based on previous work [6, 10] and apply it to MS lesion segmentation. Our method overcomes many of the challenges outlined above, since it does not rely on parametric graylevel dis-tribution models, it employs only the most lesion-discriminative MRI sequence, Fluid Attenuation Inversion Recover (FLAIR), and it does not require registra-tion to any addiregistra-tional templates or tissue priors. We also demonstrate reliability of the method on images from three di↵erent MR scanners.
2
Methods
2.1 Image Data & Manual Segmentations
This work uses the 15 raw FLAIR images provided in the unprocessed training dataset of the MICCAI 2016 MSSEG Challenge; the brain is isolated in each image, however, using the brain masks provided in the pre-processed dataset. The binary consensus segmentations also provided, being the fusion of 7 expert manual tracings using the LOP-STAPLE method [11], are used as the ground truth for performance evaluation.
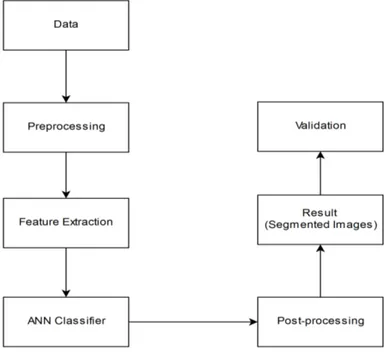
2.2 Edge-Based Lesion Segmentation
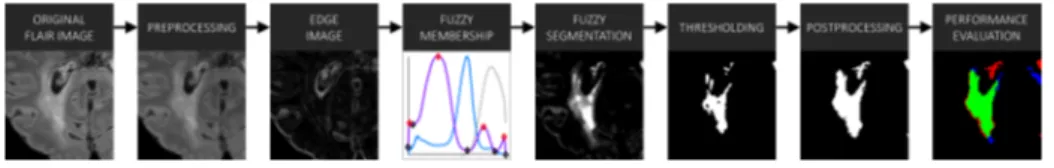
The proposed image processing pipeline is summarized in Fig. 1. The method takes a single FLAIR image, denoted Y (x) in 3D space, x ={x1, x2, x3} 2 Z3.
The pipeline consists of image preprocessing, an edge-based fuzzy classification model, thresholding, and post processing. Output lesion masks are then com-pared to the consensus segmentations using quantitative performance measures.
Fig. 1. Image processing pipeine
Preprocessing Preprocessing is employed to correct intensity inhomogeneity and reduce random noise in the source FLAIR images. First, intensity inhomo-geneity (bias field) is corrected using the Segment feature in the SPM12 toolbox [12]. While this tool also produces tissue probability images, these are not needed for lesion segmentation and are discarded. A 3D Gaussian low pass filter, with = 0.5 mm, is then used to minimize image noise; it was found that this filter outperformed median, anisotropic di↵usion, and bilateral filters.
Fuzzy Classification Next, we perform fuzzy classification using an edge-based model [6, 10]. This model assumes that the graylevels of each tissue class (CSF,
MS Lesion Segmentation Using FLAIR MRI Only 23
Brain, Lesion) are distributed along a unique range, and that graylevels in be-tween these ranges represent voxels subject to partial volume averaging (PVA, a mixture of two tissue types). For a PVA-a↵ected voxel, comprising a mixture of classes cjand ck, with graylevels yjand yk, respectively, and where ↵jkindicates
the mixing proportion of class cj, the graylevel yjk(x) is modelled as [13],
yjk(x) = ↵jk(x)⇥ yj(x) + (1 ↵jk(x))⇥ yk(x)
We take the gradient of this equation to solve for ↵jk(x), in order to quantify
the exact amount of each tissue present in each voxel. However, we observe that the solution in the spatial domain is intractable, since the integration bounds x0
and xN are undefined [10],
↵0jk(x) = y0 jk(x) yj yk ! ↵jk(x) = 1 yj yk Z xN x0 yjk0 (x)dx
To circumvent this, all voxels in the image volume are considered simultane-ously in the graylevel (global) domain: ↵0(x) ! ↵0(y), where the integration
becomes feasible. The global estimate of ↵0(y) is computed using the conditional
expectation operator, given an initial spatial estimate of edge strength, which is proportional to ↵0(x).
First, the gradient magnitude image, G(x), is computed using the centered di↵erence kernel, D = [ 1, 0, +1], applied in all three dimensions.
G(x) =|rxY (x)| = "✓ dY (x) dx1 ◆2 + ✓dY (x) dx2 ◆2 + ✓dY (x) dx3 ◆2#12
For a robust estimate of the spatial domain edge strength, histogram equalization is performed to ensure that edge magnitudes are distributed consistently and without outliers, yielding ↵0(x),
↵0(x) = CDFG(G(x))
Next, the distribution of edge strength in the graylevel domain, ↵0(y), is esti-mated as the expected value of edge in the image for each graylevel. The expec-tation is computed robustly using a 2-bin Gaussian kernel density estimate with bins p(↵0(x) = 1| y) and p(↵0(x) = 0| y), and = 1/6 (see [10] for derivation),
↵0(y) =E{↵0(x)| y}
= X
a20,1
a· p(↵0(x) = a| y) = p(↵0(x) = 1| y)
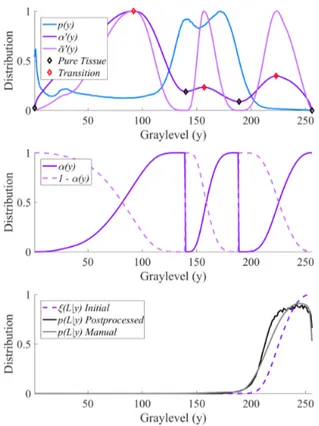
Postprocessing of ↵0(y) consists of smoothing, and trimming to remove the top 0.02% of brain voxels. This reliably yields a distribution like that shown in Fig.
24 Jesse Knight, April Khademi
2, top, dark purple, in which local minima (black diamonds) represent graylevels corresponding to pure tissue classes minimal edge information and maxima (red diamonds) represent class transitions edgy regions. Before integration to solve for ↵(y), we refine: ↵0(y)! ˜↵0(y) to yield a more robust estimate of pure tissue and PVA ranges: extrema are identified using peak detection, and locally normalized to {0,1}, and the magnitude is squared, as shown in Fig. 2, top, light purple. This ˜↵0(y) is then used to find the partial volume fraction ↵(y)
Fig. 2. Graylevel distributions for one FLAIR volume; top - histogram, edge distri-bution, and extrema; middle - partial volume fraction from piecewise integration of the edge distribution; bottom - distributions of lesion: initial fuzzy estimate, post-processed, and manual estimate.
for each pair of adjacent tissue classes, since the desired integration can now be performed between pure tissue graylevels yj, yk (local minima),
↵jk(y) = Py yk↵˜ 0(y)dy Pyi yk↵˜0(y)dy , y2 [yk, yi]
Finally, the partial volume fraction profiles for each pair of adjacent tissue classes, ↵jk(y) (Fig. 2, middle) are combined in smooth piecewise segments to give the
MS Lesion Segmentation Using FLAIR MRI Only 25 ⇠(ck| y) = 8 > > > > > > < > > > > > > : 0, y2 [0, yi) ↵jk(y), y2 [yi, yk) 1, y = yk 1 ↵jk(y), y2 (yk, y`] 0, y2 (y`, ymax]
This smooth characterization of ⇠(ck | y) di↵ers from previous works [6, 10],
where graylevel ranges corresponding to pure tissues and PVA were estimated us-ing piecewise linear functions. This new formulation ensures that graylevels with minimum edge correspond to pure classes, and that maximum fuzzy membership slope (class transition) occurs at the maximum edge content ↵(y) between pure tissue classes, reflecting the edge-based estimate of PVA distribution.
Post Processing The initial fuzzy classification is thresholded at a level ⌧ 2 {0, 1} to give a binary segmentation image, denoted A. Three false positive reduction (FPR) strategies are then appended to the pipeline to refine A based on prior knowledge. The FPR exclusion criteria include:
– Minimum lesion volume (using 6-connectedness, MLV, mm3) – Minimum distance from the brain edge (3D, DBE, mm) – Minimum distance from the brain midline (2D, DBM, mm)
False negatives are also reduced using region growing (RG), in an attempt to mimic the experts’ inclusion of marginally hyperintense white matter (also called dirty-appearing white matter) which surrounds lesion cores. During each of NRG
region growing iterations, each neighboring voxel at location x is added to the segmentation A if the graylevel is acceptably close to an adaptive threshold: the qth quantile of the graylevels in the original segmentation:
if : y(x⇤) QY (x2A)(q) < , then : A A [ x⇤
The fuzzy threshold ⌧ , FPR constraints, and RG parameters were all optimized using a semi-guided simplex gradient ascent with respect to group DSC. 2.3 Performance Analysis
Performance of the algorithm for lesion segmentation is evaluated using the over-lap metrics recommended by the MSSEG Challenge. These compare automated segmentation image A(x) to the ground truth segmentation image T (x):
– Dice Similarity Coefficient: 2AA+T\T – Positive Predictive Value: A\TA – True Positive Rate: A\T
T
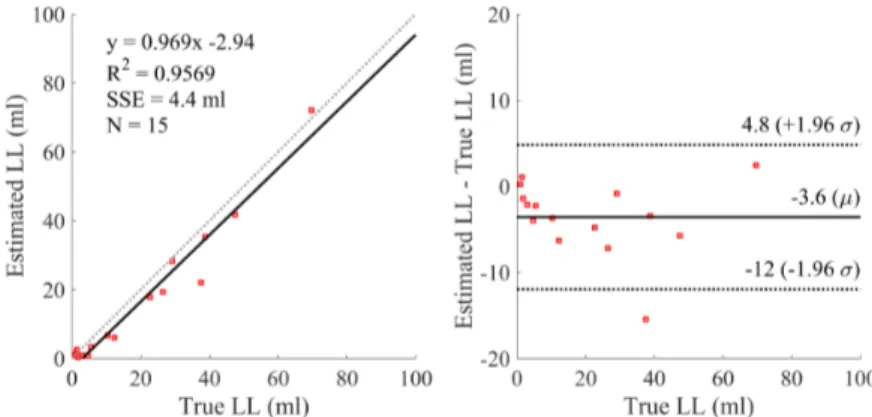
Additionally, volume agreement with expert lesion load (LL) is illustrated using a Bland-Altman plot, and analysis of covariance (ANCOVA) is used to test for significant impacts of scanner and LL on DSC.
26 Jesse Knight, April Khademi
3
Results
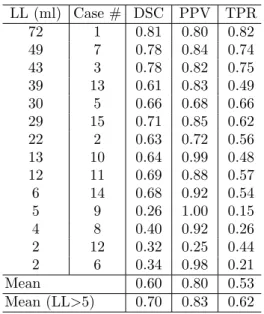
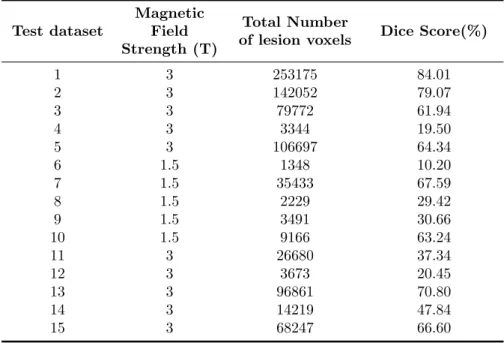
This section presents segmentation performance data, following initial fuzzy seg-mentation, and postprocessing using the optimized parameters, as well as factors influencing performance Performance. The mean DSC for all 15 training cases was 0.60 (Table 1), but for the 10 cases with LL < 5 ml, it increased to 0.70. Accordingly, analysis of covariance revealed that DSC was significantly corre-lated with LL, independent of scanner (p = 0.013), while performance was not significantly impacted by scanner when controlling for LL (p = 0.354).
Table 1. Performance metrics by case
LL (ml) Case # DSC PPV TPR 72 1 0.81 0.80 0.82 49 7 0.78 0.84 0.74 43 3 0.78 0.82 0.75 39 13 0.61 0.83 0.49 30 5 0.66 0.68 0.66 29 15 0.71 0.85 0.62 22 2 0.63 0.72 0.56 13 10 0.64 0.99 0.48 12 11 0.69 0.88 0.57 6 14 0.68 0.92 0.54 5 9 0.26 1.00 0.15 4 8 0.40 0.92 0.26 2 12 0.32 0.25 0.44 2 6 0.34 0.98 0.21 Mean 0.60 0.80 0.53 Mean (LL>5) 0.70 0.83 0.62
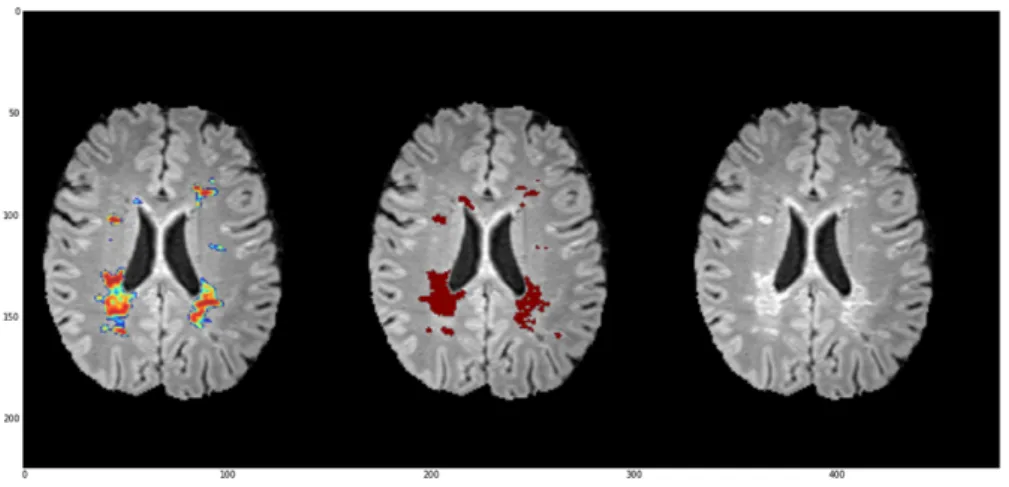
Fig. 3. Sample segmentation; green: true positives, blue: false negatives, red: false positives
An example segmentation is shown in Fig. 3, where it can be seen that false pos-itives arise mostly along the lesion borders, while false negatives are attributable to small, ambiguous lesions near the gray matter. The Bland Altman plots (Fig. 4), demonstrate a potential bias of the method towards underestimation of LL (mean di↵er-ence of 3.6 ml), and a small positive correlation between LL and undersegmentation (slope of 0.97). This result is corroborated by higher mean PPV (0.80) than TPR (0.53), over all cases, indicating higher specificity than sensitivity.
4
Discussion
The edge-based segmentation algorithm performs well on the training data pro-vided, given the large intensity inhomogeneity and low resolution in the MRI vol-umes. We observed that the ground truth distribution of lesion versus graylevel,
MS Lesion Segmentation Using FLAIR MRI Only 27
Fig. 4. Bland-Altman plots showing volume agreement with expert segmentations
p(L | y) (Fig. 2, bottom), using the binary consensus segmentations, rarely reaches a value of 1, and has long, gradual slopes towards the maximum. This likely arises from the ambiguous segmentation of so-called dirty appearing white matter, and it means that even optimal thresholding results would incur signif-icant false positive and false negative fractions. Pre- and post-processing tech-niques both help to reduce these e↵ects, and it is worth noting that our prepro-cessing pipeline resulted in better separability of classes by graylevel than the preprocessed images provided for the competition.
As with most MS lesion segmentation algorithms, the proposed method is challenged by small lesion loads. However, performance was not impacted by scanner or the associated voxel resolution, demonstrating the robustness of this efficient nonparametric approach to modeling FLAIR image variability. Many of the false positives occur either in the gray matter (due to bias field) or as CSF pulsation artifacts, so future works could investigate the use of tissue priors, improved inhomogeneity correction, or multiscale estimation of edge content. However, in hoping to avoid expensive and error-prone image registrations in our approach, we are investigating primarily multiscale or context-based edge characterization, and an iterative bias-field correction with lesion masking.
5
Conclusion
In conclusion, we present a fast, robust segmentation algorithm capable of delin-eating MS lesions in FLAIR MRI alone. The method achieves good performance (DSC = 0.60) on a challenging database of 15 images from 3 di↵erent scan-ners, and even better performance (DSC = 0.70) on lesion loads greater than 5 ml. Unlike many segmentation tools, the algorithm does not rely on parametric models of tissue class graylevel distributions, and consequently demonstrates no change in performance with di↵erent scanners. Additionally, the method requires only one MRI sequence, FLAIR, and no additional tissue priors or training data, thereby avoiding additional MR scan time, limited image availability, and the need for expensive and imperfect registration.
28 Jesse Knight, April Khademi
References
1. Polman, C.H., Reingold, S.C., Banwell, B., Clanet, M., Cohen, J.A., Filippi, M., Fujihara, K., Havrdova, E., Hutchinson, M., Kappos, L., Lublin, F.D., Montalban, X., O’Connor, P., Sandberg-Wollheim, M., Thompson, A.J., Waubant, E., Wein-shenker, B., Wolinsky, J.S.: Diagnostic criteria for multiple sclerosis: 2010 revisions to the McDonald criteria. Annals of Neurology 69(2) (2011) 292–302
2. Garcia-Lorenzo, D., Francis, S., Narayanan, S., Arnold, D.L., Collins, D.L.: Review of automatic segmentation methods of multiple sclerosis white matter lesions on conventional magnetic resonance imaging. Medical Image Analysis 17(1) (2013) 1–18
3. Souplet, J., Lebrun, C., Ayache, N., Malandain, G.: An Automatic Segmentation of T2-FLAIR Multiple Sclerosis Lesions. MICCAI Grand Challenge Workshop: Multiple Sclerosis Lesion Segmentation Challenge (2008) 1–11
4. Garc´ıa-Lorenzo, D., Prima, S., Arnold, D.L., Collins, D.L., Barillot, C.: Trimmed-likelihood estimation for focal lesions and tissue segmentation in multisequence MRI for multiple sclerosis. IEEE Transactions on Medical Imaging 30(8) (2011) 1455–67
5. Wang, R., Li, C., Wang, J., Wei, X., Li, Y., Zhu, Y., Zhang, S.: Automatic segmentation and volumetric quantification of white matter hyperintensities on fluid-attenuated inversion recovery images using the extreme value distribution. Neuroradiology 57(3) (2015) 307–320
6. Khademi, A., Venetsanopoulos, A., Moody, A.R.: Robust white matter lesion segmentation in FLAIR MRI. IEEE Transactions on Bio-Medical Engineering 59(3) (2012) 860–871
7. Wu, Y., Warfield, S.K., Tan, I.L., Wells, W.M., Meier, D.S., van Schijndel, R.A., Barkhof, F., Guttmann, C.R.G.: Automated segmentation of multiple sclerosis lesion subtypes with multichannel MRI. NeuroImage 32(3) (2006) 1205–1215 8. Steenwijk, M.D., Pouwels, P.J.W., Daams, M., van Dalen, J.W., Caan, M.W.A.,
Richard, E., Barkhof, F., Vrenken, H.: Accurate white matter lesion segmentation by k nearest neighbor classification with tissue type priors (kNN-TTPs). NeuroIm-age. Clinical 3 (2013) 462–9
9. Samaille, T., Fillon, L., Cuingnet, R., Jouvent, E., Chabriat, H., Dormont, D., Colliot, O., Chupin, M.: Contrast-based fully automatic segmentation of white matter hyperintensities: method and validation. PloS one 7(11) (2012) e48953 10. Khademi, A., Venetsanopoulos, A., Moody, A.R.: Generalized method for partial
volume estimation and tissue segmentation in cerebral magnetic resonance images. Journal of Medical Imaging 1(1) (2014) 14002
11. Akhondi-Asl, A., Hoyte, L., Lockhart, M.E., Warfield, S.K.: A logarithmic opinion pool based STAPLE algorithm for the fusion of segmentations with associated reliability weights. IEEE Transactions on Medical Imaging 33(10) (2014) 1997– 2009
12. Ashburner, J., Friston, K.J.: Unified segmentation. NeuroImage 26(3) (2005) 839–851
13. Santago, P., Gage, H.D.: Quantification of MR brain images by mixture density and partial volume modeling. IEEE Transactions on Medical Imaging 12(3) (1993) 566–574
Automatic Multiple Sclerosis Lesion
Segmentation Using Hybrid Artificial Neural
Networks
Amirreza Mahbod, Chunliang Wang, ¨
Orjan Smedby
STH Medical Imaging and Visualization Group KTH Royal Institute of Technology
Stockholm, Sweden
Abstract. Multiple sclerosis (MS) is a demyelinating disease which could cause severe motor and cognitive deterioration. Segmenting MS lesions could be highly beneficial for diagnosing, evaluating and monitoring the disease progression. To do so, manual segmentation, performed by ex-perts, is often performed in hospitals and clinical environments. Although manual segmentation is accurate, it is time consuming, expensive and might not be reliable.
The aim of this work was to propose an automatic method for MS le-sion segmentation and evaluate it using brain images available within the MICCAI MS segmentation challenge.
The proposed method employs supervised artificial neural network based algorithm, exploiting intensity-based and spatial-based features as the input of the network. This method achieved relatively accurate results with acceptable training and testing time for training datasets.
Keywords: Multiple Sclerosis Segmentation, Artificial Neural networks, Machine Learning, MRI
1
Introduction
Multiple Sclerosis (MS) lesion is a demyelinating disease which appears in white matter (WM) region of the brain and causes various motor and cognitive impair-ments [1]. One of the most accurate imaging tools for diagnosing MS is magnetic resonance imaging (MRI), which provides not only qualitative but also quanti-tative evidences for assessing disease development and treatment efficacy.
Segmentation of MS lesions in MR scans is a crucial step of quantitative dis-ease analysis. The most common method for that is manual segmentation which is also regarded as the “gold standard” method for distinguishing lesions and other brain tissues. Although this method is accurate, it is a tedious and com-plex procedure that is not practical for analyzing large amount of MRI datasets