HAL Id: hal-00330227
https://hal.archives-ouvertes.fr/hal-00330227v2
Submitted on 11 May 2021
HAL is a multi-disciplinary open access
archive for the deposit and dissemination of
sci-entific research documents, whether they are
pub-lished or not. The documents may come from
teaching and research institutions in France or
abroad, or from public or private research centers.
L’archive ouverte pluridisciplinaire HAL, est
destinée au dépôt et à la diffusion de documents
scientifiques de niveau recherche, publiés ou non,
émanant des établissements d’enseignement et de
recherche français ou étrangers, des laboratoires
publics ou privés.
carbon balance
P. Ciais, A. V. Borges, G. Abril, Michel Meybeck, G. Folberth, D.
Hauglustaine, I. A. Janssens
To cite this version:
P. Ciais, A. V. Borges, G. Abril, Michel Meybeck, G. Folberth, et al.. The impact of lateral carbon
fluxes on the European carbon balance. Biogeosciences, European Geosciences Union, 2008, 3 (5),
pp.1259-1271. �10.5194/bg-5-1259-2008�. �hal-00330227v2�
Biogeosciences, 5, 1259–1271, 2008 www.biogeosciences.net/5/1259/2008/
© Author(s) 2008. This work is distributed under the Creative Commons Attribution 3.0 License.
Biogeosciences
The impact of lateral carbon fluxes on the European carbon balance
P. Ciais1, A. V. Borges2, G. Abril3, M. Meybeck4, G. Folberth5, D. Hauglustaine1, and I. A. Janssens61Laboratoire des Sciences du Climat et de l’Environnement, IPSL/LSCE CEA-CNRS-UVSQ, Gif sur Yvette, France 2Chemical Oceanography Unit, University of Li`ege, Belgium
3Environnements et Pal´eoenvironnements OC´eaniques, Universit´e de Bordeaux 1. CNRS-UMR 5805, Avenue des Facult´es, Talence, France
4SISYPHE, Universit´e Paris VI Jussieu, Paris, France
5School of Earth and Ocean Science, University of Victoria, Victoria, Canada 6Department of Biology, Universiteit Antwerpen, Antwerpen, Belgium
Received: 5 May 2006 – Published in Biogeosciences Discuss.: 22 September 2006 Revised: 30 May 2007 – Accepted: 23 July 2008 – Published: 5 September 2008
Abstract. To date, little is known about the impact of
pro-cesses which cause lateral carbon fluxes over continents, and from continents to oceans on the CO2– and carbon budgets at local, regional and continental scales. Lateral carbon fluxes contribute to regional carbon budgets as follows: Ecosys-tem CO2sink=Ecosystem carbon accumulation+Lateral car-bon fluxes. We estimated the contribution of wood and food product trade, of emission and oxidation of reduced carbon species, and of river erosion and transport as lateral carbon fluxes to the carbon balance of Europe (EU-25). The analysis is completed by new estimates of the carbon fluxes of coastal seas. We estimated that lateral transport (all processes com-bined) is a flux of 165 Tg C yr−1at the scale of EU-25. The magnitude of lateral transport is thus comparable to current estimates of carbon accumulation in European forests. The main process contributing to the total lateral flux out of Eu-rope is the flux of reduced carbon compounds, corresponding to the sum of non-CO2gaseous species (CH4, CO, hydrocar-bons, . . . ) emitted by ecosystems and exported out of the European boundary layer by the large scale atmospheric cir-culation.
1 Introduction
Lateral carbon transport moves carbon away from where CO2 is withdrawn from the atmosphere. This induces dif-ferences between regional changes in carbon stocks and re-gional CO2fluxes (Tans et al., 1995; Sarmiento et al., 1992).
Correspondence to: P. Ciais (philippe.ciais@cea.fr)
Lateral carbon transport contributes to the carbon budget of ecosystems as follows:
Ecosystem CO2 sink=Ecosystem carbon accumulation
+Lateral carbon flux.
Comparing CO2fluxes resulting from atmospheric inver-sion models with bottom-up carbon flux estimates (Pacala et al., 2001; Janssens et al., 2003; Peylin et al., 2005), one may expect differences explained by lateral carbon transport. Some bottom-up approaches (e.g. forest biomass inventories) estimate carbon stock changes, while some directly measure CO2 fluxes (e.g. eddy covariance flux towers). This paper has three main goals. The first one is to describe the mech-anisms of lateral carbon transport and some of their impli-cations for regional carbon budgets. The second goal is to quantify the flux of carbon displaced within and from the European territory (here the EU-25), and to place it in the context of atmospheric inversion results. The third goal is to provide geospatial estimates of the CO2fluxes associated with lateral processes, whenever this is possible.
We consider three processes linking CO2fluxes with lat-eral carbon transport either within the EU-25 area or across its boundaries. These processes are (1) the trade of food, feed and wood products (Ciais, et al., 2006; Imhoff, et al., 2004), (2) the emissions of reduced atmospheric carbon compounds such as CO, CH4, terpenes, and isoprene by ecosystems and human activities, which get transported by winds and oxi-dized by chemical reactions in the global atmosphere outside Europe (Enting et al., 1991; Folberth et al., 2005; Sunthar-alingam et al., 2005), and (3) the river transport of carbon from land to the ocean (Aumont et al., 2001; Meybeck 1987). In addition, CO2fluxes in coastal seas (Borges et al., 2006) are estimated. This exchange of atmospheric CO2by coastal
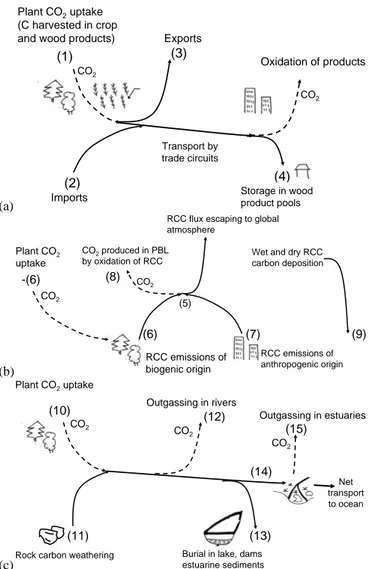
(a) (4) CO2 CO2 Transport by trade circuits Plant CO2uptake (C harvested in crop and wood products)
Storage in wood product pools Oxidation of products (1) Imports Exports (2) (3) (b) CO2 Plant CO2 uptake CO2produced in PBL by oxidation of RCC -(6)
RCC flux escaping to global atmosphere (8) (6) RCC emissions of biogenic origin RCC emissions of anthropogenic origin (7)
Wet and dry RCC carbon deposition (9) CO2 (5) (c) (12) (13) (15) (14) (11) CO2 CO2 CO2
Rock carbon weathering
Plant CO2uptake
Outgassing in rivers
Burial in lake, dams estuarine sediments Outgassing in estuaries Net transport to ocean (10)
Fig. 1. Carbon cycle loops involving lateral transport. Numbers as-sociated to each flux correspond to data in Table 2. The asas-sociated sources/sinks of atmospheric CO2are given by dashed lines, and the fluxes of carbon are given by solid lines. (a) Lateral transport by trade of crop and wood products. (b) Lateral transport by re-duced carbon compounds (RCC) emissions and atmospheric chem-istry and transport. (c) Lateral transport by river transport coupled to rock weathering.
seas does not per se originate from a lateral carbon flux, but it is considered here as a necessary flux component to recon-cile large-scale CO2flux atmospheric inversion results with bottom-up inventory data. The first four sections below treat each lateral transport process separately. The discussion sec-tion summarizes the contribusec-tion of the different processes to the carbon balance of Europe. By convention, all fluxes of carbon gained by the continent are sinks for the atmosphere and counted negatively, while carbon lost by the continent is counted as a positive flux.
2 Crop and forest products trade
2.1 Food and feed products
Cultivated lands are long-term net sinks of atmospheric CO2 because carbon incorporated into biomass is harvested and removed from ecosystems to supply human or animal con-sumption (Fig. 1a). The concon-sumption of food or feed prod-ucts releases CO2back to the atmosphere, away from ecosys-tems. Over the globe, the lateral transport of carbon in food products is neutral for the atmosphere, given the fact that storage of food products is negligible compared to harvested fluxes. At the regional scale, croplands are net CO2 sinks (as confirmed by year-round eddy-covariance measurements, e.g. Anthoni et al., 2004) while populated areas where food is consumed are net CO2sources. At the continental level, international trade of crop products also intervenes into the net carbon balance.
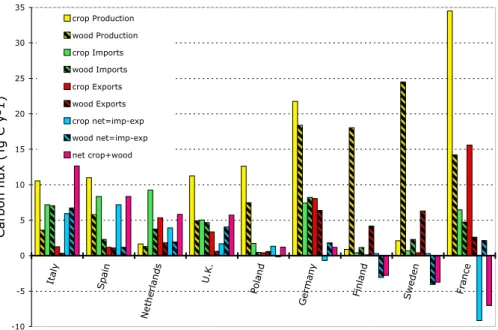
We analyzed the agricultural statistics from FAO (2004) to infer harvest, lateral carbon transport and subsequent CO2 land-atmosphere fluxes caused by food trading. We found that cereals, essentially maize, wheat and barley, are respon-sible for nearly all of the CO2 sink in European croplands. In contrast, the CO2source derived from food consumption originates from a more diverse mix of crop products. From the perspective of individual countries, the situation is con-trasted (Fig. 2). The largest CO2 sink associated with the trade of crop carbon is France (–9 Tg C yr−1), about 90% of the total European sink for that process. The largest CO2 sources are Portugal, Belgium, Netherlands, Italy and Spain (altogether 22 Tg C yr−1). Other countries are approximately neutral. We found no relationship between harvest and the net carbon balance in each country with regards to food trade. At the continental level, Europe imports more carbon in food and feed than it exports, thus being a net CO2source to the atmosphere of 24 Tg C yr−1, about 2% of EU-25 fossil fuel CO2emissions.
The patterns of CO2fluxes induced by trade is mapped us-ing geospatial information on (1) crop varieties (Ramankutty et al., 1998), (2) human population and, (3) housed poultry, pigs and cattle populations. Statistical data on feedstuff and food product harvest and trade (FAO, 2004) is converted to a geospatial dataset on a 1◦by 1◦grid, using the same method-ology as in Ciais et al. (2006). Crop biomass data are con-verted into dry biomass and into carbon using crop-specific conversion factors (Goudriaan et al., 2001). The results are shown in Fig. 3. Agricultural plains with intensive cultiva-tion (northern France, southern England, Hungarian plains, Po valley in Italy) are annual net sinks of CO2, with up-take rates reaching up to 100 g C m−2 yr−1. Locally, this CO2sink is larger than the mean European forest uptake flux (70 g C m−2yr−1in Janssens et al., 2003), which is not sur-prising given the slightly higher NPP and harvest index (ratio of yield to above-ground NPP) of crops compared to trees.
P. Ciais et al.: Lateral fluxes carbon Europe 1261 -10 -5 0 5 10 15 20 25 30 35 Italy Spain Netherlands U.K. Poland German y Finland Sweden Fr ance Carbon flux (T g C y -1) crop Production wood Production crop Imports wood Imports crop Exports wood Exports crop net=imp-exp wood net=imp-exp net crop+wood
Fig. 2. Carbon fluxes associated with harvest and trade in various countries. Production (=harvest) requires plant CO2uptake to form biomass. Imported products are oxidized into CO2, making a net CO2source in the importing country. Exported products require plant CO2 uptake to form crop and wood biomass (included in production), making a CO2sink in the exporting country. The net flux is the balance between CO2sources and sinks (see Fig. 1a). convention, sources of CO2to the atmosphere are positive. By convention, sources of CO2to the atmosphere are positive.
Sink for exported wood
gC m-2 y-1
-50 -25 0 25 50
(a)
Source of imported wood usegC m-2 y-1
-50 -25 0 25 50
(b)
Sink for exported food & feed
gC m-2 y-1
-300 -150 0 150 300
(c)
Source of imported food & feedgC m-2 y-1
-300 -150 0 150 300
(d)
Fig. 3. Spatial patterns of trade induced CO2 fluxes with the atmosphere. Sources of CO2 are positive and sinks are negative (in g C m−2y−1). (a–b) CO2 fluxes associated with wood products export and import. (c–d) CO2fluxes associated with food and feed products export and import.
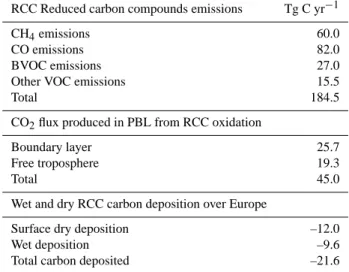
Table 1. Component fluxes of the cycle of non-CO2reduced carbon compounds (RCC) over the European continent and its boundary layer, an area bounded by 32 N and 73 N in latitude and –10 W and 40 E in longitude. Sources to the atmosphere are counted >0 and sinks <0. Fluxes are estimated using a global chemistry transport model. Units are Tg C yr−1.
RCC Reduced carbon compounds emissions Tg C yr−1
CH4emissions 60.0
CO emissions 82.0
BVOC emissions 27.0
Other VOC emissions 15.5
Total 184.5
CO2flux produced in PBL from RCC oxidation
Boundary layer 25.7
Free troposphere 19.3
Total 45.0
Wet and dry RCC carbon deposition over Europe
Surface dry deposition –12.0
Wet deposition –9.6
Total carbon deposited –21.6
Urban regions in Fig. 3, and intensive farming regions, emit CO2to the atmosphere at a rate of 50 g C m−2yr−1.
There are uncertainties on these maps. Using statistics at the country level may smooth out the fields. For instance, feedstuff consumption by farm animals is distributed at the country level according to animal population maps, while in reality animals may have different regional reliance on feed-stuff. National harvest of crop biomass is distributed evenly according to the area of each crop variety, neglecting regional differences in yields caused by soil fertility or climate gra-dients. Finally, food consumption is assumed to be a CO2 source distributed according to human population, thereby neglecting the transport of organic carbon to sewage water and rivers.
2.2 Forest products
We consider forest products from coniferous and non-coniferous trees: industrial round wood, sawn wood, wood panels and paper, as listed in the FAO (2004) database. Wood product data in volumetric units are converted to carbon weight units using a mean wood density of 500 kg m-3, and a 0.45 carbon fraction in dry biomass, respectively. Sweden and Finland export more carbon in wood than they import, thus being net sinks of atmospheric CO2of –3 Tg C yr−1and –4 Tg C yr−1respectively (Fig. 2). Nearly all other countries are net CO2sources to the atmosphere with respect to wood products trade. The largest sources are in Italy (6 Tg C yr−1), Spain, the Netherlands and the UK. Countries that export food products typically also export wood products (except for Nordic countries) and vice versa. At the EU-25 level, imports of wood products currentlysions exceed exports,
in-ducing a net source of CO2of up to 7 Tg C yr−1. This value is likely to be a maximum estimate because it assumes that wood products are decomposed into CO2instantly, neglect-ing storage. Usneglect-ing the mean residence times of wood prod-ucts of Liski et al. (2005), typically 30 years for spruce wood and 40 years for oak sawn wood, we estimate that on a 10 years horizon, the trade of wood products results in a net source of CO2to the atmosphere of 2 Tg C yr−1only, while the remaining 5 Tg C yr−1is temporarily stored in product pools.
To map the CO2fluxes from forest product trade, we con-verted the country-level data (FAO, 2004) into a geospatial dataset on a 1◦×1◦grid using a remote-sensing driven NPP model (Lafont, et al., 2002) and a forest cover map of Europe (CORINE Land cover, 2000). The geographical distribution of the CO2source due to the decay of wood products is as-sumed to follow population density (i.e. assuming that land-fills are distributed like population density). The results are shown in Fig. 3.
There are large uncertainties in these maps. First, forests with high greenness (NDVI) wil not necessarily have the largest biomass, nor wood production. For instance, the NDVI vegetation index is well known to saturate at high Leaf Area Index values, although Myneni et al. (2001) showed a positive correlation between NDVI and biomass over a wide range of forests. Further, the areas where CO2is released by decaying wood-products may differ in their geographic loca-tion from the actual populaloca-tion density distribuloca-tion (e.g. de-pending on regional practice for using wood as a construction material).
3 Reduced carbon compounds
3.1 Surface emissions
Ecosystems and anthropogenic activities emit non-CO2 re-duced carbon compounds, hereafter called RCC. RCC are the sum of CO, CH4, biogenic volatile organic compounds (BVOC such as isoprene, terpene), and anthropogenic volatile organic compounds (VOC). These species are reac-tive and their atmospheric lifetimes vary over several orders of magnitude, from 9 years for methane, down to a mere few hours in the case of terpene. Although the oxidation sequence of an RCC can be complex, the main end prod-uct is CO2. The global RCC flux from ecosystems is small compared to photosynthesis or respiration. It can, however, become significant compared to the net carbon balance of an ecosystem (Kesselmeier et al., 2005). If the objective of a study is to determine the CO2flux of Europe by inverse mod-eling of CO2concentration, then RCC emissions can right-fully be ignored. On the other hand, if the objective is to determine the carbon flux of Europe, the RCC flux must then be added as a correction to the CO2flux calculated by inver-sions.
P. Ciais et al.: Lateral fluxes carbon Europe 1263
3.2 CO2production in the atmosphere
The lifetime of atmospheric RCC compounds with respect to their chemical sink in the atmosphere can easily exceed typi-cal boundary-layer transport time stypi-cales. The carbon carried by RCC can thus be released as CO2away from surface emis-sions (Fig. 1b). Table 1 shows that the total EU-25 emisemis-sions of RCC are 185 Tg Cyr−1. A small fraction of these emis-sions (14%) is transformed into CO2in the boundary layer, very shortly after emission (Fig. 1b and Table 1). We es-timated the CO2 production from RCC using a global 3-D chemistry transport model (Folberth, et al., 2005, Hauglus-taine et al., 2004). This model accounts for two major ox-idation channels of RCC: (1) the oxox-idation of primary CO and of secondary CO from the oxidation of CH4and Volatile Organic Compounds (VOC), and (2) the direct oxidation of peroxy-radicals carbon into CO2. An additional minor chan-nel corresponds to the direct ozonolysis of alkenoid com-pounds into CO2 and is also taken into account. The to-tal ‘photochemical’ CO2production from RCC in the atmo-spheric column over Europe amounts to 45 Tg C yr−1and 57% of this flux (26 Tg C yr−1)occurs in the boundary layer, as reported in Table 1. About 90% of the photochemical CO2 production comes from CO oxidation by hydroxyl radicals (OH). A map of RCC deposition and emission is given in Fig. 4.
3.3 Surface deposition of carbon and impact on the net car-bon balance
A gain of carbon by the European surface occurs via the dry surface deposition processes and the wet scavenging by pre-cipitation (Fig. 1b). This sink amounts to 22 Tg C yr−1 (Ta-ble 1). The net effect of RCC on the European carbon flux can be estimated by taking the difference between surface emissions (carbon source) and the photosynthetic uptake of CO2 from which the biogenic VOC emissions are derived (carbon sink) plus the dry and wet RCC deposition flux (car-bon sink) must be derived (Fig. 1b). We estimate a net car(car-bon loss to the atmosphere of 76 Tg C yr−1(Table 2). The impact of RCC compounds on the European CO2flux is different. It is the difference between the photochemical flux of CO2into the boundary layer (oxidation of RCC) and the CO2uptake photosynthesis which fuels the biogenic RCC emissions. We note a corresponding net CO2sink of 61 Tg C yr−1(Table 2).
4 Riverine carbon transport
4.1 Processes controlling the transport of atmospheric car-bon by rivers
Rivers (streams, lakes, river main stems, floodplains and estuaries) transport carbon laterally from the land to the ocean, and vertically as CO2 degassing to the atmosphere and as carbon burial in sediments (Fig. 1c). Rivers trans-port carbon in dissolved and particulate organic forms (DOC, POC) and under inorganic forms (DIC, PIC and dissolved CO2). The source and sink processes of river carbon in natural conditions are: (1) wetlands and peat drainage, (2) soil leaching and erosion, and (3) chemical weathering of soil minerals. This carbon is originally taken up from the atmosphere by photosynthesis (CO2+H2O–
>CH2O+O2), or by direct carbonate rock weathering (CO2+H2O+MCO3→2HCO−3+M2+) or silicate rock weathering (2CO2+H2O+MSiO3→2HCO−3+M2++SiO2). During the weathering of silicate rocks 100% of river DIC originates from the atmosphere, but during weathering of carbonate rocks, only half of the DIC originates from the atmosphere, and half derives from fossil carbonates stored in rocks. Therefore the nature and age of river carbon species is very different (Meybeck 1993, 2005). Particulate inorganic carbon (PIC) is derived from mechanical erosion. While being transported downstream to the coast, PIC is gradually trapped in lowlands, floodplains, lakes, estuaries and on the continental shelf. This relocation of PIC does not generally affect the CO2 cycle. Also, under specific arid conditions and high pH, some DIC may precipitate on its way to the sea as calcite in soils and sediments.
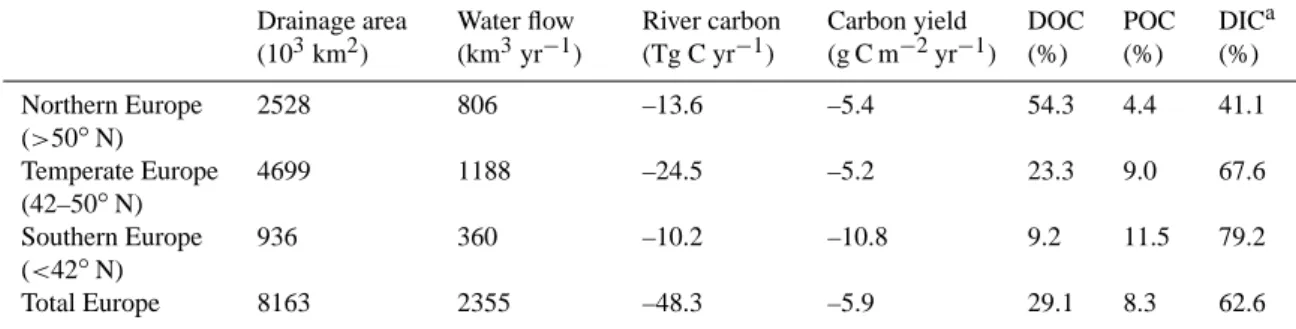
Factors controlling river export of atmospheric carbon (DOC+POC+atmospheric derived DIC) are first river runoff, then rock type via the occurrence of carbonates, and finally the presence of wetlands and large lakes. A preliminary com-parison of river carbon fluxes in northern, central and south-ern Europe shows strong regional contrasts. Northsouth-ern catch-ments show high DOC export, but most POC is trapped in lakes which cover 5–20% of these basins (Meybeck et al., 2005). The age of this DOC derived from wetlands and peat bogs typically ranges from 100 to 6000 years. South-ern catchments show DIC derived from the atmosphere as the dominant form of river carbon. Central European catch-ments are intermediate, with carbon fluxes depending on river runoff and rock type.
4.2 Human perturbation of river carbon transport
Human intervention in river catchments may substantially modify river carbon transport (Fig. 5b). The exploitation of peat bogs generally increases DOC contents in head waters (Fig. 5a–b). Increased soil erosion by agricultural practices increases the POC inputs. Untreated organic waste water (Fig. 5b–c) and eutrophication of rivers and lakes (Fig. 5b,
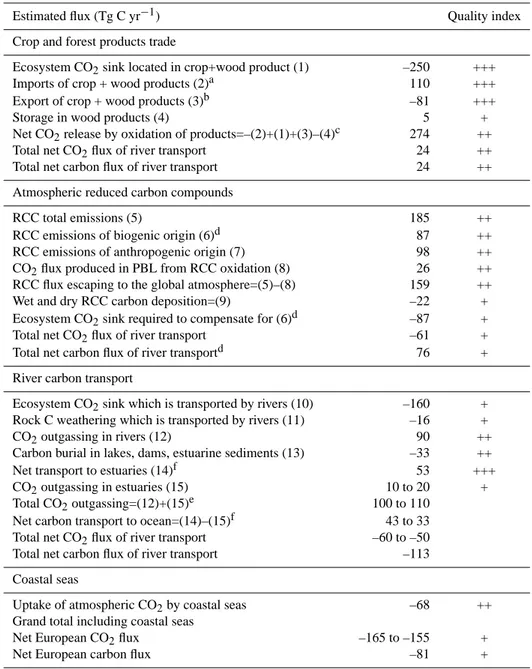
Table 2. Carbon fluxes and CO2fluxes caused by lateral transport processes. The European “continent” is defined as including its atmo-spheric boundary layer and its inner estuaries. A flux lost by the European continent is counted >0, and a carbon gain is counted <0. An uncertainty index of each estimate is given in the right hand column (low uncertainty +++, high uncertainty +). The numbers in parenthesis associated to each flux correspond to those shown in Fig. 1. By convention, sources for atmosphere are shown as positive values whereas sinks are shown as negative values.
Estimated flux (Tg C yr−1) Quality index
Crop and forest products trade
Ecosystem CO2sink located in crop+wood product (1) –250 +++
Imports of crop + wood products (2)a 110 +++
Export of crop + wood products (3)b –81 +++
Storage in wood products (4) 5 +
Net CO2release by oxidation of products=–(2)+(1)+(3)–(4)c 274 ++
Total net CO2flux of river transport 24 ++
Total net carbon flux of river transport 24 ++
Atmospheric reduced carbon compounds
RCC total emissions (5) 185 ++
RCC emissions of biogenic origin (6)d 87 ++
RCC emissions of anthropogenic origin (7) 98 ++
CO2flux produced in PBL from RCC oxidation (8) 26 ++
RCC flux escaping to the global atmosphere=(5)–(8) 159 ++
Wet and dry RCC carbon deposition=(9) –22 +
Ecosystem CO2sink required to compensate for (6)d –87 +
Total net CO2flux of river transport –61 +
Total net carbon flux of river transportd 76 +
River carbon transport
Ecosystem CO2sink which is transported by rivers (10) –160 + Rock C weathering which is transported by rivers (11) –16 +
CO2outgassing in rivers (12) 90 ++
Carbon burial in lakes, dams, estuarine sediments (13) –33 ++
Net transport to estuaries (14)f 53 +++
CO2outgassing in estuaries (15) 10 to 20 +
Total CO2outgassing=(12)+(15)e 100 to 110
Net carbon transport to ocean=(14)–(15)f 43 to 33
Total net CO2flux of river transport –60 to –50
Total net carbon flux of river transport –113
Coastal seas
Uptake of atmospheric CO2by coastal seas –68 ++
Grand total including coastal seas
Net European CO2flux –165 to –155 +
Net European carbon flux –81 +
aImported carbon corresponds to a plant uptake of CO
2outside Europe, thus not being included in (1) bExported carbon corresponds to a plant uptake of CO
2inside Europe, thus being included in (1) cAssumes that the decomposition of crop and wood products generates CO
2which is emitted to the atmosphere
dAssumes that 100% of biogenic RCC emissions comprising terpenes, methanol, methane, are formed by plant carbon derived from photo-synthesis, causing a compensating sink of CO2.
eEstablished for an area of 8.16 Mkm2, including the Barentz sea and Black Sea river catchments. fAlthough this carbon is not lost by the continent to the atmosphere as CO
2, but lost to estuaries in the case of (14) and to coastal oceans in the case of (14)–(15), it is counted as source (>0) in the table.
P. Ciais et al.: Lateral fluxes carbon Europe 1265
30 Figure 4. A. Spatial patterns of the surface deposition (sink) of carbon from reduced carbon compounds (RCC). B. Patterns of reduced carbon compounds emissions to the atmosphere from antropogenic and biospheric sources.
(a)
A
(b)
Fig. 4. (a) Spatial patterns of the surface deposition (sink) of carbon from reduced carbon compounds (RCC). (b) Patterns of reduced carbon compounds emissions to the atmosphere from antropogenic and biospheric sources.
d) are additional sources of very labile DOC and POC. The ages of these carbon species are highly variable (a few days for river algal carbon to 1000 years for peat DOC). The CO2 evasion from freshwaters strongly depends on the reactivity of the organic carbon carried by rivers. During the 1970’s, when rivers were receiving untreated waste water, river res-piration R exceeded river production P (Gross primary pro-duction), resulting in eutrophication and in a net CO2source to the atmosphere (Kempe, 1984). Nowadays, due to waste water treatment, the same river may have multiple changes of P /R ratio from headwaters to estuary, as observed for the Scheldt and Seine rivers (Meybeck et al., 2005).
As part of human activity, river damming and irrigation control the carbon fluxes to oceans. Reservoirs store up to 99% of particulate river material (V¨or¨osmarty et al., 2003) including POC and may degrade DOC and retain part of DIC as calcite precipitation. Irrigation canals continuously trans-fer river carbon to agricultural soils. In Southern Europe, the export of riverine carbon to the ocean has decreased in most rivers (e.g. by 40% for the Ebro). However, the impact of
(a) ATMOSPHERIC CO2 R I V E R E S T U A R Y S H E L F RIVER
SYSTEM ESTUARIES SHELF OPENOCEAN SOILS WETLAND ROCK DIC DIC DOCPOC DOC CO2
PIC POCPIC POCPIC POC
Figure XA. Schematic transfers of river carbon along the aquatic continuum in natural conditions. (* k, l and m: control stations)
(d) (c) (b) (a) (e) (f) (h) (j) (i) (g) *m *l *k (b) ATMOSPHERIC CO2 R I V E R E S T U A R Y S H E L F RIVER
SYSTEM ESTUARIES SHELF OPENOCEAN SOILS WETLAND ROCK DIC DIC DOCPOC DOC CO2
PIC POCPIC POCPIC POC
Figure XB. Schematic transfers of river carbon along the aquatic continuum with multiple Human impacts D C B A E F
Fig. 5. Transport of river carbon along the aquatic continuum. (a) Under natural conditions. (b) With multiple human impacts. See text for indications.
water withdrawal for irrigation on river carbon fluxes to the Mediterranean Sea or the Portuguese coast is unknown be-cause the last gaging and water quality stations are located upstream of the major irrigation areas (e.g. deltas of Ebro, Rhone, Axios) as noted by Ludwig et al. (2004).
4.3 CO2fluxes from rivers and freshwater systems
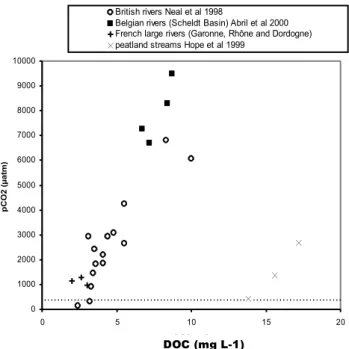
In the EU-25, freshwater systems are net sources of CO2to the atmosphere. Except for a few cases occurring season-ally, CO2super-saturation in the water generally prevails in streams (Hope et al., 2001; Billet et al., 2004), lakes (Cole et al., 1994), rivers (Kempe, 1982; Jones and Mulholland 1998; Abril et al., 2000; Cole and Caraco 2002), and estu-aries (Frankignoulle et al., 1998; Abril and Borges 2004). Such high CO2 concentrations in continental waters corre-spond to either to CO2derived from soil respiration, followed by runoff and riparian transport, or to CO2derived from ox-idation of terrestrial organic carbon in the aquatic system it-self, by microbial respiration and photochemistry (Gran´eli et al., 1996; Jones and Mulholland, 1998; Abril and Borges, 2004; Gazeau et al., 2005). Temperate rivers in western Eu-rope show a positive pCO2 vs. DOC relationship (Fig. 6)
0 1000 2000 3000 4000 5000 6000 7000 8000 9000 10000 0 5 10 15 20 DOC mg/l p C O 2 ( ! a tm )
British rivers Neal et al 1998
Belgian rivers (Scheldt Basin) Abril et al 2000 French large rivers (Garonne, Rhône and Dordogne) peatland streams Hope et al 1999
DOC (mg L-1)
Fig. 6. Relationship between pCO2and DOC in selected European river systems. British lowland rivers from Neal et al., 1998, Belgian lowland rivers (Scheldt watershed) from Abril et al., 2000, Large French rivers from Abril and Commarieu (Unpublished) (Garonne and Dordogne), and from Aucour et al., 1999 and Semp´er´e et al., 2000 (Rhˆone), Scottish Upland peat streams from Hope et al., 2001. The dotted line marks the atmospheric pCO2.
as a result of anthropogenic loads increasing the DOC, en-hancing aquatic respiration, and increasing pCO2 (Neal et al., 1998; Abril et al., 2000). In contrast, northern headwa-ters (e.g. Scottish peatlands) show low pCO2values and very high DOC content. This is due to the more recalcitrant nature of DOC leached from old peat soils, and to the rapid evasion of CO2to the atmosphere in these fast flowing waters (Hope et al., 2001; Billet et al., 2004). In lakes, DOC is negatively correlated with water residence time, showing the predomi-nant role of microbial and photochemical oxidation (Tranvik, 2005). In some temperate eutrophic rivers, a seasonal and sometimes annual uptake of atmospheric CO2 is observed (Fig. 6). Atmospheric carbon fixed by aquatic primary pro-duction is then transported downstream as organic carbon. The Loire River, for instance, transports large quantities of algal carbon which are mineralized in the estuarine turbidity maximum, leading to high CO2degassing (Meybeck et al., 1988; Abril et al., 2004). In fact, many European macrotidal estuaries behave as “hotspots” for CO2degassing, owing to the quantity of organic carbon they receive and to the long residence time of waters and suspended sediments (Frankig-noulle et al., 1998; Abril et al., 2002; Abril and Borges 2004). The relative scarcity of pCO2data in continental waters, and the high spatial and temporal variability, renders a bottom-up estimate at the EU-25 scale rather uncertain. In addition, the
surface areas of some ecosystems are uncertain and the high-est CO2fluxes occur in ecosystems with the smallest surface areas (estuaries and rivers).
4.4 River carbon transport and the European carbon bal-ance
The lateral transport of river carbon was compiled using the main European rivers database (Meybeck and Ragu, 1996) and extrapolated for the European seas catchment (8.16 106 km2)and the EU-25 on the basis of runoff, land cover and rock types similarities. Estuarine filters are in-cluded in this calculation (Abril and Meybeck, in prepara-tion). Southern, central and northern European rivers show marked diversity in export rates and carbon species (Ta-ble 3). Ta(Ta-ble 2 compares the order of magnitude of the lateral carbon transport in rivers with the outgassed CO2 flux. Fluxes of CO2from freshwater sub-ecosystems in peat-land streams, lakes, rivers, and estuaries are compiled from published pCO2distributions, using typical gas transfer ve-locities and information on surface areas of sub-ecosystems (Abril and Meybeck, in preparation). Because river transport is based on non-tidal river sampling and is calculated for the entrance of estuaries (Table 3), CO2degassing in freshwa-ters and in estuaries are distinguished in Table 2. Overall, European rivers transport laterally 53 Tg C yr−1 to estuar-ies, and they emit 90 Tg C yr−1of CO2 to the atmosphere (Table 2). A majority of the degassing occurs at northern latitudes. Despite their lower CO2 flux density, lakes con-tribute up to 35% of the total CO2freshwater degassing (ex-cluding wetlands and estuaries) owing to their large surface area (183 103 km2 in total) despite their lower CO2 flux density. CO2degassing from European estuaries has been previously estimated to 30–60 Tg C yr−1(Frankignoulle et al., 1998). This range is probably an overestimate for two reasons: (1) the surface area of European estuaries used by Frankigoulle et al., (112×103 km2)was much higher than recent estimates (36×103km2)from the Global Lakes and Wetlands Database of Lehner and D¨oll (2004), and (2) the investigated estuaries were mainly macrotidal, wherein net heterotrophy and CO2 degassing were favored (Abril and Borges 2004; Borges et al., 2006). Little or no CO2 data are available for fjords, fj¨ards, deltas and coastal lagoons. Scaling up the available CO2 flux estimates to the surface area of coastal wetlands and estuaries from Global Lakes and Wetlands Database gives a CO2source estimate of 10– 20 Tg C yr−1. This value is similar to the estimate of organic carbon transported by European rivers up to the estuarine fil-ter of 20 Tg C yr−1(Table 3).
P. Ciais et al.: Lateral fluxes carbon Europe 1267
Table 3. Fluxes and origin of river carbon fluxes reaching the continental shelf after estuarine filters. Irrigation is not taken into account. By convention a negative sign is given to fluxes representing C initially withdrawn from the atmosphere by plant CO2uptake.
Drainage area (103km2) Water flow (km3yr−1) River carbon (Tg C yr−1) Carbon yield (g C m−2yr−1) DOC (%) POC (%) DICa (%) Northern Europe (>50◦N) 2528 806 –13.6 –5.4 54.3 4.4 41.1 Temperate Europe (42–50◦N) 4699 1188 –24.5 –5.2 23.3 9.0 67.6 Southern Europe (<42◦N) 936 360 –10.2 –10.8 9.2 11.5 79.2 Total Europe 8163 2355 –48.3 –5.9 29.1 8.3 62.6
apercent of total carbon in DIC of atmospheric origin.
5 Coastal seas
Coastal seas receive nutrient and organic matter inputs from estuaries, and exchange water and matter with the open ocean waters across marginal slopes. For European coastal seas, the gross water fluxes across marginal slopes are 250–2000 times larger than the fresh water input (Huthnance, 2008). Carbon in coastal waters also depends on the carbon con-tent, which strongly decrease between estuaries and the open ocean. Nevertheless, the inputs of carbon from the open ocean to the coastal seas are significant because of the much higher water fluxes involved. In the North Sea, the inputs of DOC and DIC through the northern boundary of the North Atlantic Ocean are, respectively, 45 and 140 times higher than from estuaries. The input of the same species from the Baltic Sea is roughly equivalent to those from estuaries. The input of DOC and DIC from the English Channel are, respec-tively, 3 and 13 times higher than the inputs from estuaries (Thomas et al., 2005).
Unlike macrotidal estuaries which emit CO2to the atmo-sphere throughout the year (see Sect. 4.4), coastal seas usu-ally exhibit a distinct seasonal cycle of air-sea CO2 fluxes. They shift from a CO2source to a sink, depending on bio-logical activity. The coastal air-sea fluxes are hence predomi-nantly controlled by the net ecosystem production NEP. This is illustrated in Fig. 7 for the Southern Bight of the North Sea. This region acts as a sink of CO2in April–May during the phytoplankton blooms, and as a source during the rest of the year due to the degradation of organic matter. However, on an annual basis it is a net sink of atmospheric CO2 due to the seasonal decoupling of organic matter production and degradation, with a probable export of organic matter to the adjacent areas.
Besides NEP, air-sea CO2fluxes in coastal seas are also modulated by CaCO3 precipitation/dissolution, decoupling of carbon production and degradation within the water col-umn in presence of stratification, temperature and salinity
Fig. 7. Annual cycle (June 2003–May 2004) of net ecosystem pro-duction (NEP in m g C m-2 d-1), air-sea CO2 fluxes (FCO2 in m g C m-2 d-1) and the partial pressure of CO2(pCO2)in the Southern Bight of the North Sea (adapted from Schiettecatte et al., 2006).
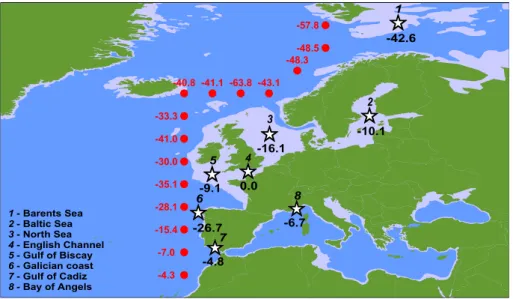
changes, Revelle factor, exchange of water with adjacent aquatic systems, water residence times (Borges et al., 2005, 2006). Figure 8 shows the annually integrated air-sea CO2 flux of various European coastal seas. The spatial hetero-geneity is clearly apparent. Seasonal patterns also differ from one coastal sea to another (Borges et al., 2005, 2006). In gen-eral, we estimate that the European coastal seas are a net CO2 sink of atmospheric of 68 Tg C yr−1, with an uncertainty of 20%. This value is equivalent to 60% of the continental wide European carbon sink of 111±279 Tg C yr−1 (Janssens et al., 2005).
1268 P. Ciais et al.: Lateral fluxes carbon Europe -4.3 -7.0 -15.4 -28.1 -35.1 -30.0 -41.0 -33.3 -48.5 -57.8 -40.8 -41.1 -63.8 -43.1 -48.3 6 7 1 2 3 4 5 8 -42.6 -10.1 -16.1 0.0 -9.1 -26.7 -4.8 -6.7 - Barents Sea - Baltic Sea - North Sea - English Channel - Gulf of Biscay - Galician coast - Gulf of Cadiz - Bay of Angels 1 2 3 4 5 6 7 8
Figure 5 – Compilation of annually integrated air-sea CO2 (gC m-2 yr-1) fluxes in
European coastal seas (stars and black numbers) (adapted from Borges et al. 2006) and adjacent open ocean grid nodes from the Takahashi et al. (2002) climatology (red circles and numbers).
Fig. 8. Compilation of annually integrated air-sea CO2(g C m−2yr−1)fluxes in European coastal seas (stars and black numbers) (adapted from Borges et al., 2006) and adjacent open ocean grid nodes from the Takahashi et al. (2002) air-sea flux climatology (red circles and numbers).
6 Discussion
6.1 Lateral carbon transport at diverse scales
The carbon budget of a continent is more complex than just the sum of photosynthesis, respiration, combustion, and an-thropogenic fluxes. Key processes transport carbon away from ecosystems where it was fixed by photosynthesis, with resultant increased variability in estimates for temporal stor-age and transformation. Carbon can be transported hori-zontally over long distances (100–1000 km), but eventually becomes oxidized and is released back to the atmosphere as CO2, thus closing the cycle initiated by photosynthe-sis. This is illustrated in Fig. 1 for three lateral transport processes: crop and wood product trade, reduced carbon compounds atmospheric transport and river carbon fluxes. Within the EU-25 territory, lateral transport creates and ac-centuates regional imbalances between CO2sinks and CO2 sources. At the continental level, the transport of carbon by rivers, by trade and by the atmospheric RCC fluxes results in a net CO2 sink, balanced by a source elsewhere in the world. In atmospheric CO2flux inversions, ignoring the pat-terns of CO2fluxes due to lateral transport may bias the in-ferred continental-scale flux. When comparing different ap-proaches to quantify regional carbon budgets, methods based on carbon stock changes (forest biomass and soil carbon in-ventories) will have to be corrected from lateral fluxes in or-der to be compared with methods based on CO2flux observa-tions (eddy covariance, atmospheric inversions). At the con-tinental scale, the correction of carbon stocks changes into CO2fluxes, is of the same magnitude as the mean CO2flux estimate itself (Table 2)! At the local scale, due to
imbal-ance between respiration and photosynthesis, this correction can be very large as well, especially over croplands and man-aged forests from which carbon is harvested. At the regional scale, the impact of the trade of food and wood products on CO2fluxes is diverse. Northern countries tend to be larger sinks and southern countries larger sources of CO2, due to food and wood trade.
The main implication of lateral carbon fluxes in the context of carbon trading is that measurement of vertical CO2fluxes exchanged with the atmosphere do not exactly match mea-surement of ecosystem stock changes. The question is thus to assess the fate of this missing carbon entrained in lateral transport circuits. Carbon transported in food trade will be oxidized in a year, and should not be counted as a sink glob-ally. A fraction of carbon transported in wood trade will form a long-term sink into long-lived products. Should this carbon sink be credited to the host country or to the country of origin for the wood? For instance, a given carbon credit could be attached to the exported wood. A fraction of the carbon trans-ported by rivers originates from rocks, being part of the slow geological carbon cycle. This background flux should cor-respond to no carbon credit. The remainder of river carbon originates from ecosystems, but can have different lifetimes through the river filters, being either degassed to the atmo-sphere within less than a year, or sequestered in long-lived organic sediments. Our calculations suggest that a minimum fraction of 70% of the ecosystem carbon transported by Eu-ropean rivers is returned rapidly to the atmosphere (Table 2).
6.2 Lateral carbon fluxes at the continental level
At the continental level, food and forest product trade fluxes result only in a small net source of CO2to the atmosphere
P. Ciais et al.: Lateral fluxes carbon Europe 1269
(24 Tg C yr−1in Table 2). This is because the gross fluxes of import implying a CO2source, and the one of export imply-ing a CO2sink where the exported biomass is grown, are ap-proximately in balance. We found that the gross flux of car-bon released to the atmosphere in the form of RCC is large (185 Tg C yr−1), about 15% of the annual fossil fuel CO2 emissions in EU-25. The impact of RCC on the net carbon balance of Europe is complex (Table 2) because a fraction of the RCC emissions is rapidly oxidized into CO2 in the boundary layer, while another fraction is re-deposited at the surface. Overall, we estimate that RCC cause a net carbon source of 76 Tg C yr−1over the continent but correspond to a net CO2sink of 61 Tg C yr−1. This difference in sign il-lustrates the fact that C fluxes differ significantly from CO2 fluxes. The riverine transport of atmospheric carbon from ecosystems into the estuaries must be fueled at steady state by a corresponding plant CO2uptake of 160 Tg C yr−1. The magnitude of this CO2uptake is large when compared to the net carbon storage of European ecosystems of 111 Tg C yr−1, Janssens et al. (2003). A large fraction (76%) of carbon transported by rivers is outgassed to the atmosphere in wa-terscapes or buried in lakes, dam and estuarine sediments, while the rest is delivered to inner estuaries. At the level of estuaries, a further outgassing of CO2will occur. Overall, we estimate that the river transport of carbon implies a net CO2 sink over ecosystems at the continental scale (60 Tg yr−1in Table 2) while almost the same amount gets exported to the oceans in a dissolved or particulate form (Table 2). The rea-son why the land CO2sink does not match exactly the export flux exported to the ocean is because a small fraction of the river carbon is coming from rocks (Table 2).
6.3 Coastal seas and lateral carbon fluxes
We included coastal seas in the analysis, because they re-ceive a “lateral” carbon flux from the continents and because coarse-resolution atmospheric inversions encompass coastal seas in their estimate of what is usually called the European CO2 flux. European coastal seas are net sinks for atmo-spheric CO2, in the range of 100 Tg C yr−1. This coastal CO2 sink is comparable in magnitude to the terrestrial car-bon uptake by ecosystems (111±279 Tg C yr−1 , Janssens et al., 2003). Coastal seas are CO2sinks despite the fact that they receive a flux of carbon from rivers of 53 Tg C yr−1 (Table 3). This is because the fluxes exchanged with the adjacent open oceans are controlling the budget of coastal seas. The CO2fluxes of coastal seas are significantly differ-ent from those in the adjacdiffer-ent open ocean (from Takahashi et al., 2002). The latter is commonly used in atmospheric CO2 inversion models, which likely will lead to a significant (but not yet quantified) bias in the flux estimates derived by these models. In particular, large biases are expected for terrestrial regions adjacent to extensive coastal seas, such as the Gulf of Biscay and the North Sea.
7 Conclusions
The lateral carbon fluxes induced by crop and forest prod-uct trade, atmospheric oxidation and atmospheric transport of RCC and river transport are important contributors to the carbon budget of EU-25, at the regional and continental level. At the continental level, we estimate that lateral transport fluxes amount to 165 Tg C yr−1, including the carbon sink of coastal seas. Most of this lateral flux consists of RCC emit-ted to the atmosphere and exporemit-ted out of Europe by winds. The RCC emission requires a CO2photosynthetic uptake of equivalent magnitude, hence being larger than the biomass accumulation in forests deduced from inventories. Including this CO2photosynthetic uptake which is used to make RCC, doubles the imbalance between photosynthesis and ecosys-tem respiration of European forests. In this work, we only attempted to estimate lateral transport processes at the con-tinental level, but these fluxes should also be taken into ac-count at the site and regional levels, for instance to reconcile eddy covariance estimates of the CO2 fluxes and biometric measurements of changes in biomass and soil carbon stocks. This work also demonstrates that a substantial amount of car-bon is displaced in proportion to the NPP, roughly about 10% of the NPP of the EU-25 territory.
Lateral carbon transport may also explain why inverse modeling estimates of the CO2sink are nearly always sys-tematically higher than forest inventory numbers of carbon stock changes. Maps of CO2sinks required to match lateral transport fluxes should be accounted for in inversion studies, for instance by prescribing an adapted a priori flux structure. In future work, investigations of lateral carbon fluxes should also reflect changes in economic and land use drivers in the context of implications for future climate change.
Acknowledgements. The authors wish to acknowledge sup-port from the CARBOEUROPE Integrated Project, and the CARBOEUROPE-GHG Concerted Action, both projects funded by the EU.
Edited by: J.-P. Gattuso
References
Abril, G. and Borges, A. V.: Carbon dioxide and methane emis-sions from estuaries. In Greenhouse Gas Emisemis-sions: Fluxes and Processes. Hydroelectric Reservoirs and Natural Environments, edited by: Tremblay, A., Varfalvy, L., Roehm, C., and Garneau, M., Environmental Science Series, Springer-Verlag, Berlin, Hei-delberg, New York, 187–207, 2004.
Abril, G., Etcheber, H., Borges, A. V., and Frankignoulle, M.: Ex-cess atmospheric carbon dioxide transported by rivers into the Scheldt Estuary. Comptes Rendus de l’Acad´emie des Sciences, S´erie IIA 330, 761–768, 2000.
Abril, G., Nogueira, M., Etcheber, H., Cabec¸adas, G., Lemaire, E., and Brogueira, M. J.: Behaviour of organic carbon in nine
contrasting European estuaries. Estuarine, Coastal and Shelf Sci-ence, 54, 241–262, 2002.
Anthoni, P., Freibauer, A., Kolle, O., and Schulze, E.-D.: Winter wheat carbon exchange in Thuringia, Germany, Agricultural and Forest Meteorology, 121, 55–67, 2004.
Aucour, M. A., Sheppard, S. M. F., Guyomar, O. and Wattelet, J.: Use of13C to trace origin and cycling of inorganic carbon in the Rhˆone river system, Chemical Geology, 159, 87–105, 1999. Aumont, O., Orr, J. C., Monfray P., Ludwig, W., Amiotte-Suchet, P.
and Probst, J. L.: Riverine-driven interhemispheric transport of carbon, Glob. Biogeochem. Cy., 15, 393–405, 2001.
Billett, M. F., Palmer, S. M., Hope, D., Deacon, C., Storeton-West, R., Hargreaves, K. J., Flechard, C., and Fowler, D.: Link-ing land-atmosphere-stream carbon fluxes., Global Biogeochem. Cy., 18(1), 1–12, 2004.
Borges, A. V., Delille, B., Schiettecatte, L. S., Gazeau, F., Abril, A., and Frankignoulle, M.: Gas transfer velocities of CO2in three European estuaries (Randers Fjord, Scheldt and Thames), Lim-nol. Oceanogr., 49(5), 1630–1641, 2004.
Borges, A. V.: Do we have enough pieces of the jigsaw to integrate CO2fluxes in the Coastal Ocean?, Estuaries, 28(1), 3–27, 2005. Borges, A. V., Delille, B., and Frankignoulle, M.:
Budget-ing sinks and sources of CO2 in the coastal ocean: Diver-sity of ecosystems counts., Geophys. Res. Lett., 32, L14601, doi:10.1029/2005GL023053, 2005.
Borges, A. V., Schiettecatte, L. S., Abril, G., Delille, B., and Gazeau, F.: Carbon dioxide in European coastal waters, Estu-arine Coastal and Shelf Science, 70, 375–387, 2006.
Ciais, P., Bousquet, P. Freibauer, A., and Naegler, T.: On the hori-zontal displacement of carbon associated to agriculture and how it impacts atmospheric CO2gradients, Global Biogeochem. Cy., 21, GB2014, doi:10.1029/2006GB002741, 2007.
Cole, J. J. and Caraco, N. F.: Carbon in catchments: connecting terrestrial carbon losses with aquatic metabolism, Marine Fresh-water Res. 52, 101–110, 2001.
Cole, J. J., Caraco, N. F., Kling, G. W., and Kratz., T. W.: Carbon dioxide supersaturation in the surface waters of lakes, Science, 265, 1568–1570, 1994.
CORINE Land cover: EEA online publications: http://reports.eea. eu.int/COR0-landcover/en., 2000.
Enting, I. G. and Mansbridge, J. V.: Latitudinal Distribution of Sources and Sinks of CO2– Results of an Inversion Study, Tel-lus, 43B, 156–170, 1991.
FAO, Food and Agriculture Organization Agricultural Database, in http://apps.fao.org/page/collections?subset=agriculture, 2004. Folberth, G., Hauglustaine, D., Ciais, P., and Lathi`ere, J.: On the
role of atmospheric chemistry in the global CO2budget, Geo-phys. Res. Lett., 32, L08801, doi:10.1029/2004GL021812, 2005. Frankignoulle M., Abril, G., Borges, A., Bourge, I., Canon, C., Delille, B., Libert, E., and Th´eate, J. M.: Carbon dioxide emis-sion from European estuaries., Science, 282, 434–436, 1998. Gazeau, F., Gattuso, J. P., Middelburg, J. J., Brion, N., Schiettecatte,
L.-S., Frankignoulle, M., and Borges, A. V.: Planktonic and whole system metabolism in a nutrient-rich estuary (the Scheldt Estuary), Estuaries, 28(6), 868–883. 2005.
Graneli, W., Lindell, M., and Tranvik L.: Photo-Oxidative Produc-tion of Dissolved Inorganic Carbon in Lakes of Different Humic Content., Limnol. Oceanogr., 41, 698–706, 1996.
Goudriaan, J., Groot, J. R., and Uithol, P. W. J.: Productivity of
Agro-ecosystems, in Terrestrial Global Productivity, edited by: Roy, J., Saugier, B. and Mooney, H. A., Academic Press, 2001. Grosbois, C., N´egrel, P., Fouillac C., and Grimaud, D.: Dissolved
load of the Loire River: chemical and isotopic characterization., Chem. Geol., 170, 179–201, 2000.
Hauglustaine, D. A., Hourdin, F., Jourdain, L., Filiberti, M. A., Walters, S., Lamarque, J. F., and Holland, E. A.: Interac-tive chemistry in the Laboratoire de M´et´eorologie Dynamique general circulation model: Description and background tropo-spheric chemistry evaluation, J. Geophys. Res., 109, S=D04314, doi:10.1029/2003JD003957, 2004.
Hope, D., Palmer, S., Billet, M., and Dawson, J. J. C.: Carbon diox-ide and methane evasion from a temperate peatland stream., Lim-nol. Oceanogr., 46, 847–857, 2001.
Huthnance, J. M.: North-East Atlantic margins, in: Carbon and Nutrient Fluxes in Global Continental Margins, edited by: Liu, K. K., Atkinson, L., Quinones, R., and Talaue-McManus, L., Springer-Verlag, New York, 2008.
Imhoff, M. L., Bounoua, L., Ricketts, T., Loucks, C., Harriss,R., and Lawrence, W. T.: Global patterns in human consumption of net primary production, 429, 870–873, 2004.
Janssens, I. A., Freibauer, A., Ciais, P., Smith, P., Nabuurs, G., Schlamadinger, B., Hutjes, R., Schulze, E., Ceulemans, E., Valentini, R., and Dolman, J.: Europe’s terrestrial biosphere ab-sorbs 7 to 12% of European Anthropogenic emissions, Science, 300, 1538–1542, 2003.
Janssens, I. A., Freibauer, A., Schlamadinger, B., Ceulemans, R., Ciais, P., Dolman, A. J., Heimann, M., Nabuurs, G. J., Smith, P., Valentini, R., Schulze, E. D.: The carbon budget of terrestrial ecosystems at country-scale – a European case study, Biogeo-sciences, 2, 15–26, 2005,
http://www.biogeosciences.net/2/15/2005/.
Jones, J. B. and Mulholland, P. J.: Carbon dioxide variation in a hardwood forest stream: an integrative measure of whole catch-ment soil respiration, Ecosystems, 1, 183–196, 1998.
Kempe, S.: Long term record of CO2pressure fluctuations in fresh-waters., Mitteilungen aus dem Geologish-Pal¨aontologishen, In-stitut der Universit¨at Hamburg, 52, 91–332, 1982.
Kempe, S.: Sinks of the anthropogenically enhanced carbon cycle in surface fresh waters, J. Geophys. Res., 89, 4657–4676, 1984. Kesselmeier, J., Ciccioli, P., Kuhn, U., Stefani, P., Biesenthal, T.,
Rottenberger, S., Wolf, A., Vitullo, M., Valentini, R., Nobre, A., Kabat, P., and Andreae, M. O.: Volatile organic carbon com-pound emissions in relation to plant carbon fixation and the ter-restrial carbon budget, Global. Biogeochem. Cy., 16, 1126–1134, 2005.
Lafont, S., Kergoat, L., Dedieu, G., Chevillard, A., Karstens, U., and Kolle, O.: Spatial and temporal variability of land CO2 fluxes estimated with remote sensing and analysis data over west-ern Eurasia, Tellus, 54B, 820–833, 2002.
Liski, J., Palosuo, T., Peltoniemi, M., and Siev¨anen, R.: Carbon and decomposition model Yasso for forest soils., Ecological Mod-elling, 189(1–2), 168–182, 2005.
Ludwig, W., Meybeck, M., and Abousamra, F.: Riverine trans-port of water, sediments and pollutants to the Mediterranean Sea, in: Medit. Action Technical Report Series #141, UNEP/MAP Athens, 111 pp., 2003.
Meybeck, M.: Riverine transport of atmospheric carbon: sources, global typology and budget, Water, Air Soil Pollution, 70, 443–
P. Ciais et al.: Lateral fluxes carbon Europe 1271
464, 1993.
Meybeck, M.: Global distribution and behaviour of carbon species in world rivers, in: Soil Erosion and Carbon dynamics, edited by: Roose, E., Lal, R., Feller, C., Barth`es, B., and Stewart, B. A., Advances in Soil Science Series, CRC Boca Raton, 209–238, 2005.
Meybeck, M. and Ragu, A.: River Discharges to the Oceans, An assessment of suspended solids, major ions, and nutrients, in: Environment Information and Assessment Rpt. UNEP, Nairobi, p. 250, 1996.
Meybeck, M., Cauwet, G., Dessery, S., Somville, M., Gouleau, D., and Billen G.: Nutrients (Organic C, P, N, Si) in the eutrophic river Loire and its estuary. Estuarine Coastal Shelf Sciences, 27, 595–624, 1988.
Myneni, R., Dong, J., Tucker, C., Kaufmann, R. K., Kauppi, P. E., Uski, J., Zhou, L., Alexeyev, V., and Hughes, M. K.: A large carbon sink in the woody biomass of Northern forests, Proc. Natl. Acad. Sciences, 14 784–14 789, 2001.
Neal, C., House, W. A., Jarvie, H. P., and Eatherall, A.: The signif-icance of dissolved carbon dioxide in major rivers entering the North Sea, The Science of the total environment 210/211, 187– 203, 1998.
Pacala, S. W., Hurtt, G. C., Baker, D., Peylin, P., Houghton, R. A., Birdsey, R. A., Heath, L., Sundquist, E. T., Stallard, R. F., Ciais, P., Moorcroft, P., Caspersen, J. P., Shevliakova, E., Moore, B., Kohlmaie, G., Holland, E., Gloor, M., Harmon, M. E., Fan, S.-M., Sarmiento, J. L., Goodale, C. L., Schimel, D., and Field, C. B.: Consistent Land- and Atmosphere-Based US Carbon Sink Estimates, Science, 292, 2316–2320, 2001.
Peylin, P., Bousquet, P., LeQu´er´e, C., Sitch, S., Friedlingstein, P., McKinley, G. A., Gruber, N., Rayner, P., and Ciais, P.: Multiple constraints on regional CO2 fluxes variations over land and oceans, Global Biogeochem. Cy., 19, GB1011, doi:10.1029/2003GB002214, 2005.
Prentice, I. C., Farquhar, G. D., Fasham, M. J. R., et al.: The car-bon cycle and atmospheric carcar-bon dioxide, in: Climatic Change 2001: The Scientific Basis, Contribution of Working Group I to the Third Assessment Report of the Intergovernmental Panel on Climate Change, 185–225, Cambridge University Press, Cam-bridge, 2001.
Ramankutty, N. and Foley, J.: Characterizing patterns of global land use: An analysis of global croplands data, Global Biogeochem. Cy., 12, 667–685, 1998.
Sarmiento, J. L. and Sundquist, E. T.: Revised budget for the oceanic uptake of anthropogenic carbon dioxide, Nature, 356, 589–593, 1992.
Schiettecatte, L. S., Thomas, H., Bozec, Y., and Borges, A. V.: High temporal coverage of carbon dioxide measurements in the South-ern Bight of the North Sea, Marine Chemistry, Marine Chem-istry, 106(1–2), 161–173, 2007.
Sobek, S., Algesten, G., Bergstrom, A.-K., Jansson, M., Tranvik, L. J.: The catchment and climate regulation of pCO2in boreal lakes., Global Change Biology, 9, 630–41, 2003.
Takahashi, T., Sutherland, S. C., Sweeney, C., Poisson, A., Metzl, N., Tilbrook, B., Bates, N. R., Wanninkhof, R., Feely, R. A., Sabine, C., Olafsson, J., and Nojiri, Y.: Global sea-air CO2flux based on climatological surface ocean pCO2, and seasonal bi-ological and temperature effects, Deep-Sea Res. II, 49(9–10), 1601–1622, 2002.
Tans, P. P., Fung, I. Y., and Enting, I. G.: Storage versus flux bud-gets: the terrestrial uptake of CO2during the 1980s, In Biotic feedbacks in the global system, edited by: Woodwell, G. M. and Mackenzie, F. T., 351–366, Oxford University Press, New York, 1995.
Thomas, H., Bozec, Y., De Baar, H. J. W., Elkalay, K., Frankig-noulle, M., Schiettecatte, L.-S., and Borges, A. V.: The carbon budget of the North Sea., Biogeosciences, 2(1), 87–96, 2005. Tranvik, L.: Terrestrial dissolved organic matter – a huge but not
unlimited subsidy to aquatic ecosystems, Proceedings of ASLO summer meeting, Santiago de Compostella, 19–24 June 2005. V¨or¨osmarty, C. J., Meybeck, M., Fekete, B., Sharma, K., Green,
P., and Syvitski, J.: Anthropogenic sediment retention: major global-scale impact from the population of registered impound-ments, Global Planetary Changes, 39, 169–190, 2003.
Wanninkhof, R., Mulholl, P. J., and Elwood, J. W.: Gas exchange rates for a first order stream determined with deliberate and nat-ural tracers, Water Resources Res., 26, 1621–1630, 1990.