HAL Id: hal-01301426
https://hal.archives-ouvertes.fr/hal-01301426
Submitted on 12 Apr 2016HAL is a multi-disciplinary open access archive for the deposit and dissemination of sci-entific research documents, whether they are pub-lished or not. The documents may come from teaching and research institutions in France or abroad, or from public or private research centers.
L’archive ouverte pluridisciplinaire HAL, est destinée au dépôt et à la diffusion de documents scientifiques de niveau recherche, publiés ou non, émanant des établissements d’enseignement et de recherche français ou étrangers, des laboratoires publics ou privés.
Biophysical modelling predicts ventricular tachycardia
inducibility and circuit morphology: A combined clinical
validation and computer modelling approach
Zhong Chen, Rocío Cabrera-Lozoya, Jatin Relan, Manav Sohal, Anoop
Shetty, Rashed Karim, Hervé Delingette, Jaswinder Gill, Kawal Rhode,
Nicholas Ayache, et al.
To cite this version:
Zhong Chen, Rocío Cabrera-Lozoya, Jatin Relan, Manav Sohal, Anoop Shetty, et al.. Biophysical modelling predicts ventricular tachycardia inducibility and circuit morphology: A combined clinical validation and computer modelling approach. Journal of Cardiovascular Electrophysiology, Wiley, 2016, 27 (7), pp.851-860. �10.1111/jce.12991�. �hal-01301426�
Full title:
Biophysical modelling predicts ventricular tachycardia inducibility and circuit morphology: A combined clinical validation and computer modelling approach
Short title:
VT stimulation in silico
Authors:
Zhong Chen MBBS1,2, Rocio Cabrera-lozoya PhD 3, Jatin Relan PhD3, Manav Sohal
MBBS1,2, Anoop Shetty MD1,2, Rashed Karim PhD1, Herve Delingette PhD3, Jaswinder Gill MD1,2, Kawal Rhode PhD1, Nicholas Ayache PhD3, Peter Taggart DSc4, C Aldo Rinaldi MD1,2, Maxime Sermesant PhD3, Reza Razavi MD1,2
Institutions:
1. Kings College London, London, United Kingdom
2. Guy’s and St Thomas’ Hospital, London, United Kingdom 3. Inria, Asclepios Team, Sophia Antipolis, France
4. University College Hospital, London, United Kingdom
Corresponding author and address
Dr Zhong Chen, King's College London, Department of Imaging Science and Biomedical Engineering, The Rayne Institute, 4th Floor Lambeth Wing, St. Thomas' Hospital Campus, London SE1 7EH
E-mail: zhong.chen@kcl.ac.uk Tel: +44 (0) 79 8061 2080
Word count: Abstract 248 words. Main text 3451 (excluding references).
Author contributions:
All authors contributed to research design, analysis of the data, drafting or revising and approval of the manuscript
Funding: ZC received an investigator-led research grant from Medtronic Ltd and Clinical
Abstract
Introduction: Computational modelling of cardiac arrhythmogenesis and arrhythmia
maintenance has made a significant contribution to the understanding of the underlying mechanisms of arrhythmia. We hypothesized that a cardiac model using personalized electro-anatomical parameters could define the underlying ventricular tachycardia (VT) substrate and predict re-entrant VT circuits. We used a combined modelling and clinical approach in order to validate the concept.
Methods and results: Non-contact electroanatomic mapping studies were performed in
seven patients (5 ischemics, 2 non-ischemics). Three ischemic cardiomyopathy patients underwent a clinical VT stimulation study. Anatomical information was obtained from cardiac magnetic resonance imaging (CMR) including high-resolution scar imaging. A simplified biophysical mono-domain action potential model personalized with the patients’ anatomical and electrical information was used to perform in silico VT stimulation studies for comparison. The personalized in silico VT stimulations were able to predict VT inducibility as well as the macroscopic characteristics of the VT circuits in patients who had clinical VT stimulation studies. Patients with positive clinical VT stimulation studies had wider
distribution of action potential duration restitution curve (APD-RC) slopes and APDs than patient 3 with a negative VT stimulation study. The exit points of re-entrant VT circuits encompassed a higher percentage of the maximum APD-RC slope compared to the scar and non-scar areas, 32%, 4% and 0.2% respectively. Conclusions: VT stimulation studies can be simulated in silico using a personalized biophysical cardiac model. Myocardial spatial
heterogeneity of APD restitution properties and conductivity may help predict the location of crucial entry/exit points of re-entrant VT circuits.
Keywords: Ventricular tachycardia; computer modelling; APD restitution; conductivity;
Introduction
Implantable cardioverter defibrillator (ICD) shocks are a cause of substantial morbidity in patients with ventricular arrhythmias.1 Radiofrequency ablation is increasingly used to treat ventricular tachycardia (VT) to reduce ICD discharges and improve patient quality of life and mortality.2,3 The current arrhythmia risk stratification strategy is imperfect and is determined
largely on left ventricular (LV) function with not all high-risk patients receiving an ICD, and those who received ICDs never experiencing appropriate therapies. Similarly ablation of VT is technically challenging with a recurrence rate of up to 40% with a lack of clinical
consensus on the optimal ablation strategy.4 Better risk stratification and higher ablation success rates would potentially improve patient outcomes. There is therefore a need to identify individuals at high risk of developing ventricular arrhythmia and the arrhythmia substrate in order to guide the optimal ablation strategy.5
Computational modelling of cardiac arrhythmogenesis and arrhythmia maintenance can be used to contribute to the understanding of the underlying mechanisms of arrhythmia. Image-based computational models have incorporated cardiac structural information such as
heterogeneity of scars into such simulations.6-8 However, the heterogeneity in action potential
duration (APD) restitution, the adaptation of APD as a function of the cardiac cycle length, has a crucial role in arrhythmogenesis.9,10 The integration of both personalized structural and functional data has not previously been performed.
We hypothesized that, using personalized electrophysiological mapping data and structural anatomical data acquired respectively from electrophysiology studies and high-resolution cardiac magnetic resonance imaging (CMR) we could develop a patient-specific biophysical model to perform in silico VT stimulation studies to assess inducibility of VT and circuit
morphology.
Methods
Patients
Patients under consideration for primary prevention ICD on the basis of their LV function were prospectively invited to participate in the study following local research ethics committee approval. Seven patients, 5 with ischaemic cardiomyopathy (ICM) and 2 with non-ischaemic dilated cardiomyopathy (NICM) gave written consent prior to study inclusion.
CMR Acquisition and Image Processing
CMR was performed on a Philips Achieva 1.5T scanner using a 32 channel cardiac coil. All 7 patients completed CMR morphological and volumetric assessment as well as high-resolution scar characterization by late-gadolinium-enhanced (LGE) imaging with acquired voxel size 1.3x1.3x2.6mm3. A personalized 3D model of the ventricles was derived from the CMR images: a tetrahedral mesh was generated from the binary mask of the ventricles. The LV myocardial scar distribution was segmented using signal intensity (SI) based analysis from the high-resolution LGE images to distinguish between scar core and gray zone. Each element of the mesh was labelled (healthy/scar core/gray zone).
(Details of CMR image acquisition protocol and imaging processing data is provided in the online supplemental material)
Invasive Electrophysiological Study with Electroanatomic Mapping and Signal Processing
LV electroanatomic mapping (EAM) was performed using a multi-electrode array catheter (EnSite Velocity System, St Jude Medical, MN, USA) in all 7 patients. The chamber
catheter. Three patients (patients 1-3) with ICM underwent a simultaneous VT stimulation study according to the Wellens protocol during the mapping study.11 Unipolar electrograms
(UEG) derived were filtered with a band-pass filter (10Hz/300Hz and 0.5Hz/30Hz) to optimize QRS complex and T wave detections. The depolarization times were detected within the QRS window and derived from the zero crossings of the laplacian of the measured UEGs, the repolarization times were detected within the ST window for the signals.9 The difference between the depolarization and repolarization times was used to estimate the activation recovery time (ARI) which is used as a surrogate marker for APD.12 The APD restitution curve (APD-RC) was estimated from steady-state RV pacing (500ms) with sensed pacing extras at progressively shorter coupling interval at a decrement of 20ms till 200ms or refractory period. The APD-RC was represented by a non-linear equation using a least-squares fit to the mono-exponential function as previously detailed on experimental and clinical data: a single APD-RC was fitted for each measured point from the EAM and the maximum APD was estimated as the asymptotic APD of the APD-RC when the diastolic interval tends to infinity.13,14
Construction of Personalized 3D Cardiac Model
Building on the framework that we have previously described and validated, the anatomical mesh was registered with the electrical information offline and used to generate a
personalized 3D cardiac model, which combines the benefits of an Eikonal (EK) model (fast and robust for conduction velocity (CV) personalization) and those of a simplified
biophysical mono-domain action potential Mitchell-Schaeffer (MS) model (well suited for personalising APD restitution properties).13-15 The MS model was personalized with the apparent conductivity (AC) values derived from the patient’s CV computed from the EAM data. AC is the diffusion coefficient that represents an intrinsic parameter of the cardiac tissue electrical conductivity in the electrophysiological cardiac model. AC (m2s-2) is proportional to
the product of the square of CV and a time constant parameter in the model.8 AC is used as an independent estimation of the intrinsic biophysical electrical conductivity property of the tissue rather than CV that could be dependent on the activation sequence and the shape of the propagation wave front. The process of building the models from the CMR and EAM data is illustrated in Figure 1.
(The estimation of the electrical parameters and computer modelling is described in detail in the Supplemental material: Computer modelling)
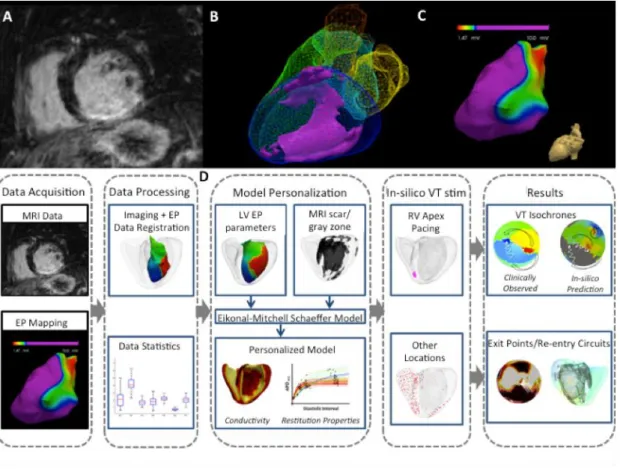
Figure 1
In silico VT Stimulation Study
In three patients (patients 1-3) with ICM, the personalized cardiac model was used to simulate a clinical VT stimulation study in silico in order to predict the initiation and maintenance of ventricular arrhythmia induced during clinical study. The simulated study was performed in accordance with the clinical study protocols that were carried out: the pacing stimuli were applied from the RV apex following the Wellens protocol. We also simulated the study from alternate pacing sites in the RV and LV that encompassed the basal and apical freewall/lateral/septum/anterior and inferior walls. The exit points identified from the clinical VT stimulation studies and the in silico simulations were characterized in terms of the spatial heterogeneities of the AC, APD restitution properties.
Statistical analysis
The electrical parameters consisted of multiple data points, each corresponding to a different location within the LV of an individual patient. The data were expressed by median and inter-quartile range (IQR) or mean and standard deviation. Continuous variables were compared using Median test. A p value < 0.05 was considered to be statistically significant. All statistics were performed using computer software SPSS Statistics, version 21, SPSS Inc.,
IBM, USA.
Results
All 7 patients underwent successful validation of the personalisation strategy of the computer cardiac model. Of these, 3 patients (ICM) underwent further clinical VT stimulation test in order to validate the accuracy of the personalized cardiac model in predicting VT substrate. Baseline patient characteristics and CMR findings are summarized in Table 1. During the clinical VT stimulation studies, patients 1 and 2 developed sustained monomorphic VT; patient 3 was non-inducible. All 7 patients were implanted with ICDs for primary prevention following clinical assessment. During a median follow-up period of 22months, IQR 9 months, patient 2 received appropriate ICD therapy for sustained VT.
Table 1
Heterogeneities in Apparent Conductivity (AC) and APD Restitution Properties
The IQRs of AC and APD restitution data representing the heterogeneities of these electrical parameters were calculated for each patient (shown in online supplementary Figure 1). The range of AC across the LV was comparable across the 7 patients. The median APD-RC slopes and maximum asymptotic APD for NICM patients was lower than that for ICM patients (p<0.01). Amongst the 3 patients who underwent a clinical VT stimulation study, patients 1 and 2 with positive clinical VT stimulation studies had APD-RC slopes IQRs of 1.50 and 1.02; and maximum asymptotic APD IQRs of 123ms and 66ms. These IQRs were greater than that of patient 3 with a negative clinical VT stimulation study; in whom the APD-RC slope IQR and APD IQR were 0.48 and 36ms, respectively.
qualitative assessment of the spatial heterogeneity of these parameters across the LV in Figure 2.
Figure 2
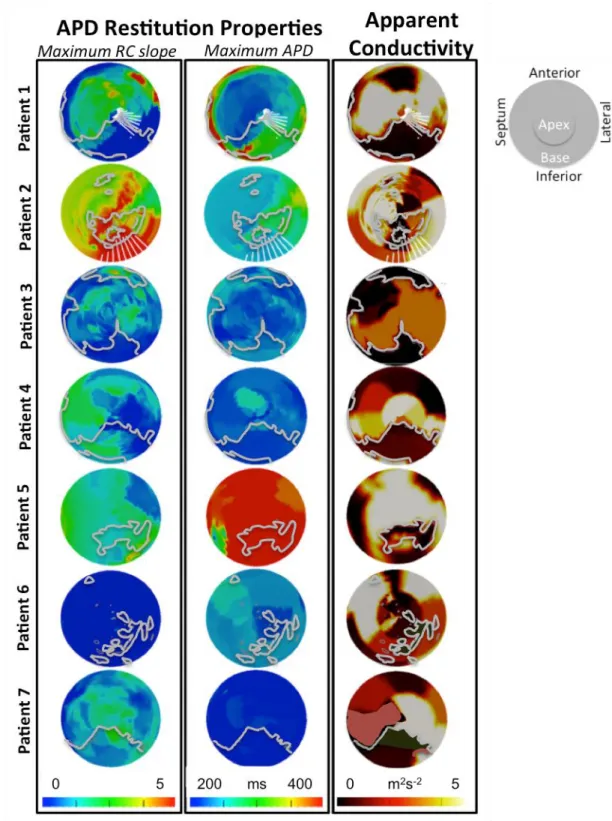
There appeared to be the same broad spatial heterogeneity in AC in all the study patients including the 2 patients with NICM who also had regions of low AC in areas without scars seen on CMR. However, there was a wide variation in the spatial heterogeneity of APD-RC properties across the cohort, with patients 1 and 2 showing the most heterogeneity.
Visually, the VT exit points that were observed during the clinical VT stimulation studies in patients 1 and 2 appear to be at the neighbouring regions with varying degree of APD-RC properties and AC. These VT exit points were in the scar border zone/gray zone as
determined by the LGE CMR scans. In order to explore the role of local spatial heterogeneity of electrical properties play in arrhythmogenesis we assessed the differences in AC, APD and APD-RC between neighbouring regions in LV (each region ≈ 3mm3) by evaluating the gradient of the parameters in polar coordinates in Figure 2. The gradient amplitude reflects how smooth or abrupt the transition is between values in the spatial domain. Using a
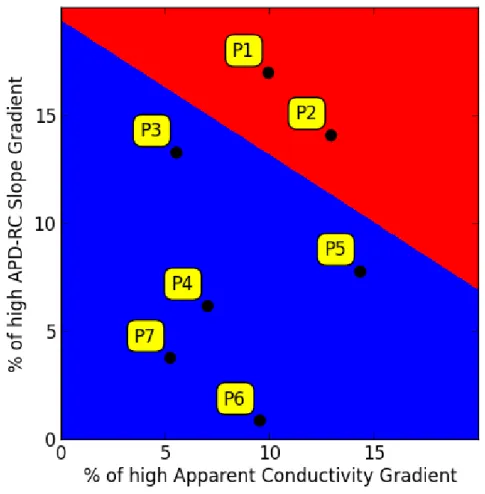
definition of “high gradient” being greater than the 90th percentile of the gradient range, the proportion of LV regions with high gradients was analysed for each patient. For each of the electrical parameters, AC, APD and APD-RC, there was no statistically significant difference in the number of elements with high gradients (≥ 90 percentile) between patients. However, patient (1 and 2) with inducible VT had a combined greater heterogeneity of both AC and APD-RC, shown in Figure 3.
Induction of VT and Clinically Observed Monomorphic VT Exit Points
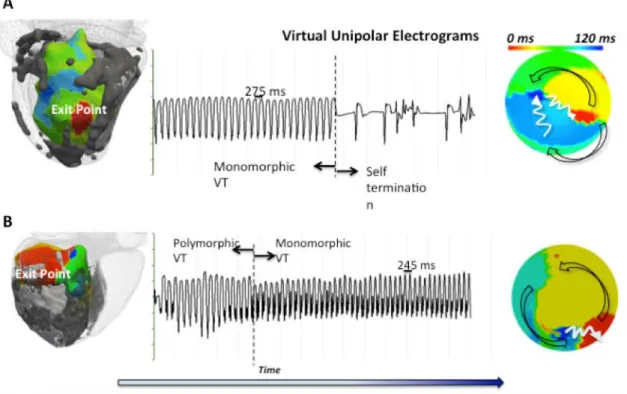
Patient 1 had induced sustained monomorphic VT (SMVT) with a cycle length (CL) of 275ms at Wellens’ stage 11. Patient 2 had induced SMVT with a cycle length of 245ms at Wellens’ stage 4. The patterns of activation for both re-entrant VT circuits are illustrated in Figure 4. Analysis of the UEG recording from the EAM showed a higher percentage of maximum APD-RC slope that is 2 standard deviation (SD) above the mean LV APD-RC slope at the observed exit points (32%) compared to the scar (4%) and non-scar regions (0.2%). The absolute values in APD and tissue conductivity between the three areas were not as distinct although the exit point values (APD: median 319ms, IQR 45ms; AC: median 3.4m2s-2, IQR 2.5m2s-2) appeared to lie between those of the scar (APD: median 385ms, IQR 136ms; AC: median 0.4m2s-2, IQR 2.1m2s-2) and non-scar regions (APD: median 305 IQR 49ms; AC: median 4.7m2s-2, IQR 2.4 m2s-2). It is possible that it is the heterogeneity in
regional tissue electrical properties distributions rather than the absolute value (mean or median) that may allow us to identify the exit points from other regions of the myocardium.
Figure 4
Comparison of Model-Predicted and Clinically-Observed Induced VT
Sustained monomorphic VT was induced in silico at stage 7 of the virtual Wellens protocol for Patient 1 and stage 5 for patient 2. Sustained VT was not inducible in silico for patient 3. LV polar plots of the clinical and virtual VT isochrones are illustrated in Figure 5A for comparison. Both macroscopic re-entrant VT circuit and exit points were matched between the clinical and simulated studies (shown in Figure 5A).
Figure 5
Three-Dimensional VT Circuit Visualization
zone across the LV wall, the computer model enabled the prediction of a 3D VT circuit as opposed to the 2D VT activation pattern observed by endocardial EAM. Computational simulation allowed this additional insight to the wave propagation within the myocardium. For patient 2, the activation wave front of the re-entrant VT is shown propagating in the region of the gray zone in Figure 5B. The estimated wave front path surrounds the scar core and lies within the scar border zone, entering from the endocardial surface, meandering within the ventricular wall, and exiting via the epicardial surface (shown in Figure 5B).
A comparison of clinically observed and predicted exits points in terms of anatomic location were made. We defined the exit region compassing anatomical points with an activation time within 10ms of the earliest activation. The distance between the clinically observed and simulated exit points was defined as the 3D Euclidean distance between the centres of both exit regions. A difference of 7mm and 8mm were found, respectively, for patients 1 and 2.
Simulated VT Stimulation from Additional Sites
VT stimulation study was also performed in silico by pacing from other sites than the RV apex used during the clinical study for patients 1 and 2. Different VT circuits with three additional exit points were observed in both patients. The exit points were located on the boundary of scar in the region of the gray zones from the CMR LGE images. Similar to the clinically observed exit points, they were mostly in the region of maximum APD-RC slope. The composite of different exit points are plotted in Figure 6 in terms of their APD restitution properties and AC.
Discussion
The present study provides new insights into the prediction of VT circuits using a biophysical model. The principal findings of our study are as follows: 1) the location of scar border zone (gray zone) on high-resolution CMR correlates with areas of abnormal measured and model derived electrical properties; 2) the VT exit points have a substantially higher percentage of tissue with steep APD-RC slopes compared to surrounding tissues; and combined tissues heterogeneity in APD-RC and CV may underlie the substrate for the inducibility of VT; 3) in
silico VT stimulation studies were able to predict inducibility of VT in patients at risk of
ventricular arrhythmia; 4) the characteristics of the modeled VT circuits correlated well with the clinically observed circuits in terms of cycle length, macroscopic activation patterns and VT exit sites.
Tissue Heterogeneity (admixture of scar and myocardium) co-location with Heterogeneity
in APD Restitution Properties and Tissue Conductivity
A correlation between the spatial heterogeneity in APD, APD-RC slopes and AC and the location of gray zone detected on high-resolution CMR supports the notion that myocardial scars can alter the regional restitution properties and provide potential substrate for
arrhythmia.16 Data from the two patients who developed sustained VT suggest that VT exit points are co-located with heterogeneous APD-RC slopes. Ciaccio et al. has demonstrated potential mechanisms using a geometric model that could account for this co-location between exit zones and conducting channels in terms of tissue conductivity.17 The presence of clumps of fibroblasts, although electrically non-excitable, results in a slowing of the electrical wave front propagation in the myocardial tissue in which they are embedded. Fibroblasts can modulate cellular ion channel remodelling and therefore tissue electrical properties through a variety of mechanisms including mechano-electric feedback via
stretch-activated ion channels, close coupling of nearby cardiac myocytes via connexin, and by altering surrounding myocardial fibres anisotropy.18 Some of these mechanisms have been
shown in vitro, but remains speculative in vivo. The suggested relationship between the degree of heterogeneity demonstrated by the electrical gradients between neighbouring tissue domains and the propensity for sustained ventricular arrhythmia is therefore likely being non-linear as observed in the present study. The present study supports the notion that potential successful ablation sites for VT lie in areas of heterogeneous tissue zones that can be identified with CMR.19,20
Heterogeneity in electrical properties have been observed in LV.9,10 Computation modelling have demonstrated that theoretically APD-RC slope >1 is needed to result in electrical
instability and initiate ventricular arrhythmia.21 In keeping with the observed tissue functional
heterogeneity at the VT exit points in the present study, others have also demonstrated that the heterogeneity in APD-RC slopes is needed for the initiation and stability of re-entry
VT.10,22 These prior studies did not have the benefit of high-resolution CMR scar information, and so could not explain the anatomical cause of this. Nash et al. speculated that regional stretch strain pattern resulting from ischemia might have led to electrical remodelling through mechano-electric feedback.10 It may well have been that these regions had areas of gray zone as they correlated to the territories of the diseased coronary arteries.
In silico VT stimulation studies in patients
Encouragingly the personalized cardiac models encompassing both anatomical and electrical properties were able to predict not only the inducibility of VT, but also the re-entrant VT circuit properties and anatomical locations of the substrate. The present study is unique in that, as well as anatomical and scar information it incorporated personalized functional data
including APD-RC properties and tissue conductivities into the patient-specific cardiac models. Previously, Arevalo H et al. suggested that VT dynamics were primarily governed by the geometric parameters of the scar-core and border zone using image-based computational VT modelling work.7 The present study highlighted the advantage of incorporating detailed geometric information gained from CMR, demonstrating the possibility of using high-resolution 3D scar data to help predict potential critical isthmus on the epicardial surface. This is important, as conventional mapping techniques used during ablative therapy are limited to two-dimensional geometry when the substrate of the VT circuit could be on the opposite side of the mapping surface.
Whilst we realize that CMR can provide important scar geometry that governs the substrate of re-entrant VT, we also recognize that the resolution of the current standard clinical CMR technique is limited (common voxel size 2x2x8mm3) in providing the level of spatial geometry details that we would like to see at the border zone. We believe that additional knowledge and understanding of patient-specific heterogeneities in local electrical parameters would assist in predicting the likely culprit conduction channels/isthmus, and not the
bystanders, that is critical to the clinical VT. We have performed additional sensitivity analysis using empirical electrical parameters instead of personalized patient-specific
electrical data in the two patients with positive clinical VT stimulation studies and found that using combined personalized electrical and image data can potentially improve the accuracy of VT inducibility and predictions regarding the location of exit zones predictions. VT was not inducible in Patient 1 using non-personalised empirical electrical parameters that also induced a different macroscopic VT circuit morphology from the one seen during the clinical study in Patient 2. The Euclidean distance between the centre of the clinical exit region and that predicted using non-personalized electrical parameters was 37mm, and with using
personalized electrical parameters it was 8mm. (See Supplemental Material: Personalized vs. non-personalized empirical electrical parameter) However, recognizing the small number of patients included in this analysis, a larger study would be necessary to help draw more reliable conclusions between using personalized vs. non-personalized electrical parameters.
Clinical application: Potential for Circuit Prediction using Personalized Computer
Models to Guide Ablation
Whilst cardiac modelling has been an active research area for decades, personalized cardiac modelling using patient-specific clinical data is in its infancy. In silico personalized models may offer significant clinical benefit in predicting the risk of ventricular arrhythmia in patients and guiding treatments including ICD implantation and VT ablation. Successful VT termination through ablation may be achieved when the critical isthmus is successfully interrupted with ablation lesions. If VT exit points can be predicted with biophysical models then this information may be used to guide ablation. Such models also offer additional flexibility as the model can simulate any combination of paced stimuli from different locations with varying pacing cycle lengths, which may not be feasible in clinical practice. Recently, Ashikaga et al. presented a retrospective study that found a good correlation between the predicted ablation sites and the actual target VT ablation sites at the scar border zone.23 We have indeed demonstrated that additional exit points can be induced from in silico VT stimulation studies, which could be potential targets for ablation. Our results suggest that patient-specific cardiac models may offer incremental clinical benefit in terms of ventricular arrhythmia risk stratification and in the planning and delivery of ablation strategies for re-entrant ventricular arrhythmias. Non-invasive body surface mapping could be incorporated to routine simple electrophysiology study to gain such personalized whole heart
electro-anatomic data in order to facilitate the translation of the biophysical cardiac model processing pipeline to clinical practice.24 A larger validation study can be performed in the secondary
prevention patient cohort when simple electrophysiology study can be performed via the cardiac rhythm management device (at time of device implant) with simultaneous body surface mapping recording to acquire the personalized APD, APD-RC slopes and AC data. This coupled with scar data acquired from CMR prior to device implant could generate personalized modelling, the outcome of which can then be further validated at the time of VT ablation prospectively in this secondary prevention cohort
Study limitations
Given the invasive nature of the study precludes analysis of a large number of patients, the study is limited by the small number of patients included with only a subset of patients undergoing a VT stimulation procedure. The electro-anatomical data are derived from non-contact mapping with the inherent limitations of this type of mapping. It was chosen for its ability to provide ‘beat-to-beat’ mapping in the setting of rapid and unstable VT circuits. The registrations between the electroanatomic mapping and CMR scar mapping and between the clinical and in-silico data are performed through anatomical landmark registration. Though this is a simple but effective way of registration, it is susceptible to arbitration. This process can further refined through a deformable registration method which has the advantage of improved reproducibility, however at the expense of introducing systematic error with resultant over-fitting.25 The cardiac model also made several simplifications in particular for
the Purkinje network and pathological changes of cardiac fibre orientations. With any personalization of computational physiology model, there is a degree of uncertainty due to the limitations in acquired temporal and spatial resolution clinical data. Extending
method could account the uncertainties in the application of the model.26
Conclusion
Patient-specific spatial heterogeneity of restitution properties were the distinguishing features of ventricular arrhythmogenicity, with re-entrant VT exit points present in regions of higher maximum APD-RC slopes compared with the surrounding tissue. These regions were within the gray zone identified by LGE CMR. Personalized biophysical model was able to predict macroscopic VT circuits and exit point locations in agreement with clinically observed datasets.
Acknowledgements
ZC, RC and JR contributed equally to the production of the manuscript.
This research received funding from the European Community’s Seventh Framework Programme (FP7/2007-2013) under grant agreement n 224495 (EU-Heart project) and the ERC advanced Grant MedYMA 291080. The work was supported by the National Institute for Health Research (NIHR) Biomedical Research Centre at Guy's and St Thomas' NHS Foundation Trust and King's College London.
ZC received an investigator-led educational grant from Medtronic Ltd and a training fellowship grant from British Heart Foundation.
Disclosure
References
1. van Rees JB, Borleffs CJW, de Bie MK, Stijnen T, van Erven L, Bax JJ, Schalij MJ. Inappropriate implantable cardioverter-defibrillator shocks: incidence, predictors, and impact on mortality. J Am Coll Cardiol. 2011;57:556–562.
2. Ghanbari H, Baser K, Yokokawa M, Stevenson W, Bella Della P, Vergara P, Deneke T, Kuck K-H, Kottkamp H, Fei S, Morady F, Bogun F. Noninducibility in
postinfarction ventricular tachycardia as an end point for ventricular tachycardia ablation and its effects on outcomes: a meta-analysis. Circ Arrhythm Electrophysiol. 2014;7:677–683.
3. Komatsu Y, Maury P, Sacher F, Khairy P, Daly M, Lim HS, Zellerhoff S, Jesel L, Rollin A, Duparc A, Mondoly P, Aurillac-Lavignolle V, Shah A, Denis A, Cochet H, Derval N, Hocini M, Haïssaguerre M, Jaïs P. Impact of Substrate-Based Ablation of Ventricular Tachycardia on Cardiac Mortality in Patients with Implantable
Cardioverter-Defibrillators. J Cardiovasc Electrophysiol. 2015;
4. Aliot EM, Stevenson WG, Almendral-Garrote JM, Bogun F, Calkins CH, Delacretaz E, Bella Della P, Hindricks G, Jaïs P, Josephson ME, Kautzner J, Kay GN, Kuck K-H, Lerman BB, Marchlinski F, Reddy V, Schalij M-J, Schilling R, Soejima K, Wilber D, European Heart Rhythm Association (EHRA), Registered Branch of the European Society of Cardiology (ESC), Heart Rhythm Society (HRS), American College of Cardiology (ACC), American Heart Association (AHA). EHRA/HRS Expert Consensus on Catheter Ablation of Ventricular Arrhythmias: developed in a partnership with the European Heart Rhythm Association (EHRA), a Registered Branch of the European Society of Cardiology (ESC), and the Heart Rhythm Society (HRS); in collaboration with the American College of Cardiology (ACC) and the American Heart Association (AHA). Heart Rhythm. 2009;6:886–933.
5. Stevenson WG, Khan H, Sager P, Saxon LA, Middlekauff HR, Natterson PD, Wiener I. Identification of reentry circuit sites during catheter mapping and radiofrequency ablation of ventricular tachycardia late after myocardial infarction. Circulation. 1993;88:1647–1670.
6. Ng J, Jacobson JT, Ng JK, Gordon D, Lee DC, Carr JC, Goldberger JJ. Virtual electrophysiological study in a 3-dimensional cardiac magnetic resonance imaging model of porcine myocardial infarction. J Am Coll Cardiol. 2012;60:423–430.
7. Arevalo H, Plank G, Helm P, Halperin H, Trayanova N. Tachycardia in post-infarction hearts: insights from 3D image-based ventricular models. PLoS ONE. 2013;8:e68872. 8. Deng D, Arevalo H, Pashakhanloo F, Prakosa A, Ashikaga H, McVeigh E, Halperin
H, Trayanova N. Accuracy of prediction of infarct-related arrhythmic circuits from image-based models reconstructed from low and high resolution MRI. Front Physiol. 2015;6:282.
9. Yue AM, Franz MR, Roberts PR, Morgan JM. Global endocardial electrical restitution in human right and left ventricles determined by noncontact mapping. J Am Coll
10. Nash MP, Bradley CP, Sutton PM, Clayton RH, Kallis P, Hayward MP, Paterson DJ, Taggart P. Whole heart action potential duration restitution properties in cardiac patients: a combined clinical and modelling study. Exp Physiol. 2006;91:339–354. 11. Wellens HJ, Brugada P, Stevenson WG. Programmed electrical stimulation of the
heart in patients with life-threatening ventricular arrhythmias: what is the significance of induced arrhythmias and what is the correct stimulation protocol? Circulation. 1985;72:1–7.
12. Coronel R, de Bakker JMT, Wilms-Schopman FJG, Opthof T, Linnenbank AC, Belterman CN, Janse MJ. Monophasic action potentials and activation recovery
intervals as measures of ventricular action potential duration: experimental evidence to resolve some controversies. Heart Rhythm. 2006;3:1043–1050.
13. Relan J, Pop M, Delingette H, Wright GA, Ayache N, Sermesant M. Personalization of a cardiac electrophysiology model using optical mapping and MRI for prediction of changes with pacing. IEEE Trans Biomed Eng. 2011;58:3339–3349.
14. Relan J, Chinchapatnam P, Sermesant M, Rhode K, Ginks M, Delingette H, Rinaldi CA, Razavi R, Ayache N. Coupled personalization of cardiac electrophysiology models for prediction of ischaemic ventricular tachycardia. Interface Focus. 2011;1:396–407.
15. Mitchell CC, Schaeffer DG. A two-current model for the dynamics of cardiac membrane. Bull Math Biol. 2003;65:767–793.
16. Souders CA, Bowers SLK, Baudino TA. Cardiac fibroblast: the renaissance cell. Circ
Res. 2009;105:1164–1176.
17. Ciaccio EJ, Ashikaga H, Kaba RA, Cervantes D, Hopenfeld B, Wit AL, Peters NS, McVeigh ER, Garan H, Coromilas J. Model of reentrant ventricular tachycardia based on infarct border zone geometry predicts reentrant circuit features as determined by activation mapping. Heart Rhythm. 2007;4:1034–1045.
18. Camelliti P, Borg TK, Kohl P. Structural and functional characterisation of cardiac fibroblasts. Cardiovasc Res. 2005;65:40–51.
19. Estner HL, Zviman MM, Herzka D, Miller F, Castro V, Nazarian S, Ashikaga H, Dori Y, Berger RD, Calkins H, Lardo AC, Halperin HR. The critical isthmus sites of ischemic ventricular tachycardia are in zones of tissue heterogeneity, visualized by magnetic resonance imaging. Heart Rhythm. 2011;8:1942–1949.
20. Perez-David E, Arenal A, Rubio-Guivernau JL, Del Castillo R, Atea L, Arbelo E, Caballero E, Celorrio V, Datino T, Gonzalez-Torrecilla E, Atienza F,
Ledesma-Carbayo MJ, Bermejo J, Medina A, Fernandez-Aviles F. Noninvasive identification of ventricular tachycardia-related conducting channels using contrast-enhanced magnetic resonance imaging in patients with chronic myocardial infarction comparison of signal intensity scar mapping and endocardial voltage mapping. J Am Coll Cardiol.
2011;57:184–194.
fibrillation. J Cardiovasc Electrophysiol. 1999;10:1087–1089.
22. Clayton RH, Holden AV. A method to quantify the dynamics and complexity of re-entry in computational models of ventricular fibrillation. Phys Med Biol. 2002;47:225– 238.
23. Ashikaga H, Arevalo H, Vadakkumpadan F, Blake RC, Bayer JD, Nazarian S, Muz Zviman M, Tandri H, Berger RD, Calkins H, Herzka DA, Trayanova NA, Halperin HR. Feasibility of image-based simulation to estimate ablation target in human ventricular arrhythmia. Heart Rhythm. 2013;
24. Rudy Y. Noninvasive electrocardiographic imaging of arrhythmogenic substrates in humans. Circ Res. 2013;112:863–874.
25. Ravanelli D, dal Piaz EC, Centonze M, Casagranda G, Marini M, Del Greco M, Karim R, Rhode K, Valentini A. A novel skeleton based quantification and 3-D volumetric visualization of left atrium fibrosis using late gadolinium enhancement magnetic resonance imaging. IEEE Trans Med Imaging. 2014;33:566–576.
26. Konukoglu E, Relan J, Cilingir U, Menze BH, Chinchapatnam P, Jadidi A, Cochet H, Hocini M, Delingette H, Jaïs P, Haïssaguerre M, Ayache N, Sermesant M. Efficient probabilistic model personalization integrating uncertainty on data and parameters: Application to eikonal-diffusion models in cardiac electrophysiology. Prog Biophys
Figure titles and legends
Figure 1 Personalized computer modelling process
Upper panel: (A) high-resolution contrast-enhanced CMR scar images; (B) whole heart model segmented from 3D steady-state free precession (SSFP) CMR with scar (core and gray zone) in violet; (C) low voltage areas from electroanatomical mapping. Lower panel: (D) model personalization and in silico VT stimulation study procedure workflow.
The above figure describes the study protocol and workflow of the data analysis. High-resolution CMR images (A) provided an accurate structure of the cardiac model, incorporating scar details including scar core and score border zone (gray zone) (B). Additional whole heart (LV) electrical parameters such as APD, APD restitution properties and conductivity (C) are acquired through electrophysiology studies and incorporated into the model personalisation (D). VT stimulation study is performed clinically and in silico in parallel on a subset of patient cohort to allow a comparison of outcomes. The electrical parameters at the site of VT exit points are analysed to assess the characteristic features that would support the arrhythmia substrate.
Figure 2. LV polar plot representation of the spatial distribution of the maximum slope
for APD-RCs, maximum asymptotic APD and AC.
Scars identified by LGE CMR with its border zone (highlighted by gray contours) and
clinically observed exit points (highlighted in Patient 1 and 2 by fang-shaped* white contours during re-entrant VT are overlaid to the polar plots.
*Fang-shaped due to unfolding of 3D volume surface to 2D polar plot)
in terms of AC and APD-RC slope for each patient (P1-P7).
The separating line with a maximal margin was computed here using the Support Vector Machine algorithm.
Figure 4. Isochrones map during re-entrant VT.
(A) Patient 1 with VT cycle length 275ms; (B) Patient 2 with VT cycle length 245ms. In
Patient 1, the sustained VT self-terminated 42 seconds after failed attempts of overdrive pacing given due to patient’s stable hemodynamic response. In Patient 2, the sustained VT required DC-cardioversion due to patient’s unfavorable hemodynamic response. The 3D VT isochrones with exit points (red) in relation with scar core (white) and gray zone (gray) are shown in the left panels. Unipolar electrograms recording during VT are shown in the middle panels. LV polar plots of VT isochrones illustrating the direction of activation pattern are shown in the right panels. In Patient 1, the endocardial activation recorded from EAM showed the re-entrant VT circuit initiating from the LV lateral wall, spreading anteriorly and then posteriorly before returning to the lateral wall. In Patient 2, the re-entrant VT circuit exited from the LV infero-lateral wall, spreading antero-laterally and then towards the septum, before returning to the infero-lateral wall.
Figure 5.
A. VT isochrones of induced re-entrant VT during clinical VT stimulation study (left
panel) and during in silico VT stimulation study (right panel).
The arrows point towards the directions of propagation. Scars (core and gray zone) are superimposed to the LV shell shown in darkened regions. The personalized model of patient 1 predicted a sustained re-entrant VT circuit with a cycle length of 260ms compared with the clinically observed cycle length of 275ms with a macroscopically similar activation pattern
and a predicted exit point that matched with the observed clinical one. The personalized model of patient 2 also predicted a positive VT stimulation study with a cycle length of 250ms compared with 245ms for the clinical VT. The induced VT was sustained and the entrant pathway stable. Notably the direction of the activation pattern during the predicted re-entrant VT was reversed from that observed clinically; however, the predicted exit point correlated with the clinically observed one.
B. Estimation of the intra-myocardial path between the entry and exit points during
re-entrant VT.
The isochrones map demonstrates the estimated endocardial 2D geodesic path between the entry and exit points from electroanatomical study during clinical VT stimulation study. Estimated intra-myocardial 3D geodesic path (red line) takes into account of the scar heterogeneity from the high-resolution CMR images. The graded colours on the 3D path, with blue denoting late activation and red denoting early activation, illustrate the entry and exit points. The activation wave front of the re-entrant VT propagates in the region of the gray zone. The estimated wave front path surrounds the scar core and lies within the scar border zone, entering from the endocardial surface, meandering within the ventricular wall, and exiting via the epicardial surface.
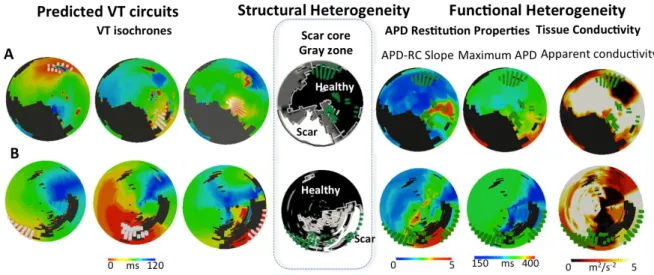
Figure 6. Correlation of predicted exits points with structural heterogeneity and
functional heterogeneity.
A = Patient 1. B = Patient 2. The left panel shows the isochrones for the three predicted VT circuits with fangs of white lines denoting the exit points. The middle panel demonstrates the LV scar distribution with black region denoting healthy myocardium, white region denoting the scar core and the gray region denoting the gray zone/scar boarder zone with overlying composite exit points (fanged green lines). The right panel demonstrates the electrical
Figure 1 (A) high-resolution contrast-enhanced CMR scar images; (B) whole heart model
segmented from 3D steady-state free precession (SSFP) CMR with scar (core and gray zone) in violet; (C) low voltage areas from electroanatomical mapping. Lower panel: (D) model personalization and in silico VT stimulation study procedure workflow.
The above figure describes the study protocol and workflow of the data analysis. High-resolution CMR images (A) provided an accurate structure of the cardiac model, incorporating scar details including scar core and score border zone (gray zone) (B).
Additional whole heart (LV) electrical parameters such as APD, APD restitution properties and conductivity (C) are acquired through electrophysiology studies and incorporated into the model personalization (D). VT stimulation study is performed clinically and in silico in parallel on a subset of patient cohort to allow a comparison of outcomes. The electrical parameters at the site of VT exit points are analyzed to assess the characteristic features that would support the arrhythmia substrate.
Figure 2. LV polar plot representation of the spatial distribution of the maximum slope for APD-RCs, maximum asymptotic APD and AC.
Scars identified by LGE CMR with its border zone (highlighted by gray contours) and
clinically observed exit points (highlighted in Patient 1 and 2 by fang-shaped* white contours during re-entrant VT are overlaid to the polar plots.
Figure 3. Percentages of LV spatial domains with high gradient (> 90th percentile of the gradient range) as a representation of spatial differences between neighbouring regions in terms of AC and APD-RC slope for each patient (P1-P7).
The separating line with a maximal margin was computed here using the Support Vector Machine algorithm.
Figure 4. Isochrones map during re-entrant VT.
(A) Patient 1 with VT cycle length 275ms; (B) Patient 2 with VT cycle length 245ms.
In Patient 1, the sustained VT self-terminated 42 seconds after failed attempts of overdrive pacing given due to patient’s stable hemodynamic response. In Patient 2, the sustained VT required DC-cardioversion due to patient’s unfavorable hemodynamic response. The 3D VT isochrones with exit points (red) in relation with scar core (white) and gray zone (gray) are shown in the left panels. Unipolar electrograms recording during VT are shown in the middle panels. LV polar plots of VT isochrones illustrating the direction of activation pattern are shown in the right panels. In Patient 1, the endocardial activation recorded from EAM showed the re-entrant VT circuit initiating from the LV lateral wall, spreading anteriorly and then posteriorly before returning to the lateral wall. In Patient 2, the re-entrant VT circuit exited from the LV infero-lateral wall, spreading antero-laterally and then towards the septum, before returning to the infero-lateral wall.
Figure 5.
A. VT isochrones of induced re-entrant VT during clinical VT stimulation study (left panel) and during in silico VT stimulation study (right panel).
The arrows point towards the directions of propagation. Scars (core and gray zone) are superimposed to the LV shell shown in darkened regions. The personalized model of patient 1 predicted a sustained re-entrant VT circuit with a cycle length of 260ms compared with the clinically observed cycle length of 275ms with a macroscopically similar activation pattern and a predicted exit point that matched with the observed clinical one. The personalized model of patient 2 also predicted a positive VT stimulation study with a cycle length of 250ms compared with 245ms for the clinical VT. The induced VT was sustained and the entrant pathway stable. Notably the direction of the activation pattern during the predicted re-entrant VT was reversed from that observed clinically; however, the predicted exit point correlated with the clinically observed one.
B. Estimation of the intra-myocardial path between the entry and exit points during re-entrant VT.
The isochrones map demonstrates estimated endocardial 2D geodesic path between the entry and exit points from electroanatomical study during clinical VT stimulation study. Estimated intra-myocardial 3D geodesic path (red line) takes into account of the scar heterogeneity from
the high-resolution CMR images. The graded colours on the 3D path with blue denoting late activation and red denoting early activation illustrate the entry and exit points. The activation wave front of the re-entrant VT propagates in the region of the gray zone. The estimated wave front path surrounds the scar core and lies within the scar border zone, entering from the endocardial surface, meandering within the ventricular wall, and exiting via the epicardial surface.
Figure 6. Correlation of predicted exits points with structural heterogeneity and functional heterogeneity.
A = Patient 1. B = Patient 2. The left panel shows the isochrones for the three predicted VT circuits with fangs of white lines denoting the exit points. The middle panel demonstrates the LV scar distribution with black region denoting healthy myocardium, white region denoting the scar core and the gray region denoting the gray zone/scar boarder zone with overlying composite exit points (fanged green lines). The right panel demonstrates the electrical properties with overlying composite exit points (fanged green lines).
Tables
Table 1. Baseline patient characteristics and CMR findings.
ACE-I= angiotensin converting enzyme inhibitor; AF= atrial fibrillation; ARB= angiotensin receptor blocker; CMR= cardiac magnetic resonance imaging; EDV= end-diastolic volume; EF= ejection fraction; ICM= ischaemic cardiomyopathy; LV= left ventricle/ventricular; NICM= non-ischaemic dilated cardiomyopathy; PAF= paroxysmal atrial fibrillation.
Patient 1 2 3 4 5 6 7
Condition ICM ICM ICM ICM ICM NICM NICM
Gender M M M M F M M
Age 73 69 64 60 65 75 81
Co-morbidities HTN None HTN, AF DM None AF PAF
B-blocker Yes Yes Yes Yes Yes Yes Yes
ACE-I/ARB Yes Yes Yes Yes Yes Yes Yes
Statins Yes Yes Yes Yes Yes No Yes
LVEF, % 27 35 35 25 31 36 17
LVEDV, ml 199 292 245 304 185 196 285
LV mass, g 129 172 147 182 118 119 206
Scar on CMR Yes Yes Yes Yes Yes Yes Yes
Scar core, g 14 22 24 31 16 23 18